11email: alina@iac.es 22institutetext: Universidad de La Laguna (ULL), Dept. Astrofísica, E-38203 La Laguna, Tenerife, Spain 33institutetext: School of Chemistry and Physics, University of KwaZulu-Natal, Westville Campus, Private Bag X54001, Durban, 4000, South Africa 44institutetext: Tartu Observatory, University of Tartu, Observatooriumi 1, 61602, Toravere, Estonia
Optical validation and characterization of Planck PSZ2 sources at the Canary Islands observatories. I. First year of LP15 observations
Abstract
Context. The second catalogue of Planck Sunyaev-Zeldovich (SZ) sources, hereafter PSZ2, is the largest sample of galaxy clusters selected through their SZ signature in the full sky. At the time of publication, 21 % of these objects had no known counterpart at other wavelengths. Using telescopes at the Canary Island observatories, we conducted the long-term observational programme 128-MULTIPLE-16/15B (hereafter LP15), a large and complete optical follow-up campaign of all the unidentified PSZ2 sources in the northern sky, with declinations above and no correspondence in the first Planck catalogue PSZ1.
Aims. The main aim of LP15 is to validate all those SZ cluster candidates, and to contribute to the characterization of the actual purity and completeness of full Planck SZ sample. In this paper, we describe the full programme and present the results of the first year of observations.
Methods. The LP15 programme was awarded 44 observing nights, spread over two years in three telescopes at the Roque de los Muchachos Observatory. The full LP15 sample comprises 190 previously unidentified PSZ2 sources. For each target, we performed deep optical imaging and spectroscopy. Our validation procedure combined this optical information with SZ emission as traced by the publicly available Planck Compton -maps. The final classification of the new galaxy clusters as optical counterparts of the SZ signal is established according to several quantitative criteria based on the redshift, velocity dispersion and richness of the clusters.
Results. This paper presents the detailed study of 106 objects out of the LP15 sample, corresponding to all the observations carried out during the first year of the programme. We confirmed the optical counterpart for 41 new PSZ2 sources, being 31 of them validated using also velocity dispersion based on our spectroscopic information. This is the largest dataset of newly confirmed PSZ2 sources without any previous optical information. All the confirmed counterparts are rich structures (i.e. they show high velocity dispersion), and are well aligned with the nominal Planck coordinates (i.e., % of them are located at less than 3 distance). In total, 65 SZ sources are classified as unconfirmed, being 57 of them due to the absence of an optical over-density, and 8 of them due to a weak association with the observed SZ decrement. Most of the sources with no optical counterpart are located at low galactic latitudes and present strong galactic cirrus in the optical images, being the dust contamination the most probable explanation for their inclusion in the PSZ2 catalogue.
Key Words.:
large-scale structure of Universe – Galaxies: clusters: general – Catalogues1 Introduction
The study of the anisotropies in the cosmic microwave background (CMB) has become one of the most powerful tools in the field of cosmology and physics of the early Universe. A large amount of new observational data collected from different facilities and observatories allows testing and validating our cosmological model down to per cent accuracy (Planck Collaboration XIII 2016; Planck Collaboration VI 2018). However, further progress is still needed in the measurement of the cosmological parameters if we want to solve some of the tensions that appear when comparing the CMB constraints on some parameters with those coming from other astrophysical probes (Planck Collaboration VI 2018). For example, the measurement of the mass density of the Universe or the normalization of the matter power spectrum remain important and challenging problems (Planck Collaboration XXIV 2015).
Progress in this topic might come from detailed studies on clusters of galaxies. Massive clusters are particularly sensitive to the cosmology (e.g., Planck Collaboration XX 2014). However, due to its rareness, only large-volume surveys could present big enough samples for detailed investigations.
In the last decade, the Sunyaev-Zeldovich (SZ) effect (Sunyaev & Zeldovich 1972) has become a powerful technique in cosmology as an instrument to detect such massive clusters. This effect produces a spectral distortion of the cosmic microwave background (CMB) generated by the inverse Compton interaction between the CMB photons and the hot intracluster gas of electrons. Today, thanks to the Planck111Planck http://www.esa.int/Planck is a project of the European Space Agency (ESA) with instruments provided by two scientific consortia funded by ESA member states and led by Principal Investigators from France and Italy, telescope reflectors provided through a collaboration between ESA and a scientific consortium led and funded by Denmark, and additional contributions from NASA (USA). satellite we were able for the first time to detect galaxy clusters via the SZ effect in a full-sky survey (Planck Collaboration XXIX 2014; Planck Collaboration XXVII 2016).
During the first 1.5 years of the mission, several catalogues have been released: the early ESZ catalogue (Planck Collaboration VIII 2011), and the first official Planck SZ catalogue (Planck Collaboration XXIX 2014, hereafter, PSZ1). In 2015, the second and final catalogue, based on the full mission data, was released (Planck Collaboration XXVII 2016, hereafter, PSZ2). It contains 1653 sources (in comparison with 1227 clusters presented in PSZ1), and is the largest SZ-selected sample of galaxy clusters candidates today.
Despite the detailed validation process carried out by the Planck collaboration, there was a significant fraction of the sample (559 objects at the time of the PSZ2 publication) with no known counterparts. Moreover, some of the SZ sources, especially those with a low significance SZ detection, may correspond to spurious enhancements of the SZ signal due to the galactic dust contribution at the Planck higher frequencies (e.g. Planck Collaboration Int. XLVIII 2016). A systematic follow-up study at other wavelengths might help to disentangle this problem. In addition, being the SZ surface brightness independent on redshift, the SZ flux alone cannot provide either the distance or the dynamical mass information of the clusters.
Thus, in order to make the SZ catalogues appropriate for cosmological studies, in 2010–2018 the Planck Collaboration and several individual research groups performed a few extensive follow-up programmes dedicated to confirm SZ sources from those catalogues, using ground-based and space facilities (e.g. Planck Collaboration Int. IV 2013; Planck Collaboration Int. XXVI 2015; Liu et al. 2015; van der Burg et al. 2016; Burenin et al. 2018; Boada et al. 2019). Telescopes at Canary Islands Observatories have actively participated in these validation and characterization efforts of Planck catalogues (Planck Collaboration XXXVI 2016; Barrena et al. 2018). The first two catalogues, ESZ and PSZ1, have been partially observed and validated through the International Time Programme222ITP: http://www.iac.es/eno.php?op1=5&op2=13&lang=en ITP12-2 and ITP13-08 (e.g. Planck Collaboration XXXVI 2016; Barrena et al. 2018, 2019). As a result, we retrieved physical properties and confirmed almost 200 previously unknown clusters with . This validation programme provided also important information for cosmological studies with clusters. For example, it was used to constrain the bias between SZ mass and dynamical mass (Ferragamo et al. 2019).
The new PSZ2 catalogue333The PSZ2 catalogue (FITS format) and a detailed description of its content can be found at the Planck 2015 Release Explanatory Supplement https://wiki.cosmos.esa.int/planckpla2015/. , as a final and uniformly selected sample, provides new galaxy cluster candidates which could be used to constrain cosmological parameters. With this aim, and taking into account the impact of our previous observational efforts for PSZ1, the new long-term follow-up programme has been launched in order to validate the second and final Planck catalogue. This programme is the largest and the most complete optical follow-up campaign of unconfirmed PSZ2 sources in the northern sky.
The current paper describes the rationality and strategy assumed for the LP15 follow-up campaign, together with the results from the first year of observations. The results of the second year observations, and the final conclusions of the programme, will be presented in Aguado-Barahona et al. (2019), in preparation.
This paper is organized as follows. Section 2 describes the Planck PSZ2 catalogue and present motivation and strategy of our long-term programme, observation and data reduction. Section 3 shows the methodology used for new cluster identification. In Section 4, we discuss the results of the PSZ2 characterization exposed in this work, including a detailed description of some particular SZ targets (multiple detections, presence of gravitational arcs etc). Finally, in Section 5 we present the conclusions.
We adopt CDM cosmology with = 0.3075, = 0.691 and H0= 67.74 km s-1 Mpc-1.
| Telescope | Aperture [m] | Instrument | FoV | Pixel Scale [”] | Resolution | N | N(y1/y2) | N(y1/y2) |
|---|---|---|---|---|---|---|---|---|
| INT | 2.5 | WFC | 0.33 | – | 21 | 210 (102/108) | – | |
| TNG | 3.5 | DOLORES | 0.252 | 13 | – | 20 (14/6) | ||
| GTC | 10.4 | OSIRIS | 0.254 | 80h (=10 nights) | – | 44 (23/21) |
2 LP15 Optical follow-up campaign
2.1 The Planck PSZ2 cluster sample
The PSZ2 catalogue has been produced from the data of the full-mission survey of Planck corresponding to 29 months of observations. It contains 1653 detections; 937 sources are common to PSZ1, while 716 are unique. 291 sources from the PSZ1 catalogue are not anymore in PSZ2.
The methodology used to construct the PSZ2 is an extended and refined version of the PSZ1 one (Planck Collaboration XXIX 2014). The PSZ2 cluster candidates, similarly to PSZ1, are blindly selected using three different detection algorithms (Planck Collaboration XXVII 2016). Two of the algorithms (MMF1 and MMF3) are based on the same Matched Multi-filters technique. The third one (PowellSnakes or PwS) is based on a fast Bayesian approach to discrete object detection. The catalogue contains all objects found by at least one of these three methods with a significance S/N. In order to clean the PSZ2 catalogue from the spurious detections associated with galactic diffuse emission, some additional restrictions have been added into the pipeline, together with the removal of those detections confirmed to be spurious by the PSZ1 follow-ups. More detailed description of the PSZ2 catalogue construction can be found in Planck Collaboration XXVII (2016).
Thanks to the existing surveys and previous intensive follow-up campaigns, about 73 % of the sources (1203) in PSZ2 are confirmed clusters, from which 66 % (1094) have redshift estimates. The detailed information about the follow-up observations and cross-correlation with ancillary catalogues at different wavelengths is reported in Sec. 7 of Planck Collaboration XXVII (2016).
At the time of the catalogue publication, among unconfirmed 559 sources (both PSZ1 and PSZ2), 450 objects had no validation from other wavelengths. From them 350 cluster candidates were unique for PSZ2 catalogue (i.e. not detected previously in PSZ1 dataset).
2.2 Sample definition and observational strategy
The main motivation of our observational effort was to carry out a systematic follow-up of the complete set of PSZ2 cluster candidates in the northern sky, with no confirmed counterparts at the moment of the catalogue publication. The validation information available at that time was included in one of the columns of the PSZ2 catalogue, named validation, and contained a summary of all the external identifications. For the definition of the LP15 sample, we choose all sources in PSZ2 with validation = -1 (i.e. no known external counterpart), PSZ1 = -1 (i.e. no matching detection in the PSZ1 catalogue), and declination above (to be easily accesible from the Canary Islands Observatories). This corresponded to 190 targets (out of the 350 unvalidated all-sky sources).
The reason why we excluded the PSZ1 targets from this sample (48 in total) is that all those objects are already part of a dedicated follow-up campaing (Barrena et al. 2018), and thus, they have been already observed by our team.
This set of LP15 sources was observed during four semesters, 2015B–2017A, within the frame of the long-term programme 128-MULTIPLE-16/15B (hereafter LP15). In total, 106 targets were studied during the first year of the programme (semesters 15B and 16A), while the remaining 83 were observed during the second year (semesters 16B and 17A).
All the observations were carried out at the Roque de los Muchachos Observatory (ORM) on the island of La Palma (Spain) using the following telescopes: the 2.5 m Isaac Newton Telescope (INT), the 3.5 m Italian Telescopio Nazionale Galileo (TNG), and the 10.4 m Gran Telescopio Canarias (GTC). For these three telescopes, we requested in total 44 nights, approximately 50 % of them were dedicated to obtain photometric data (INT) and other 50 % of nights to spectroscopic observations (TNG and GTC). We summarize main information about LP15 in Table 1. Our sample of 190 sources corresponded to % of all unidentified PSZ2 objects, making our programme the largest optical validation campaign of unconfirmed PSZ2 clusters to date.
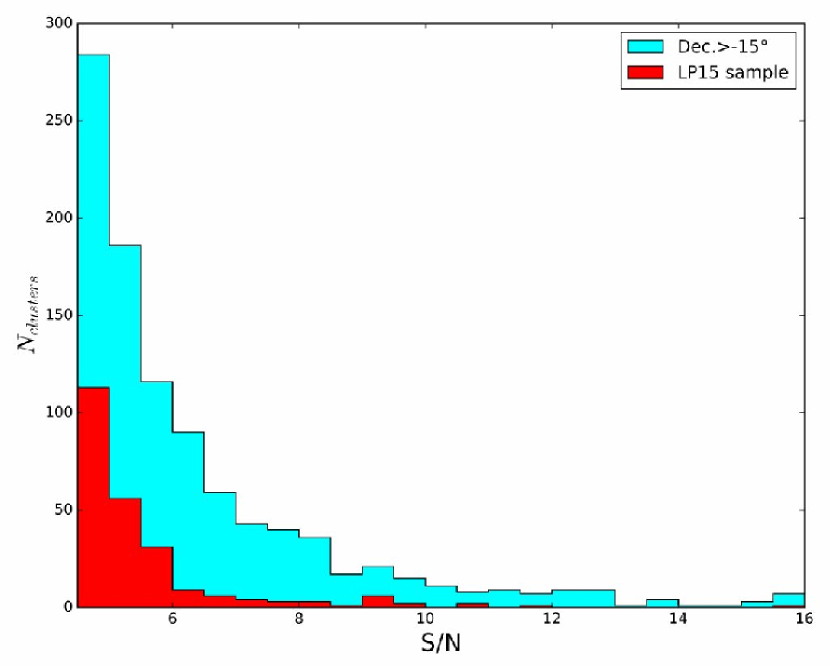
Figure 1 presents the distribution of cluster counts as a function of S/N for the full sample of sources observed during LP15 campaign, in comparison with the total set of 1003 PSZ2 sources located at Dec.. As it was expected, most of our sources have , as the most difficult to validate using some serendipitous shallow surveys available before our program.
We adopted an observational strategy very similar to the ITP13-08 Programme (PSZ1 sources). Before including PSZ2 sources for photometric observations, we did the initial pre-screening of the proposed targets by searching for possible counterparts in the Sloan Digital Sky Survey (SDSS)444http://skyserver.sdss.org DR12 photometric and spectroscopic data (Streblyanska et al. 2018). If a cluster counterpart was already confirmed in the SDSS data, new imaging observations were not required in our LP15 programme, and the cluster was directly considered for spectroscopy with the aim of obtaining its mean redshift, velocity dispersion and dynamical mass. Galaxy cluster members with SDSS spectroscopic information were also considered for the mean cluster redshift calculation. After such pre-screening, we included all the unidentified PSZ2 sources as targets for deep imaging using , and broad-band filters.
In particular, for the subset of 106 sources studied during the first year of the LP15 programme and included in this paper, 14 of them were already discussed in Streblyanska et al. (2018). Of those, 9 had already a preliminary redshift estimation, and 5 were considered potential associations.
If cluster counterparts were identified using either our images or the SDSS data, we performed spectroscopic observations using multi-object spectroscopy (MOS). We used the GTC telescope to observe the most distant cluster candidates (at ), while the TNG was used for the nearest ones (at ). As the last step, taking into account all the photometric and spectroscopic information, the cluster validation was performed using the selection criteria outlined in Sect. 3.
2.3 Imaging observations and data reduction
Imaging observations were obtained using the Wide-Field Camera (WFC) installed in the 2.5 m Isaac Newton Telescope (INT). The WFC camera at the INT is a four CCDs mosaic with a field of view (FOV) of and a pixel scale of . To acquire the images, we performed a small dithering technique of three points with offsets of , in order to clear the resultant image from bad pixels, vignetting and fringing effects and be able to minimize the impact of cosmic rays. The exposure times vary between 900 s and 1500 s per band depending on the magnitudes of the galaxies observed, which yields to completeness and limit magnitudes (90% fractional completeness) in -band of 22.2 and 23.6 respectively. The seeing conditions also vary from to . The photometric data were reduced using standard IRAF555IRAF (http://iraf.noao.edu/) is distributed by the National Optical Astronomy Observatories, which are operated by the Association of Universities for Research in Astronomy, Inc., under cooperative agreement with the National Science Foundation. routines. The astrometric solution was implemented using the images.imcoords IRAF tasks and the USNO B1.0 catalogue (Monet et al. 2003) as a reference. The final astrometric surface provided a precision of about 002 in the centre of the fields, and only in the very outskirts the astrometric error was about 1. Therefore, the mean rms obtained across the full field of view was 02.
The photometric calibration refers to SDSS photometry and SDSS standard fields. Images obtained during non-photometric nights were calibrated in posteriors runs. In order to detect the sources in the images, we have used SExtractor (Bertin & Arnouts 1996) in single-image mode. We detected sources in -, - and -bands with S/N in at least 10 adjacent pixels that implies a 1.5 detection thresholds in the filtered maps. Using the MAGAUTO mode, elliptical aperture photometry was performed setting the Kron factor and the minimum radius to the default values (2.5 and 3.5 respectively). Finally, the resultant catalogues were merged to create a master catalogue containing the information of every band.
We also used images in -, - and -bands to create the deep RGB images which have been used for the visual inspection in our validation work (see Sec. 3).
The broad-band images used to carry out this work has been included in the Virtual Observatory (VO)666http://www.ivoa.net/ collection for public access. In the near future, our photometric and spectroscopic catalogues will be also available through this facility.
| Flag | MOS Spectroscopy | limit (km s-1) | |
|---|---|---|---|
| 1 | YES | 500 for 00.2 | – |
| 650 for 0.2 | – | ||
| 2 | NO | NA | 1.5 |
| 3 | YES | 500 for 00.2 | – |
| 650 for 0.2 | – | ||
| NO | – | 1.5 | |
| ND | – | – | – |
2.4 Spectroscopic observations and data reduction
Spectroscopic observations were obtained using the multi-object spectrographs DOLORES (TNG) and OSIRIS (GTC). DOLORES (Device Optimized for the LOw RESolution) is a low resolution spectrograph and camera mounted in the Nasmyth B focus of the TNG. In MOS mode, it can carry up to 5 masks allowing us to include between 40 and 50 slitlets per mask. It has a CCD of 2048 2048 pixels with a pixel size of 13.5 m and a plate scale of 0252. We obtained the data using the LR-B grism which provides a resolution of , a dispersion of 2.75 and operates between 3800 and 8500 . We obtained Hg-Ne and He arcs in order to make the wavelength calibration of the spectra achieving a rms error below 0.1 over the whole wavelength range. We exposed typically s per mask but, depending on the magnitude of the galaxies observed, this time could change.
OSIRIS (Optical System for Imaging and low-Intermediate-Resolution Integrated Spectroscopy) is a low and intermediate resolution spectrograph and camera located in the Nasmyth-B focus of the GTC. Its MOS mode allows up to 70 slitlets per mask with a typical length of 4–5. The instrument is composed of a double CCD of pixels with a pixel size of 15 m and a plate scale of 013. In this work we have used the R300B grism which operates in the range 4000–9000 and gives a dispersion of 5.2 using the binning set-up (). We obtained Hg-Ar, Ne and Xe arcs in order to make the wavelength calibration of the spectra achieving a rms error below 0.2 over the whole wavelength range. We exposed typically 31000 s per mask obtaining typical S/N for galaxies with magnitudes .
We designed the masks by using previous images obtained for each field in the corresponding instrument. We used RGB images (composed by -, - and -bands taken in the INT) as a reference and we included slitlets with galaxies considered cluster likely members, meaning with coherent colours and laying in the red-sequence of the clusters (see Sec. 3.1). By using these criteria, actual cluster members were selected with a success rate of typically 50–60 in the inner regions of the cluster while in the outer regions ( Mpc from the brightest cluster galaxy, BCG) the success rate was around 20 .
The reduction process of the spectra followed the subsequent steps: combination of images, subtraction of sky component from each slit, extraction of spectra, cosmic ray rejection and finally wavelength calibration. Every step was carried out using standard IRAF tasks. We decided not to apply bias and flat-field corrections because it adds additional noise to the spectra without significant improvement of S/N, and our final goal is only the redshift determination. We used Hg-Ne and He-Ne arcs for DOLORES and Hg, Ne and Ag arcs for GTC to do the wavelength calibration. We searched for possible deviations in the calibration using the OI telluric line (5577.3 ). We found no systematic offsets but random fluctuations smaller than 1 , which correspond to – km s-1 depending on the cluster redshift.
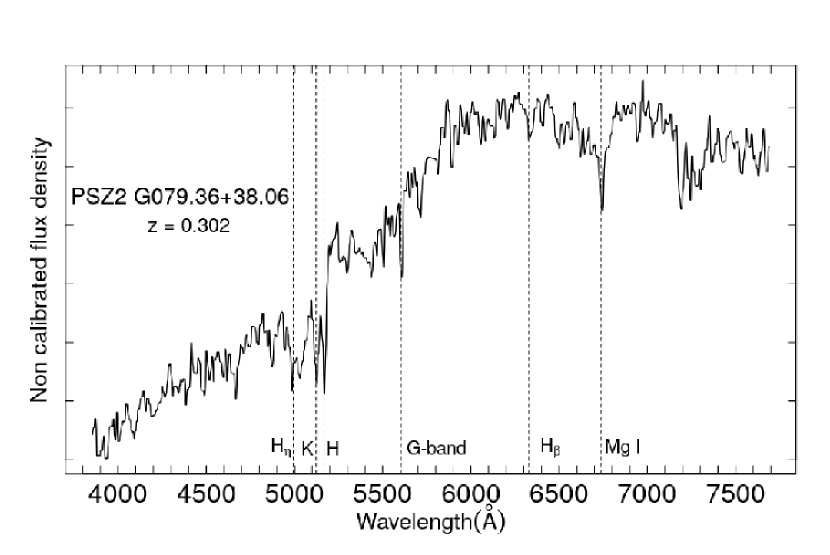
Based on the photometric redshift () estimation (see Sect. 3.1), we divided our sample into two sub-samples. The nearby clusters with were observed at the TNG whereas the distant ones with were observed at the GTC. Figure 2 shows examples of spectra acquired with both telescopes.
In order to obtain the radial velocities of the galaxies, we used the task RVSAO777RVSAO was developed at the Smithsonian Astrophysical Observatory Telescope Data Center. implemented in IRAF. This routine is based on the cross-correlation technique developed by Tonry & Davis (1979). The method consists in performing a cross-correlation between the spectrum of our galaxies and six templates (Kennicutt 1992) of different galaxy type: E, S0, Sa, Sb, Sc and Irr. For each galaxy we adopt the radial velocity that corresponds to the higher value of the parameter R that measures the S/N ratio of the cross-correlation peak. In general, this method worked properly but in some cases the procedure led to a non-realistic , mainly due to the low S/N of the spectra. For this reason, we inspected by eye every result and checked that it was done accurately. In the majority of the spectra, absorption lines were present (mainly H and K CaI doublet, Hβ, G-Band and MgI triplet) when they fall on the wavelength range depending on each galaxy redshift. In a few cases, we could distinguish emission lines such as OII and OIII doublet which were used to determine the redshift.
The cross-correlation technique together with the quality and the spectral resolution of the spectra yields a mean error in the radial velocity estimation of km s-1. However, taking into account double redshift estimations for a set of around 50 galaxies we were able to determine the systematic errors. Making a comparison of the two velocity estimates we obtained a rms of km s-1.
The benefits of using multi-object rather than long-slit spectroscopy is the fact that not only we can determine more precisely the mean redshift of the clusters but also we can infer their velocity dispersion. On average, we retrieved between 10 and 25 cluster members per mask. In a first approximation, a galaxy is considered to be a member of the cluster if its radial velocity lays within 2500 km s-1 in rest frame from the cluster mean radial velocity. Then, we follow an iterative method considering galaxies as members if their radial velocity is less than 2.5 times the velocity dispersion away from the cluster mean velocity. In this way we guarantee that the majority of the selected galaxies are members minimizing the presence of interlopers. We note that, given the FOV of the different facilities, we are usually selecting members for high-z clusters within the region , where is the virial radius defined as the radius enclosing over-density of 200 with respect to the critical density of the universe.
3 Methodology for the identification and confirmation of PSZ2 clusters
We identified, validated and characterized galaxy clusters using the same criteria already adopted in our previous papers (Planck Collaboration XXXVI 2016; Barrena et al. 2018; Streblyanska et al. 2018). In the next subsection, we will describe again those criteria, when applied to our LP15 sample. In short, for each cluster we use the available photometric data, we carry out the visual inspection, the inspection of the Compton -map888MILCA full mission Compton -map can be downloaded from the Foreground maps/Compton-SZmap section located at http://pla.esac.int/pla/#maps (Planck Collaboration XXII 2015), and the analysis of the cluster red sequence (using our photometric redshift estimation). The detected over-densities are evaluated and classified using a richness parameter. Those clusters with spectroscopic data were also evaluated using the value of the calculated velocity dispersion of cluster members.
3.1 Photometric validation criteria
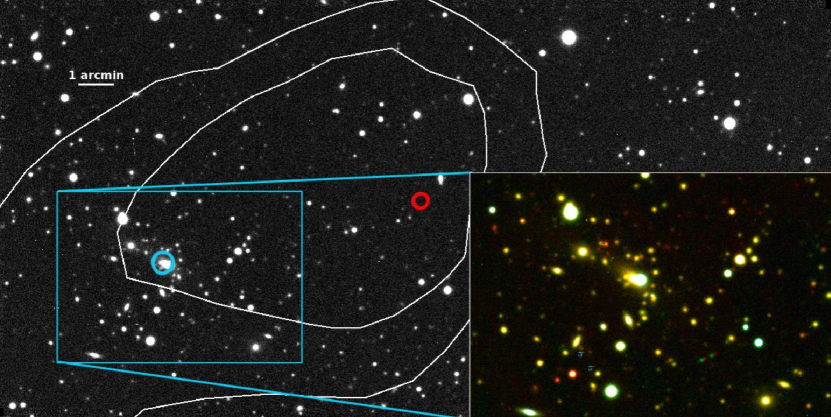
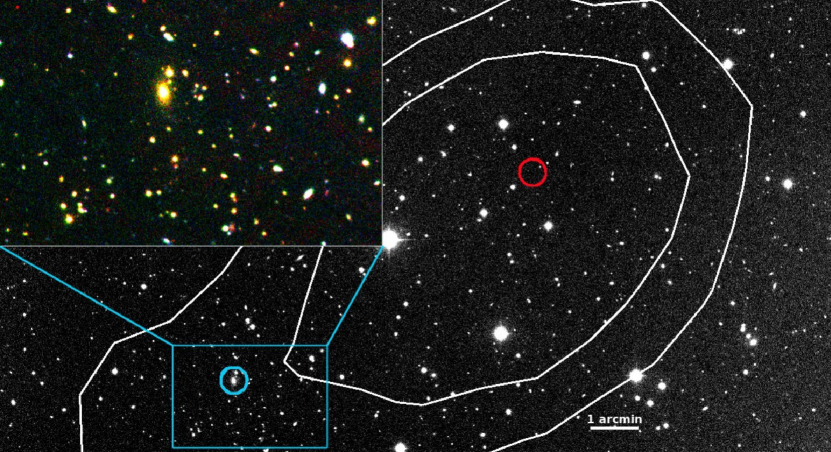
Our validation steps provide quantitative criteria for a robust association between PSZ2 source and the observed optical cluster. The visual inspection of deep RGB images around the official Planck position allows direct identification of clusters and rich groups in the redshift range as a concentration of galaxies of the same colour. In addition, we always inspect the flux density contours observed in the Compton -map (Planck Collaboration XXII 2015), and compare them with the positions of the possible optical association. These maps, constructed from linear combinations of the individual Planck frequency charts, preserve the SZ signal and cancel the influence of the CMB and galactic emission. For most of the clusters we observe the direct dependence between the peak of SZ signal, shifted sometimes from the Planck PSZ2 nominal source position, and the optical counterpart (Streblyanska et al. 2018). Also, if the location of detected over-density is above the expected uncertainty in the Planck detection (, see Fig. 3 in Planck Collaboration XXXVI 2016) then the structures observed in the -map allows us to confirm or reject the association.
Once the clusters were identified, we inspected colour-magnitude diagrams looking for the cluster red sequence (RS) (Gladders & Yee 2000), using the colour-magnitude diagrams (,) and (,). We fit the RS considering all galaxies with colours within the range with respect to the colour of the BCG. We derive the photometric redshift of the galaxy over-densities following equations (1) and (2) from Planck Collaboration XXXVI (2016). After estimating the , we evaluated the richness of detected systems to validate the observed galaxy clusters as actual SZ counterparts.
The PSZ2 survey selection function (see Fig. 26 of Planck Collaboration XXVII 2016) shows that the expected Planck SZ detections are massive systems, with a mean mass over the whole redshift range of M⊙. Therefore, we would expect our sample to be composed by massive rich clusters, and thus, no poor systems should in principle be validated if they are found along the line of sight of the Planck detection. In order to adopt an objective criterion for discarding low mass systems, we defined a richness parameter (). There are multiple approaches in the literature to calculate the richness of the observed systems. In this paper, we present a refined proceduce with respect to our methodology in previous works (Barrena et al. 2012), taking into account the local background variance and making it more robust in comparison with other validation works in the literature. In short, is computed as the number of likely members (galaxies in the RS magnitude locus) in and for clusters at and , respectively, showing magnitudes in the range , where is the characteristic magnitude and depends on the redshift (see Barrena et al. 2012). We count galaxies within a projected region of 1 Mpc radius from the optical center of the cluster at its redshift. This initial value of the richness () is then corrected for the field galaxy counts (), which is computed in the same way but outside the 1 Mpc radius region for each cluster. We must stress that this final value () should be considered as a lower limit to the richness of the system, as we are formally counting in the estimation some clusters members that might lay outside the 1 Mpc region.
We based our confirmation criterion in the value , which is computed as , and describes the richness significance above the local background level. Given that in our calculations the richness is not a fixed value, and depends on the local environment, we can in principle equally good validate clusters observed either in crowded star fields or in empty areas.
Despite the flexibility and robustness of this approach to calculate the richness, we observed in two situations the weakness of this method. First, the method is not working properly when the FOV is relatively small compared to the cluster size. Also, it could produce wrong results if we observe an over-density of sources in the background. The algorithm then calculates artificially a high background and, consequently, shows an underestimated value of due to the over-subtraction of this local background from the data. If this is the case, after the careful inspection of the images, we decided to keep the original (uncorrected) value (see notes in Table 3).
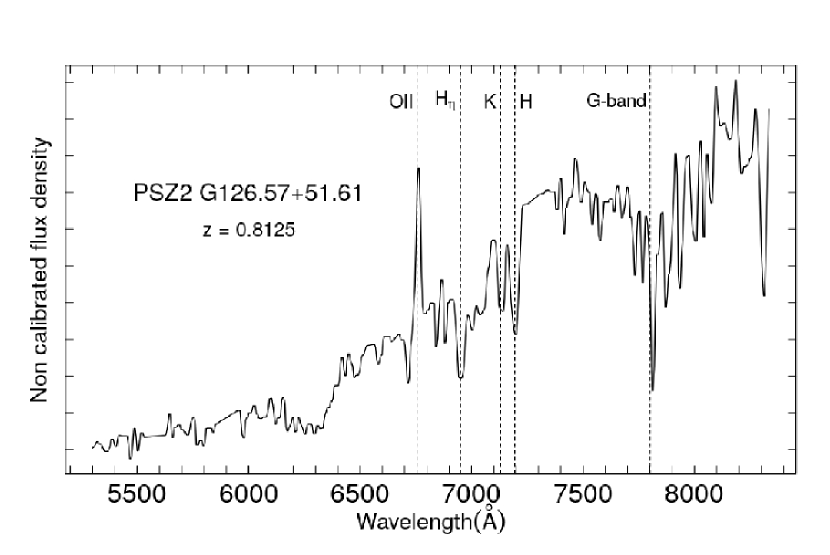
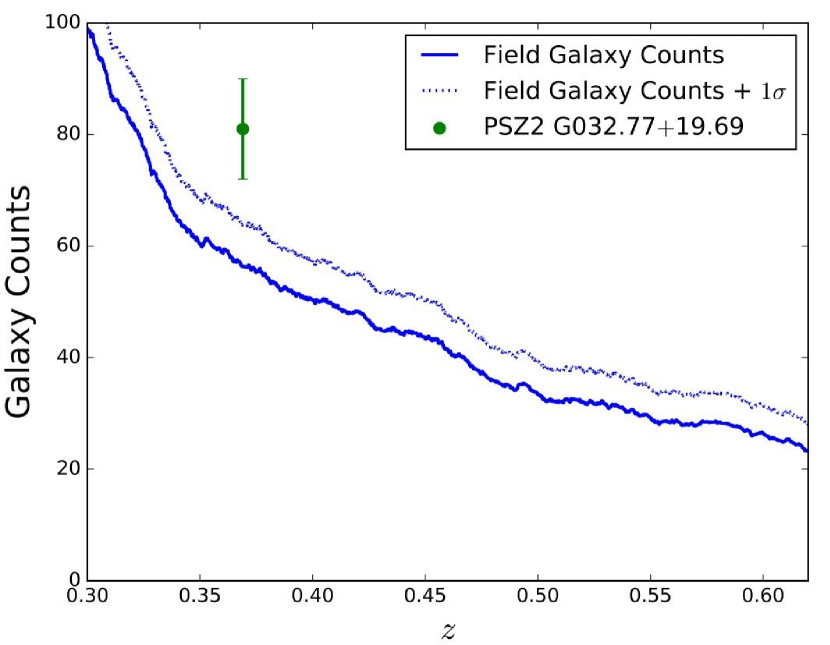
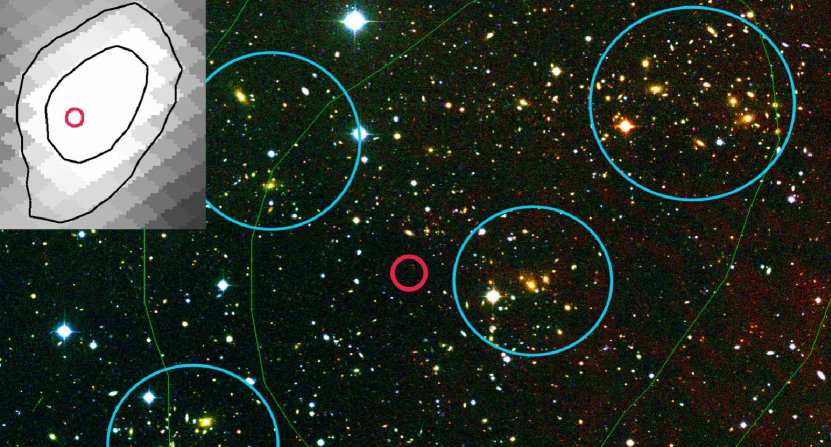
Fig. 3 illustrates our method for the determination of the richness using one of the confirmed clusters from our sample. The initial values of richness for the the cluster was . PSZ2 G032.77+19.69 is located in a crowded star area, so the richness of the field at the redshift of the cluster is also high () yielding and .
3.2 Spectroscopic validation criteria
In addition to the photometric data, we obtained for almost all clusters spectroscopic information. This includes our own observation and publicly available data from the SDSS survey.
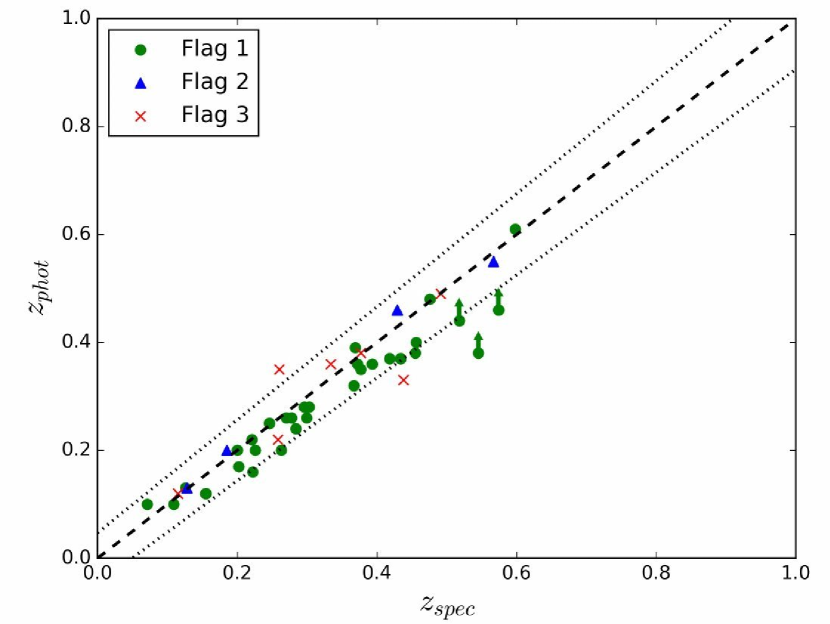
We find a good agreement between the photometric and spectroscopic redshifts for all our PSZ2 sources, except for high-z clusters (see Fig. 4). We recall that our photometric redshift is based in the colour of likely cluster members (Planck Collaboration XXXVI 2016), which is not appropriate estimator for systems at . Obtaining secure redshift for sources at is also limited by the lack of -band photometry and obtained values must be considered as a lower limit. Our study yields a photometric redshift error of when considering clusters with ( for ).
On average, we typically obtain about 20–40 spectroscopic members per cluster, and, consequently, a velocity dispersion can be estimated. We used this value of to investigate whether these clusters are poor or massive systems. There is a direct dependence between the redshift and mass of the Planck clusters, reported first in Planck Collaboration XXXII (2015) and studied in detail for high-z () clusters in van der Burg et al. (2016).
We expect that clusters at with will present km s-1, whereas clusters at with MM should show km s-1 (Munari et al. 2013). As in Barrena et al. (2018), we assume these values in the velocity dispersion to distinguish between actual and detectable systems by Planck and chance identifications not linked to the SZ effect.
3.3 Summary of our validation criteria
Using all available photometric and spectroscopic information, we adopted a set of flags according to the validation level of each target (see Table 2). For the sources with the spectroscopic information, we based our confirmation criteria only on the dynamical properties of the clusters (through their velocity dispersion). If no spectroscopic information available or only a few spectra is present, we validate the cluster using the value of for the richness significance above the background. We noticed that most of our spectroscopically confirmed clusters have larger than 1.5, so we adopt this value as a threshold in our study.
The distance from the Planck nominal pointing is also taken into account, however we consider this condition as a flexible restriction, especially in the case of double detections or sky regions contaminated by the galactic dust. The maximum offset expected for a Planck SZ detection is about 5 (i.e., roughly the angular resolution of the high-frequency HFI channels). In the case of finding a distance larger than and obvious cluster presence, we always inspect the distribution of the SZ flux in the Compton -map, and confirm/reject cluster according to the observed SZ contours. The largest distance from the Planck pointing, as confirmed by contours from the -map, was found to be 7.4 for a cluster at (see Section 4 and Fig. 7).
4 Results for the PSZ2 catalogue
4.1 Confirmed clusters
Table 3 summarizes our results for the 106 PSZ2 sources explored in the first year of our optical follow-up. We provide the identification number in the PSZ2 catalogue, the Planck name, S/N of the SZ detection, neural network quality flag QNEURAL, optical counterpart coordinates (assumed to be those of the BCG position or, in the absence of BCG, an approximate geometrical centre of the likely members), distance between the optical and SZ centres (in arcmin), redshift (photometric and, if available, spectroscopic), and number of spectroscopically confirmed galaxy members. We also provide the richness information for each cluster, quoting the richness value and the value of as described above. The last two columns provide our cluster classification, following the flagging scheme described in Section 4.3, and some comments relative to other possible identifications or noteworthy features.
Some of our clusters were pre-selected from Streblyanska et al. (2018) (mainly for MOS observations) and, thus, they have SDSS photometric information available. We also quote for these clusters the additional name from the catalogue of Wen et al. (2012), if available. In summary, we update the information for 14 clusters, being 13 of them members of the LP15 sample. The remaining one is PSZ2 G310.81+83.91, which was also identified in the PSZ1 catalogue, and thus it is not included in the LP15 sample.
At the moment of the publication, several articles reported confirmation of some clusters from our sample. For example, Boada et al. (2019) presented photometric redshifts for eight clusters. For all matched sources, except for three clusters, we have secure spectroscopic redshift measurements which are in perfect agreement with the reported photometric information. For PSZ2 G106.11+24.11, PSZ2 G107.83-45.45 and PSZ2 125.55+32.72 we have only photometric confirmation. Therefore, and for completeness, we presented in Table 3 our alternative photometric measurements.
Following the confirmation criteria given above, we find that 50 PSZ2 sources present clear over-densities around the nominal Planck position. However, after the inspection of obtained , we classified eight clusters as weak associations with the corresponding SZ source (i.e., Flag= 3). Thus, in total, we were able to confirm 41 new PSZ2 sources, 31 of them classified with Flag=1 (spectroscopic confirmation) and 10 with Flag=2 (photometric confirmation). In three cases, we found multiple optical counterparts along line of sight.
The detailed description of cluster counterparts with the spectroscopic confirmation and its corresponding physical properties, such as velocity dispersions and dynamical masses, will be discussed in detail in a future paper.
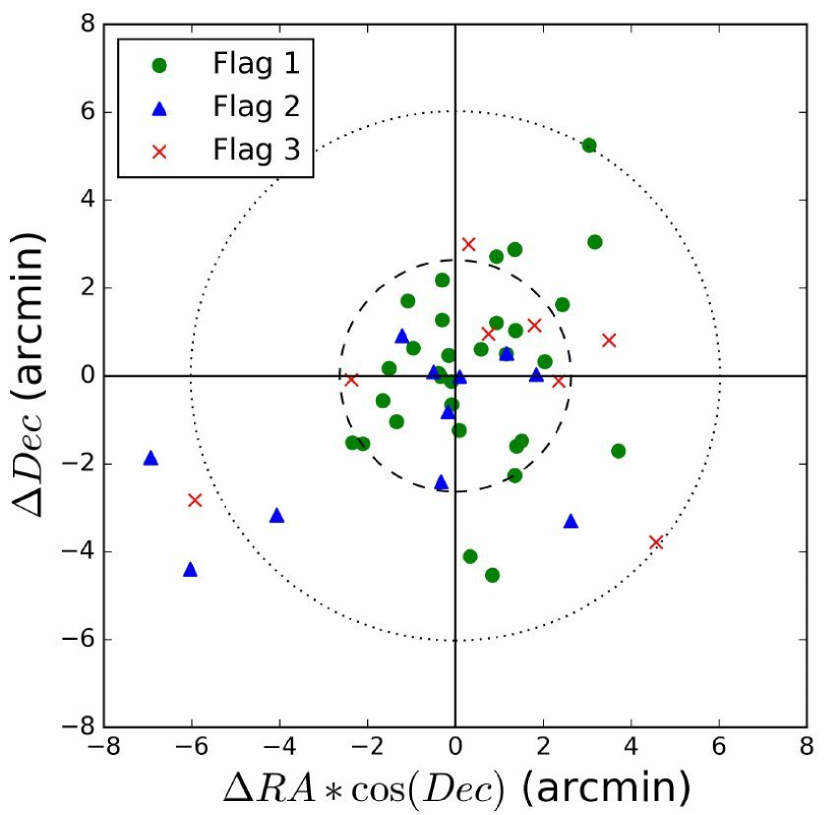
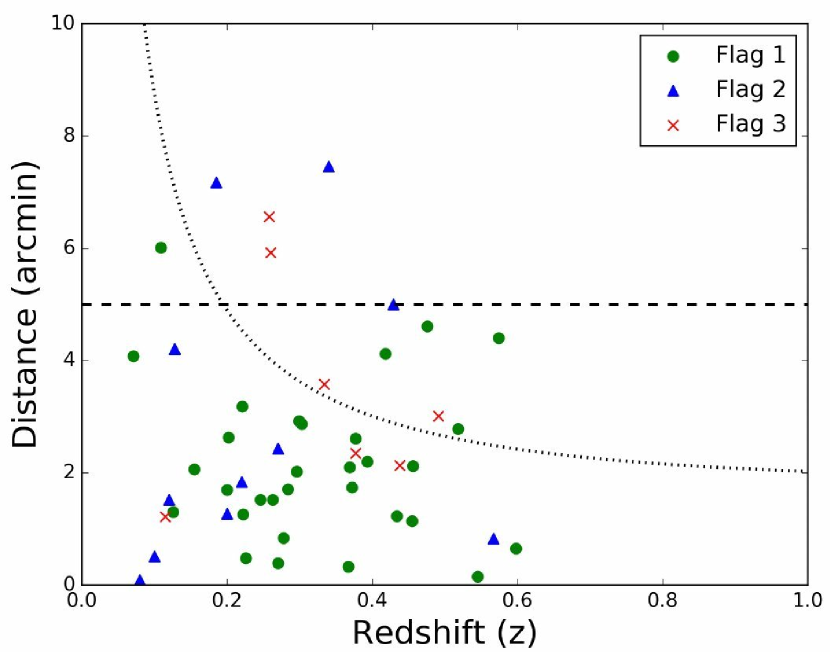
For 50 detected clusters (with Flag 1–3) we studied the dependence between the position of optical centre and the nominal Planck SZ coordinates. The position error predicted for SZ detections in the Planck SZ maps was about for targets in the PSZ1 sample and it was calculated that the cluster associated with the SZ effect should be closer than (e.g., the beam size of the SZ detection) from the SZ PSZ1 source coordinates. However, it was shown during the follow-up campaigns (e.g., Planck Collaboration XXXVI 2016; Barrena et al. 2018; Streblyanska et al. 2018) that even if this is true for most of the sources, some small percentage of true counterparts are located in the distances of –. In most of the cases it corresponds to nearby systems at with large apparent radius or fields affected by the optical structures, such as galactic cirri, which influence the Planck maps and, consequently, the final position of the detected SZ source. Fig. 5 (left panel) shows the final offset distribution of cluster optical centre relative to their Planck SZ position. As it was expected, 68 % of the 50 confirmed cluster sample are enclosed within 2.6, while for 95 % of the sources this corresponds to 6. We also studied dependence between this observed offset and redshift of the cluster (Fig. 5, right panel). As it was expected, most of the clusters are located not only inside the 5 region, but also inside the physical 1 Mpc region at the cluster redshift. In six cases (one of which corresponds to multiple optical counterpart detection) we observe the true counterparts at distances. The largest distance from the Planck pointing, confirmed by contours from the -map, was 7.4 (see discussion below).
In the following, we describe, as examples, a few clusters showing some particular features.
PSZ2 G023.87-13.88
is the only fossil999defined as galaxy systems with a magnitude difference of at least two magnitudes in the -band between the BCG and the second-brightest galaxy within half the virial radius cluster in our sample. It contains about 25 photometric members at .
PSZ2 G079.36+38.06
This cluster is one of the richest systems in our dataset. We detected more than 300 photometric members, distributed across the image and grouped in a few clumps (Fig. 6). We were able to obtain spectroscopy for 53 sources and confirm with a km s-1. An example of one of these spectra is presented in Fig. 2.
PSZ2 G084.69-58.60 and PSZ2 G118.79+47.50
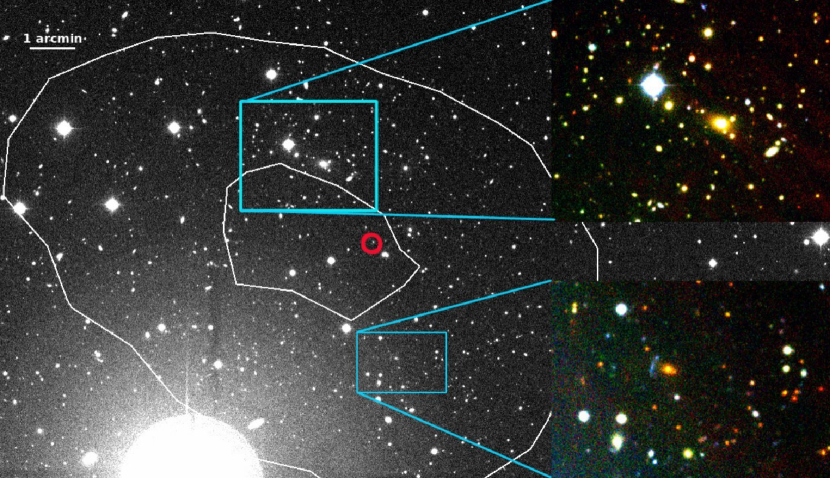
Even though these clusters are beyond the limit of the official 5 distance accepted for SZ sources (7.1 and 7.4, for PSZ2 G084.69-58.60 and PSZ2 G118.79+47.50, respectively) the MILCA contours confirm that these clusters are actual counterparts to the SZ signal (Fig. 7). In total, we have six cases where the clusters are located beyond 5 limit (5.4–7.4) and in all cases the contours from -maps support the validation. For some sources we even observed the shift between the peak of the SZ signal (-map) and the nominal Planck position, similar to Fig. 8 in Streblyanska et al. (2018).
PSZ2 G120.76+44.14
is an example of SZ sources with multiple optical counterparts. Both clusters are rich systems and located at a similar distance from the nominal Planck position ( 2) and confirmed by -map contours. One of these two clusters is a system at 0.296, while the second has 0.363 and presents a clear gravitational arc around the BCG (Fig. 8). Both clusters probably contribute to the SZ emission. In total, we find three cases like this, where multiple counterparts are associated with a single SZ source. We denote these sources with a special symbol in the Table 3.
4.2 Unconfirmed cluster candidates
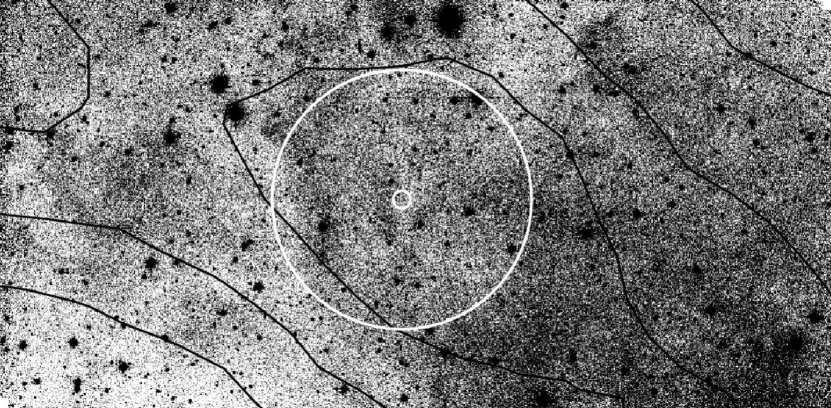
Out of the 106 sources studied in this paper. 57 remain unconfirmed. Most of those SZ targets are located close to the galactic plane and are associated with areas with strong dust contamination, thus, probably, producing false SZ detections in the Planck maps (see e.g. Fig. 9). Similar cases were already reported and intensively discussed in our previous follow-up works for PSZ1 targets (Section 4.3 in Barrena et al. 2018) and pre-selected PSZ2 sources (Section 4.3 in Streblyanska et al. 2018). In the presented field, as in the majority of other cases, we detect important galactic cirrus around the PSZ2 G100.07+17.06 in the optical images. Moreover, the distribution of the signal in the -map is not compact, and shows an elongated profile along the observed Galactic dust structures.
We emphasize here the importance of using optical and infrared observations to confirm the absence of a cluster counterpart in those regions of strong dust contamination and for sources detected with relative low S/N. For example, Khatri (2016) proposed a theoretical approach for the validation of the PSZ2 clusters based on the combination of CO and -maps only. They classified all sources in groups based on their determining whether a source is a cluster or a molecular cloud. However, only 61% of 1094 previously confirmed PSZ2 sources with secure information were classified as clusters () using this method. The rest of the confirmed clusters were classified either as indeterminable () or as molecular clouds (). Studying their classification for our subsample of 106 sources, we found that 55% of our confirmed clusters were classified as molecular clouds, and 14% of our unconfirmed sources classified as clusters. However, we note that all our high S/N sources without an optical counterpart are classified as by this approach.
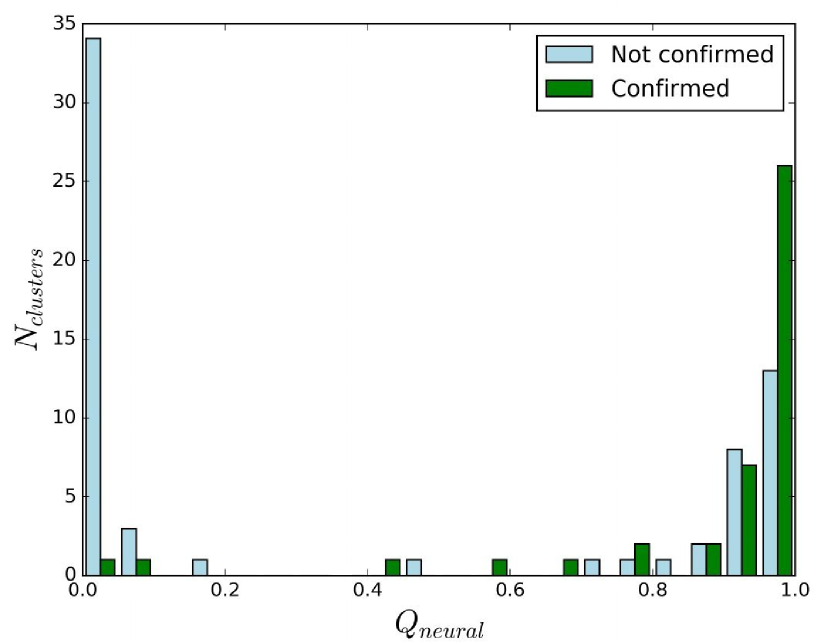
We note that for some sources, we cannot explain the absence of optical counterparts in terms of dust contamination. A relatively high number of non-detections in “clean” fields was found already in the PSZ1 sample, and it is re-confirmed in the PSZ2 set. Inspecting in detail all our unconfirmed sources, we found that most of them have neural network quality flag QNEURAL (Aghanim et al. 2015) close to 0. This flag was introduced already for the PSZ1 dataset, and the value of 0.4 was used to separate the high quality detections from the low-reliability ones. The original PSZ2 catalogue included 171 detections considered likely to be spurious by the neural network clasification, and from them only 19 were confirmed clusters with redshift information. Our subsample of 106 sources contains 37 objects with QNEURAL , and all of them, except PSZ2 G137.24+53.93 and PSZ2 G310.81+83.91, were classified as unconfirmed. This result demonstrates again that this flag effectively separates between real and spurious detections, and thus it should be considered as valuable information in the validation process. In Fig. 10 we plot a distribution of confirmed and unconfirmed sources versus QNEURAL values. Some of the not validated clusters with high values of QNEURAL are located at the areas with strong dust contamination being, most probably, result of spurious enhancements of the SZ signal.
Finally, we mention that some of these unconfirmed sources with the low value of QNEURAL flag at the same time present a high S/N of the SZ detection (values greater than 10), like PSZ2 G100.45+16.79, PSZ2 G153.56+36.82 and PSZ2 G107.41-09.57. This again demonstrates the importance to perform multi-wavelength follow-ups which include optical data, which allow us to correctly validate SZ sources and establish the actual completeness of Planck detection.
We will address a topic on the purity of complete Planck SZ sample and provide a detailed study on galactic dust contamination in a subsequent paper by Aguado-Barahona et al. (2019).
5 Conclusions
This paper opens a series of publications dedicated to the scientific exploitation of the results obtained with the LP15 programme, a large, systematic and uniform follow-up campaign of all the unconfirmed and new Planck PSZ2 sources in the northern hemisphere (i.e., having declinations Dec. and not being included in the PSZ1 catalogue). With this definition, our LP15 sample contains 190 objects (out of the 350 unconfirmed objects in the full sky with no correspondence with the PSZ1 catalogue).
In this first paper, we summarize the information and discuss the results from the first year of observations of LP15, where we carried out a detailed study of 106 targets. Each source has been carefully inspected, validated and classified with a Flag value, which was assigned according to our confirmation criteria. We used the available spectroscopic and photometric redshifts, the flux density profiles from the Planck Compton -map, dynamical properties of the clusters and the optical richness. In particular, in this study we present a refined procedure for the computation of the richness parameter, taking into account the local background variance, and making it more robust in comparison with other validation works.
Using our approach, out of the 106 objects, we have been able to confirm 41 new Planck PSZ2 sources. Among them, 31 were validated using velocity dispersion calculated from our spectroscopic redshifts. We also presented updated redshift information for one cluster, PSZ2 G310.81+83.91, which is not included in the LP15 sample. Thus, in total we presented information for 107 sources of the PSZ2 catalogue. In three cases, confirmed spectroscopically, we detected the presence of multiple counterparts along the line of sight. The remaining 65 sources were classified as non-confirmed, either due to the absence of observed over-densities (57), or due to a weak association with the SZ signal and dissatisfaction with our validation requirements (8 objects with Flag=3). We looked for the possible explanations for this apparent absence of optical counterparts. We found, that most of the unconfirmed sources are associated with areas of strong dust contamination with consequently possible spurious enhancements of the SZ signal. Also, most of our unconfirmed sources show low values of neural network quality flag QNEURAL. We confirm that this flag effectively separates between real and spurious SZ detections, and it should be considered as a valuable tool during the validation process.
The work presented here contributes to a series of efforts to validate completely all Planck SZ sources, and ultimately will allow us to determine the purity and efficiency of cluster detections in the Planck SZ catalogues.
| ID | Planck name | S/N | QNEURAL | R. A. | Decl. | distance | Nspec | R | flag | Comments | ||||
|---|---|---|---|---|---|---|---|---|---|---|---|---|---|---|
| 34d | PSZ2 G009.04+31.09 | 5.04 | 0.98 | 16:18:26.70 | -04:11:11.06 | 1.52 | 0.25b | 0.246 | -1 | 34 | 31a | - | 1 | WHL J161826.7-041111 |
| 78 | PSZ2 G023.87-13.88 | 4.90 | 0.95 | 19:25:40.06 | -14:11:25.04 | 1.52 | 0.12 | 0.0 | 0.0 | 0 | 30.0 | 2.64 | 2 | fossil |
| 88 | PSZ2 G027.23+15.73 | 4.89 | 0.01 | - | - | - | - | - | - | 0 | 0.0 | 0.0 | ND | |
| 90 | PSZ2 G027.39+15.39 | 5.22 | 0.74 | - | - | - | - | - | - | 0 | 0.0 | 0.0 | ND | |
| 91 | PSZ2 G027.77+10.88 | 6.41 | 0.01 | - | - | - | - | - | - | 0 | 0.0 | 0.0 | ND | |
| 106 | PSZ2 G029.87-17.81 | 4.91 | 0.08 | - | - | - | - | - | - | 0 | 0.0 | 0.0 | ND | |
| 116 | PSZ2 G032.77+19.69 | 4.78 | 0.99 | 17:40:23.30 | +08:41:12.12 | 2.10 | 0.39 | 0.369 | 0.368 | 61 | 24.6 | 3.28 | 1 | |
| 126e | PSZ2 G036.36+16.01 | 4.58 | 0.93 | 17:59:45.60 | +10:08:29.15 | 4.21 | 0.13 | 0.128 | -1 | 3 | 13g | - | 2 | |
| 127 | PSZ2 G036.69-15.67 | 5.69 | 0.79 | - | - | - | - | - | - | 0 | 0.0 | 0.0 | ND | |
| 129 | PSZ2 G036.77-16.51 | 4.62 | 0.03 | - | - | - | - | - | - | 0 | 0.0 | 0.0 | ND | |
| 130 | PSZ2 G036.80-14.95 | 4.72 | 0.07 | - | - | - | - | - | - | 0 | 0.0 | 0.0 | ND | |
| 133 | PSZ2 G037.31-21.54 | 4.96 | 0.77 | 20:15:55.00 | -05:55:59.25 | 4.40 | 0.46 | 0.574 | -1 | 31 | 14.3 | 3.01 | 1 | |
| 143 | PSZ2 G039.86+18.70 | 4.55 | 0.99 | - | - | - | - | - | - | 0 | 0.0 | 0.0 | ND | |
| 146-Ac | PSZ2 G040.11-42.58 | 5.08 | 0.99 | 21:36:59.42 | -13:08:02.70 | 2.63 | 0.17 | 0.202 | 0.201 | 54 | 45.7 | 7.8 | 1 | |
| 146-Bc | 21:37:17.15 | -13:01:10.77 | 5.47 | 0.57 | 0.62 | 0.62 | 15 | 4.9 | 1.71 | 1 | ||||
| 155 | PSZ2 G042.54+18.02 | 4.78 | 0.99 | 18:02:59.10 | +16:21:15.37 | 6.56 | 0.22 | 0.258 | -1 | 8 | 40.2 | 3.28 | 3 | |
| 158 | PSZ2 G043.44-41.27 | 5.55 | 0.97 | 21:36:43.74 | -10:19:01.69 | 1.23 | 0.37 | 0.434 | -1 | 33 | 52.9 | 11.5 | 1 | |
| 161d | PSZ2 G044.21+52.13 | 4.64 | 0.96 | 15:42:50.44 | +27:49:52.90 | 2.35 | 0.38 | 0.377 | -1 | 6 | 2.9 | 0.75 | 3 | WHL J154250.4+274953 |
| 169 | PSZ2 G045.20+15.63 | 4.65 | 0.91 | 18:16:04.76 | +17:47:00.12 | 1.30 | 0.13 | 0.126 | 0.128 | 22 | 16.2 | 1.67 | 1 | |
| 171 | PSZ2 G045.47+17.80 | 4.66 | 0.98 | 18:08:14.70 | +18:51:54.00 | 1.74 | 0.36 | 0.372 | 0.372 | 34 | 8.7 | 2.47 | 1 | |
| 176d | PSZ2 G045.96-26.94 | 5.1 | 0.96 | 20:50:01.00 | -01:35:23.85 | 1.84 | 0.22 | 0.0 | 0.0 | 0 | 9.5 | 1.51 | 2 | |
| 181 | PSZ2 G046.39+11.71 | 4.62 | 0.96 | - | - | - | - | - | - | 0 | 0.0 | 0.0 | ND | |
| 193 | PSZ2 G048.39-16.78 | 4.57 | 0.99 | - | - | - | - | - | - | 0 | 0.0 | 0.0 | ND | |
| 208 | PSZ2 G051.48-30.87 | 4.99 | 0.97 | - | - | - | - | - | - | 0 | 0.0 | 0.0 | ND | |
| 209 | PSZ2 G052.08+46.13 | 4.75 | 0.94 | - | - | - | - | - | - | 0 | 0.0 | 0.0 | ND | |
| 217 | PSZ2 G053.80+36.49 | 5.16 | 0.97 | - | - | - | - | - | - | 0 | 0.0 | 0.0 | ND | |
| 233 | PSZ2 G057.09+11.19 | 4.96 | 0.99 | 18:54:14.08 | +26:27:26.46 | 2.61 | 0.35 | 0.377 | -1 | 20 | 14.3 | 1.49 | 1 | |
| 248 | PSZ2 G059.52+16.23 | 4.77 | 0.67 | 18:37:15.08 | +30:40:53.17 | 1.71 | 0.24 | 0.284 | -1 | 17 | 100.8 | 31.64 | 1 | |
| 250 | PSZ2 G059.76+14.59 | 4.88 | 0.99 | 18:44:42.47 | +30:17:31.54 | 2.87 | 0.28 | 0.303 | -1 | 9 | -1 | -1 | 1 | |
| 266 | PSZ2 G064.98+16.71 | 4.57 | 0.58 | 18:44:30.25 | +35:42:19.52 | 1.26 | 0.16 | 0.222 | -1 | 5 | 23.3 | 3.3 | 1 | |
| 269 | PSZ2 G065.35-08.01 | 5.82 | 0.00 | - | - | - | - | - | - | 0 | 0.0 | 0.0 | ND | |
| 279d | PSZ2 G066.59-58.51 | 5.01 | 0.91 | 23:07:11.30 | -07:31:43.15 | 3.58 | 0.36 | 0.334 | 0.334 | 16 | 2.1 | 0.61 | 3 | WHL J230711.3-073143 |
| 281 | PSZ2 G066.76-08.42 | 4.81 | 0.92 | - | - | - | - | - | - | 0 | 0.0 | 0.0 | ND | |
| 284d | PSZ2 G067.21-20.49 | 4.51 | 0.75 | 21:13:28.89 | +18:03:27.28 | 0.33 | 0.32 | 0.367 | 0.366 | 14 | -1 | -1 | 1 | WHL J211328.9+180327 |
| 287 | PSZ2 G067.72-24.13 | 4.68 | 0.91 | 21:26:33.70 | +16:04:47.30 | 2.37 | 0.10 | 0.0 | 0.0 | 0 | -1 | -1 | 3 | |
| 295-Ac,d | PSZ2 G069.47-29.06 | 5.14 | 0.97 | 21:46:02.11 | +14:01:26.25 | 2.2 | 0.36 | 0.393 | 0.393 | 44 | 9.2 | 1.92 | 1 | |
| 295-Bc,d | 21:45:51.9 | +14:03:23.00 | 4.66 | 0.21 | 0.19 | -1 | 30 | 8.7 | 1.58 | 1 | ||||
| 310 | PSZ2 G072.96-12.26 | 4.58 | 0.84 | - | - | - | - | - | - | 0 | 0.0 | 0.0 | ND | |
| 319 | PSZ2 G075.08+19.83 | 5.73 | 0.91 | 18:46:41.11 | +45:47:04.30 | 1.27 | 0.2 | 0.0 | 0.0 | 0 | 18g | -1 | 2 | |
| 326 | PSZ2 G076.51+21.73 | 4.68 | 0.99 | 18:38:35.82 | +47:33:35.78 | 4.12 | 0.37 | 0.418 | 0.42 | 47 | 50.4 | 8.98 | 1 | |
| 328 | PSZ2 G076.81-32.57 | 4.68 | 0.92 | - | - | - | - | - | - | 0 | 0.0 | 0.0 | ND |
| ID | Planck name | S/N | QNEURAL | R. A. | Decl. | distance | Nspec | R | flag | Comments | ||||
|---|---|---|---|---|---|---|---|---|---|---|---|---|---|---|
| 330d | PSZ2 G077.67+30.59 | 5.03 | 0.99 | 17:46:50.85 | +50:31:12.28 | 3.18 | 0.22 | 0.221 | 0.219 | 10 | 6.6 | 1.43 | 1 | WHL J174650.9+503112 |
| 337 | PSZ2 G079.36+38.06 | 4.94 | 0.99 | 16:59:09.10 | +52:06:09.80 | 2.92 | 0.26 | 0.299 | -1 | 53 | 31.8 | 11.45 | 1 | |
| 351 | PSZ2 G081.60+18.47 | 5.57 | 0.99 | 19:07:17.98 | +51:05:14.46 | 2.78 | 0.44 | 0.518 | 0.519 | 21 | 11.4 | 2.57 | 1 | |
| 353 | PSZ2 G082.06+27.23 | 5.32 | 0.99 | - | - | - | - | - | - | 0 | 0.0 | 0.0 | ND | |
| 364 | PSZ2 G084.15-08.63 | 4.82 | 0.00 | - | - | - | - | - | - | 0 | 0.0 | 0.0 | ND | |
| 371d | PSZ2 G084.69-58.60 | 4.73 | 0.99 | 23:36:37.50 | -01:27:52.30 | 7.17 | 0.2 | 0.185 | -1 | 2 | 21.6 | 5.04 | 2 | WHL J233637.5-012752 |
| 380 | PSZ2 G086.07-41.99 | 4.78 | 0.99 | - | - | - | - | - | - | 0 | 0.0 | 0.0 | ND | |
| 382 | PSZ2 G086.35-13.94 | 5.42 | 0.41 | 21:49:41.40 | +35:43:13.89 | 0.84 | 0.26 | 0.278 | 0.277 | 11 | 33.0 | 5.93 | 1 | |
| 400 | PSZ2 G089.06-11.79 | 5.71 | 0.85 | 21:52:58.09 | +39:04:30.53 | 1.14 | 0.38 | 0.455 | 0.455 | 32 | 12.3 | 1.79 | 1 | |
| 407 | PSZ2 G090.12-13.87 | 4.86 | 0.99 | 22:03:21.46 | +38:03:39.42 | 4.08 | 0.1 | 0.071 | 0.074 | 15 | 26.9 | 2.66 | 1 | |
| 412 | PSZ2 G091.56+08.50 | 4.77 | 0.99 | 20:36:18.61 | +54:59:04.90 | 0.39 | 0.26 | 0.27 | 0.27 | 11 | 86.7 | 20.82 | 1 | |
| 415 | PSZ2 G092.11-33.73 | 5.81 | 0.03 | - | - | - | - | - | - | 0 | 0.0 | 0.0 | ND | |
| 420 | PSZ2 G092.64+20.78 | 5.12 | 0.92 | 19:16:45.42 | +61:40:41.47 | 0.15 | 0.38 | 0.545 | 0.549 | 39 | -1 | -1 | 1 | |
| 426 | PSZ2 G093.71-30.90 | 5.0 | 0.00 | - | - | - | - | - | - | 0 | 0.0 | 0.0 | ND | |
| 429 | PSZ2 G093.94+13.75 | 4.88 | 0.00 | - | - | - | - | - | - | 0 | 0.0 | 0.0 | ND | |
| 444 | PSZ2 G095.75-11.16 | 5.32 | 0.00 | - | - | - | - | - | - | 0 | 0.0 | 0.0 | ND | |
| 445 | PSZ2 G096.10+12.46 | 5.08 | 0.05 | - | - | - | - | - | - | 0 | 0.0 | 0.0 | ND | |
| 447 | PSZ2 G096.43-20.89 | 5.8 | 0.99 | 22:48:09.42 | +35:33:49.49 | 0.48 | 0.2 | 0.226 | -1 | 34 | 33.3 | 4.31 | 1 | |
| 454 | PSZ2 G097.37-17.11 | 4.73 | 0.96 | 22:42:35.75 | +39:15:19.56 | 2.12 | 0.4 | 0.456 | 0.456 | 32 | 37.8 | 7.85 | 1 | |
| 463 | PSZ2 G098.39+57.68 | 5.07 | 0.86 | - | - | - | - | - | - | 0 | 0.0 | 0.0 | ND | |
| 465 | PSZ2 G098.62+51.76 | 4.53 | 0.92 | - | - | - | - | - | - | 0 | 0.0 | 0.0 | ND | |
| 480 | PSZ2 G100.07+17.06 | 5.01 | 0.00 | - | - | - | - | - | - | 0 | 0.0 | 0.0 | ND | |
| 483d | PSZ2 G100.22+33.81 | 5.68 | 0.99 | 17:13:41.57 | +69:21:45.24 | 0.65 | 0.61 | 0.598 | -1 | 18 | 3.3 | 1.27 | 1 | |
| 484 | PSZ2 G100.38+16.73 | 5.08 | 0.01 | - | - | - | - | - | - | 0 | 0.0 | 0.0 | ND | |
| 485 | PSZ2 G100.45+16.79 | 11.78 | 0.02 | - | - | - | - | - | - | 0 | 0.0 | 0.0 | ND | |
| 497 | PSZ2 G104.15-38.85 | 6.41 | 0.00 | - | - | - | - | - | - | 0 | 0.0 | 0.0 | ND | |
| 501 | PSZ2 G104.58-15.41 | 4.62 | 0.00 | - | - | - | - | - | - | 0 | 0.0 | 0.0 | ND | |
| 505 | PSZ2 G105.00+39.68 | 4.97 | 0.91 | 15:52:52.42 | +70:30:57.64 | 1.70 | 0.2 | 0.2 | 0.201 | 30 | 31.7 | 6.18 | 1 | |
| 512 | PSZ2 G106.11+24.11 | 5.7 | 0.99 | 19:21:31.86 | +74:33:27.43 | 0.51 | 0.1 | 0.0 | 0.0 | 0 | -1 | -1 | 2 | =0.15 (Boada et al. 2019) |
| 514 | PSZ2 G106.21+26.32 | 4.9 | 0.99 | 18:48:31.20 | +75:03:29.99 | 0.09 | 0.08 | 0.0 | 0.0 | 0 | -1 | -1 | 2 | 1RXS J184828+750326 |
| 522 | PSZ2 G107.41-09.57 | 10.68 | 0.01 | - | - | - | - | - | - | 0 | 0.0 | 0.0 | ND | |
| 525 | PSZ2 G107.83-45.45 | 7.09 | 0.86 | 00:07:35.62 | +16:07:01.87 | 0.83 | 0.55 | 0.567 | 0.567 | 2 | 6.8 | 2.7 | 2 | =0.55 (Boada et al. 2019) |
| 538 | PSZ2 G110.69-46.25 | 5.04 | 0.92 | - | - | - | - | - | - | 0 | 0.0 | 0.0 | ND | |
| 542 | PSZ2 G112.07-39.86 | 5.72 | 0.01 | - | - | - | - | - | - | 0 | 0.0 | 0.0 | ND | |
| 568 | PSZ2 G116.05+20.00 | 5.16 | 0.99 | - | - | - | - | - | - | 0 | 0.0 | 0.0 | ND | |
| 574 | PSZ2 G117.11+11.48 | 5.13 | 0.03 | 23:28:53.00 | +73:22:13.00 | 5.92 | 0.35 | 0.26 | -1 | 18 | -1 | -1 | 3 | |
| 575 | PSZ2 G117.38-52.47 | 5.45 | 0.49 | - | - | - | - | - | - | 0 | 0.0 | 0.0 | ND | |
| 584 | PSZ2 G118.79+47.50 | 5.18 | 0.97 | 13:24:21.08 | +69:17:24.72 | 7.46 | 0.34 | 0.0 | 0.0 | 0 | 43.5 | 11.05 | 2 | |
| 591 | PSZ2 G120.36+26.03 | 5.29 | 0.00 | - | - | - | - | - | - | 0 | 0.0 | 0.0 | ND | |
| 593-Ac | PSZ2 G120.76+44.14 | 5.58 | 0.99 | 13:12:53.57 | +72:55:06.22 | 2.02 | 0.28 | 0.296 | 0.295 | 41 | 17.0 | 5.68 | 1 | Abell 1705 |
| 593-Bc | 13:12:31.07 | +72:50:54.41 | 2.54 | 0.36 | 0.363 | -1 | 12 | -1 | -1 | 1 | gravitational arc | |||
| 597 | PSZ2 G121.87-45.97 | 4.85 | 0.01 | - | - | - | - | - | - | 0 | 0.0 | 0.0 | ND | |
| 609 | PSZ2 G124.11+25.02 | 5.52 | 0.00 | - | - | - | - | - | - | 0 | 0.0 | 0.0 | ND | |
| 612 | PSZ2 G125.11+28.14 | 4.98 | 0.00 | - | - | - | - | - | - | 0 | 0.0 | 0.0 | ND | |
| 617 | PSZ2 G125.55+32.72 | 6.48 | 1.00 | 11:25:46.87 | +83:55:04.58 | 2.43 | 0.27 | 0.0 | 0.0 | 0 | 6.5 | 2.12 | 2 | =0.20 (Boada et al. 2019) |
| 636 | PSZ2 G128.15-24.71 | 4.74 | 0.94 | 01:15:25.70 | +37:56:01.00 | 1.52 | 0.2 | 0.263 | -1 | 19 | 36.7 | 9.37 | 1 |
| ID | Planck name | S/N | QNEURAL | R. A. | Decl. | distance | Nspec | R | flag | Comments | ||||
|---|---|---|---|---|---|---|---|---|---|---|---|---|---|---|
| 655 | PSZ2 G134.26-44.28 | 5.08 | 0.01 | - | - | - | - | - | - | 0 | 0.0 | 0.0 | ND | |
| 666 | PSZ2 G135.94-68.22 | 6.86 | 0.00 | - | - | - | - | - | - | 0 | 0.0 | 0.0 | ND | |
| 668 | PSZ2 G136.31+54.67 | 6.91 | 0.16 | - | - | - | - | - | - | 0 | 0.0 | 0.0 | ND | |
| 673e | PSZ2 G137.24+53.93 | 7.87 | 0.08 | 11:40:59.55 | +61:07:07.04 | 4.61 | 0.48 | 0.476 | 0.477 | 19 | 2.3 | 2.74 | 1 | WHL J114059.5+610707 |
| 684 | PSZ2 G139.72-17.13 | 5.11 | 0.98 | 02:19:44.22 | +42:50:13.26 | 2.06 | 0.12 | 0.155 | 0.156 | 18 | 9.1 | 1.2 | 1 | |
| 705 | PSZ2 G144.84-35.16 | 4.83 | 0.98 | - | - | - | - | - | - | 0 | 0.0 | 0.0 | ND | |
| 714e | PSZ2 G146.16-48.92 | 5.1 | 0.00 | 01:52:41.75 | +11:13:01.36 | 3.01 | 0.49 | 0.491 | 0.491 | 20 | 0.3 | 0.13 | 3 | |
| 723 | PSZ2 G148.60-48.61 | 4.71 | 0.01 | - | - | - | - | - | - | 0 | 0.0 | 0.0 | ND | |
| 744 | PSZ2 G153.56+36.82 | 15.89 | 0.00 | - | - | - | - | - | - | 0 | 0.0 | 0.0 | ND | |
| 763 | PSZ2 G158.45-42.92 | 4.8 | 0.98 | - | - | - | - | - | - | 0 | 0.0 | 0.0 | ND | |
| 771 | PSZ2 G161.73-28.58 | 4.8 | 0.01 | 03:18:09.80 | +23:01:53.40 | 2.13 | 0.33 | 0.438 | 0.442 | 12 | 9.0 | 2.6 | 3 | |
| 776 | PSZ2 G163.22-26.48 | 6.34 | 0.02 | - | - | - | - | - | - | 0 | 0.0 | 0.0 | ND | |
| 785 | PSZ2 G164.85-16.55 | 5.01 | 0.01 | - | - | - | - | - | - | 0 | 0.0 | 0.0 | ND | |
| 795 | PSZ2 G166.27-25.02 | 8.08 | 0.01 | - | - | - | - | - | - | 0 | 0.0 | 0.0 | ND | |
| 796 | PSZ2 G166.27-24.71 | 9.57 | 0.02 | - | - | - | - | - | - | 0 | 0.0 | 0.0 | ND | |
| 801 | PSZ2 G167.63-43.99 | 4.87 | 0.07 | - | - | - | - | - | - | 0 | 0.0 | 0.0 | ND | |
| 813 | PSZ2 G171.79-42.08 | 5.84 | 0.00 | - | - | - | - | - | - | 0 | 0.0 | 0.0 | ND | |
| 827 | PSZ2 G176.07-26.95 | 4.9 | 0.99 | - | - | - | - | - | - | 0 | 0.0 | 0.0 | ND | |
| 845 | PSZ2 G181.88-30.77 | 9.29 | 0.02 | - | - | - | - | - | - | 0 | 0.0 | 0.0 | ND | |
| 1244d | PSZ2 G269.02+46.30 | 4.67 | 0.90 | 11:19:07.43 | -10:22:57.81 | 1.22 | 0.12b | 0.115 | 0.114 | 9 | -1 | -1 | 3 | |
| 1465d,f | PSZ2 G310.81+83.91 | 8.28 | 0.01 | 12:55:18.02 | +21:02:31.22 | 5.0 | 0.46 | 0.429 | -1 | 2 | 5.7 | 1.7 | 2 | |
| 1621 | PSZ2 G347.96+80.46 | 4.73 | 0.93 | - | - | - | - | - | - | 0 | 0.0 | 0.0 | ND | |
| 1626 | PSZ2 G349.18+38.66 | 5.15 | 0.99 | 15:11:40.98 | -11:11:27.36 | 6.01 | 0.1 | 0.109 | 0.108 | 26 | -1 | -1 | 1 |
a Richness calculated using SDSS DR12 data data (no LP15 photometric data available)
b Photometric redshift obtained from SDSS DR12 data Streblyanska et al. (2018)
c SZ targets identified with the ID followed by an A or B label indicate the presence of multiple counterparts
d Confirmed in Streblyanska et al. (2018). New LP15 photometric/spectroscopic data are available
e Clasified as ”potentially associated” in Streblyanska et al. (2018)
f An extra source from Streblyanska et al. (2018) with new spectroscopic information. Not included in LP15 sample
g Richness calculated without local background subtraction due to the small FOV or poor observing conditions
Acknowledgements.
This article is based on observations made with a) the Gran Telescopio Canarias operated by the Instituto de Astrofísica de Canarias, b) the Isaac Newton Telescope, and the William Herschel Telescope operated by the Isaac Newton Group of Telescopes, and c) the Italian Telescopio Nazionale Galileo operated by the Fundación Galileo Galilei of the INAF (Istituto Nazionale di Astrofisica). All these facilities are located at the Spanish Roque de los Muchachos Observatory of the Instituto de Astrofísica de Canarias on the island of La Palma. This research has been carried out with telescope time awarded for the programme 128-MULTIPLE-16/15B. Also, during our analysis, we used the following databases: the SZ-Cluster Database operated by the Integrated Data and Operation Center (IDOC) at the IAS under contract with CNES and CNRS and the Sloan Digital Sky Survey (SDSS) DR14 database. Funding for the SDSS has been provided by the Alfred P. Sloan Foundation, the Participating Institutions, the National Aeronautics and Space Administration, the National Science Foundation, the U.S. Department of Energy, the Japanese Monbukagakusho, and the Max Planck Society. This work has been partially funded by the Spanish Ministry of Economy and Competitiveness (MINECO) under the projects ESP2013-48362-C2-1-P, AYA2014-60438-P and AYA2017-84185-P. AS and RB acknowledge financial support from the Spanish Ministry of Economy and Competitiveness (MINECO) under 2011 Severo Ochoa Programme MINECO SEV-2011-0187. HL is funded by PUT1627 and IUT26-2 grants from the Estonian Research Council and by the European Structural Funds grant for the Centre of Excellence ”Dark Matter in (Astro)particle Physics and Cosmology” TK133. Some of the results in this paper have been derived using the HEALPix Górski et al. (2005) package.References
- Aihara et al. (2011) Aihara, H., Allende Prieto, C., An, D., et al. 2011, ApJS, 193, 29
- Aghanim et al. (2015) Aghanim, N., Hurier, G., Diego, J.-M., et al. 2015, A&A, 580, A138
- Aguado-Barahona et al. (2019) Aguado-Barahona, A., Barrena, R., Streblyanska, A., et al. 2019, in preparation
- Barrena et al. (2012) Barrena, R., Girardi, M., Boschin, W., & Mardirossian, F. 2012, A&A, 540, A90
- Barrena et al. (2018) Barrena, R., Streblyanska, A., Ferragamo, A., et al. 2018, A&A, 616, 42
- Barrena et al. (2019) Barrena, R., et al. 2019, in preparation
- Bertin & Arnouts (1996) Bertin, E. & Arnouts, S. 1996, A&AS, 117, 393
- Blanton et al. (2003) Blanton, M., et al. 2003, ApJ, 592, 819B
- Blanton & Roweis (2007) Blanton, M., & Roweis, S., 2007, AJ, 133, 734B
- Boada et al. (2019) Boada, S. et al. 2019, ApJ, 871, 188
- Boschin et al. (2008) Boschin, W., Barrena, R., Girardi, M., & Spolaor, M. 2008, A&A, 487, 33
- Buddendiek et al. (2015) Buddendiek, A., Schrabback, T., Greer, C. H., et al. 2015, MNRAS, 450, 4248
- Burenin et al. (2018) Burenin R. A., et al., 2018, Astronomy Letters, 44, 297
- Eddington (1913) Eddington, A. S. 1913, MNRAS, 73, 359
- Ferragamo et al. (2019) Ferragamo, A., et al. 2019, in preparation
- Gladders & Yee (2000) Gladders, M. D., & Yee, H. K. C. 2000, AJ, 120, 2148
- Górski et al. (2005) Górski K. M., Hivon E., Banday A. J., Wandelt B. D., Hansen F. K., Reinecke M., Bartelmann M., 2005, ApJ, 622, 759
- Hao et al. (2010) Hao, J., McKay, T. A., Koester, B. P., et al. 2010, ApJS, 191, 254
- Kennicutt (1992) Kennicutt, Jr., R. C. 1992, ApJS, 79, 255
- Khatri (2016) Khatri, R. 2016, A&A, 592, A48
- Liu et al. (2015) Liu, J., Hennig, C., Desai, S., et al. 2015, MNRAS, 449, 3370
- Menanteau & Hugues (2009) Menanteau, F., & Hugue, J. P. 2009, ApJ, 694, 136
- Monet et al. (2003) Monet, D. G., Levine, S. E., Canzian, B., et al. 2003, AJ, 125, 984
- Munari et al. (2013) Munari, E., Biviano, A., Borgani, S., Murante, G., & Fabjan, D. 2013, MNRAS, 430, 2638
- Piffaretti et al. (2011) Piffaretti, R. et al. 2011, A&A, 534, A109
- Planck Collaboration VIII (2011) Planck Collaboration VIII. 2011, A&A, 536, A8
- Planck Collaboration Int. IV (2013) Planck Collaboration Int. IV. 2013, A&A, 550, A130
- Planck Collaboration Int. VIII (2013) Planck Collaboration Int. VIII. 2013, A&A, 550, A134
- Planck Collaboration XX (2014) Planck Collaboration XX. 2014, A&A, 571, A20
- Planck Collaboration XXI (2014) Planck Collaboration XXI. 2014, A&A, 571, A21
- Planck Collaboration XIII (2016) Planck 2015 results. XIII. 2016, A&A, 594, A13.
- Planck Collaboration XXII (2015) Planck 2015 results. XXII. 2016, A&A, 594, A22
- Planck Collaboration XXIV (2015) Planck 2015 results. XXIV. 2016, A&A, 594, A24
- Planck Collaboration Int. XXVI (2015) Planck Collaboration Int. XXVI. 2015, A&A, 582, A29
- Planck Collaboration XXVII (2016) Planck Collaboration XXVII. 2016, A&A, 594, A27
- Planck Collaboration XXIX (2014) Planck Collaboration XXIX. 2014, A&A, 571, A29
- Planck Collaboration XXXII (2015) Planck Collaboration XXXII. 2015, A&A, 581, A14
- Planck Collaboration XXXVI (2016) Planck Collaboration XXXVI. 2016, A&A, 586, A139
- Planck Collaboration Int. XLVIII (2016) Planck Collaboration Int. XLVIII . 2016, A&A, 596, A109
- Planck Collaboration VI (2018) Planck 2018 results. VI. 2018, A&Asubmitted (arXiv:1807.06209)
- Streblyanska et al. (2018) Streblyanska, A., Barrena, R., Rubiño-Martín, J. A., et al. 2018, A&A, 617, 71
- Sunyaev & Zeldovich (1972) Sunyaev, R. A. & Zeldovich, Y. B. 1972, Comments on Astrophysics and Space Physics, 4, 173
- Tempel et al. (2014) Tempel, E., Tamm, A., Gramann, M., et al. 2014, A&A, 566, A1
- Tonry & Davis (1979) Tonry, J. & Davis, M. 1979, AJ, 84, 1511
- van der Burg et al. (2016) van der Burg, R. F. J., Aussel, H., Pratt, G. W., et al. 2016, A&A, 587, A23
- Vikhlinin et al. (2009) Vikhlinin, A., Kravtsov, A. V., Burenin, R. A., et al. 2009, ApJ, 692, 1060
- Wen et al. (2012) Wen, Z. L., Han, J. L., & Liu, F. S. 2012, ApJS, 199, 34