Exploring the shell model of high-velocity features of Type Ia supernovae using tardis
Abstract
We explore the possible nature of high-velocity features in Type Ia supernovae by presenting synthetic spectra generated from hydrodynamic models of interaction between the supernova and a compact circumstellar shell. We use tardis to compute the spectra and compare model spectra to data from SN 2011fe at 2, 5, and 9 days after the explosion. We apply abundance models to the shells that consist of either a hydrogen, helium, or carbon-oxygen substrate with overall solar abundance of metals and depletion or enhancement of calcium abundance. We vary the calcium abundances in the shell and the ejecta to study the effect on the photospheric and high-velocity components of the calcium near-infrared triplet. The substrate leaves no imprint upon the spectra, but helium substrates are discouraged by demanding excessive calcium abundances. We find that we can approximately reproduce the blended high-velocity and photospheric velocity features at 2 and 5 days. The 9 day spectrum shows a distinct high-velocity component of the line. We are unable to reproduce this specific feature with the current models. We also explore helium-shell double detonation models, finding they tend to give no high-velocity features or excessively strong features. A very carefully chosen helium-shell mass might give a reasonable reproduction of the observed calcium features. We discuss the implications of our models for the nature of high-velocity features and their significance to the evolution and explosion of SN Ia.
keywords:
supernovae: general – supernovae: individual: SN2011fe – stars:abundances – line: formation – line: profiles1 Introduction
Typical Type Ia supernovae (SN Ia) show high-velocity features (HVF) prior to maximum light that are separated from the photospheric-velocity features (PVF) by 7,000 (Hatano et al., 1999; Wang et al., 2003; Thomas et al., 2004; Mazzali et al., 2005; Quimby et al., 2006; Parrent et al., 2012; Marion et al., 2013; Childress et al., 2013; Childress et al., 2014; Maguire et al., 2014; Silverman et al., 2015; Zhao et al., 2015, 2016). Both the HVF and the PVF slow with time, but maintain this separation. The HVF are especially prominent in the near-infrared triplet of Ca ii (CaNIR), but are also observed in Si ii and other strong lines. The HVF exhibit a polarization of 0.1 – 1 per cent (Wang et al., 2003; Wang & Wheeler, 2008; Patat et al., 2009), requiring that the material that gives rise to the HVF be clumped or otherwise asymmetric.
Despite the near ubiquity of the HVF and their potential to reveal important information about the progenitor evolution or combustion physics, there is no accepted physical model. Proposed models fall into three broad categories: 1) material that is part of the “normal” ejecta but has stronger absorption features due to non-local thermodynamic equilibrium (nLTE) effects (Blondin et al., 2013), 2) material ejected at high velocity during the explosion (Mazzali et al., 2005; Tanaka et al., 2006; Kato et al., 2018), and 3) material swept up by the ejecta after the explosion (Gerardy et al., 2004). Any cause of these features must explain the polarization and the temporal evolution of both the HVF and PVF.
Mulligan & Wheeler (2017), hereafter MW1, investigated the interaction between a model SN Ia and a compact circumstellar shell in an attempt to characterize the temporal behavior of the HVF in the CaNIR line. They employed a 1-D hydrodynamic simulation of the collision of the ejecta with shells of various mass from 0.003 – 0.02 to establish the density profile of the resulting collision and generated synthetic spectra assuming constant ion state and excitation temperature. The calcium abundance of the shell was taken to be a free parameter. They explored the effect of the equation of state, the explosion model, and the width, initial density profile and mass of the shell on the appearance and temporal evolution of the CaNIR line. They compared the evolution of the pseudo-equivalent width (pEW) of the CaNIR feature from their models to observational results from Silverman et al. (2015) and found that the mass of the shell must be less than .
Mulligan & Wheeler (2018), hereafter MW2, used the models and techniques of MW1 to explore the evolution of the HVF and PVF in the CaNIR feature in the well-observed SN 2011fe. They concluded that the CaNIR feature is better explained by the supernova model interacting with a shell than the model without a shell, with a shell of mass 0.005 resulting in a somewhat better fit than shells of other masses. The evolution of the optical depth of CaNIR suggested that the ionization state of calcium within the ejecta and shell is not constant. MW2 noted that their model line profiles were intrinsically non-Gaussian and discussed associated ambiguities in observational methods for determining the presence and the pEW of the HVF by fitting multiple Gaussian profiles to the line features. They concluded that the physical properties of the HVF or other components could be misinterpreted.
The models of MW1 and MW2 were unable to constrain the abundance of calcium in the ejecta or shell nor the underlying substrate of the shell. The latter could plausibly be hydrogen, helium or a mixture of carbon and oxygen. In this work we make use of tardis (Kerzendorf & Sim, 2014) to generate synthetic spectra from a set of models of MW1 to explore constraints on all these factors, qualitatively comparing the generated spectra to the observed spectra of SN 2011fe at equivalent epochs after the explosion.
In Section 2, we describe the supernova-shell interaction models used for generating the synthetic spectra, the abundance models that are applied to the supernova ejecta and the shell, and the additional inputs required for tardis. In Section 3 we present the generated spectra for each model and compare those spectra to that of SN 2011fe and discuss the implications of the results. We present our conclusions in Section 4. Most of the models we present concentrate on a hydrogen substrate. Results for other substrates are given in appendices.
2 Methods
2.1 Supernova-shell interaction models
We use the supernova-shell interaction models of MW1 as the source of velocity and density information for the supernova ejecta and the shell. These models make use of the Gamezo et al. (2005) delayed-detonation explosion model for the supernova itself, and surround the supernova with a compact (radius ) shell. The explosion model includes density, internal energy, and composition information for the supernova, though the composition is limited to groups rather than specific elements; e.g. silicon, sulfur, and calcium are all considered part of the silicon group. The explosion and shell data are used as starting conditions in a hydrodynamic simulation using FLASH. In the simulation, the shock is given time to propagate through the shell until both the shell and ejecta are expanding adiabatically.
In this work, we use only models #49, #53, and #57. Each model has a shell with an initial outer radius of 0.3, uses delayed detonation model c for the explosion and ejecta with the gamma-law equation of state and has a saw-tooth density profile with the highest density at the edge closest to the explosion. Model #s 49 and 53 are used only for evaluation of the compositions of helium envelopes of SNe Ia of 0.01 and 0.02, respectively, described by Shen & Moore (2014). We have chosen model # 57, with a shell of mass 0.005, as a slightly better match to SN 2011fe, though the differences between the spectra resulting from different masses of the shell is small, and thus this model is generally representative of shells with a mass near 0.01. We hereafter refer to the shell models based upon the mass of the shell rather than the model number for clarity.
The hydrodynamic models provide density as a function of velocity that is then used as an input to tardis. The density is sampled at 256 points spanning the range of velocity of both the ejecta and shell. The spectra will be somewhat sensitive to the density profile of the ejecta, but we believe this to be a secondary effect compared to other model uncertainties. The angle-averaged density profile we have constructed from the models of Gamezo et al. (2005) gives a nearly exponential profile in keeping with models of this type. For the ejecta, the group composition from the Gamezo et al. (2005) model is used to provide a broad framework of the structure; the details of abundances for each element within each group are described in Section 2.2.
2.2 Compositions
For the composition of the ejecta, we use the group composition information that is given in the initial explosion model and the result of the hydrodynamic simulation of the interaction between the supernova and shell. In order to provide details of the individual elements of each group, we use the nucleosynthetic yields by mass of the delayed-detonation SN Ia explosion model N100 of Seitenzahl et al. (2013) for stable nuclides. We hereafter refer to this abundance model as “Seitenzahl-like.” We find the relative abundance of each element within each group, then assume that the ratio holds for any areas in which elements within that group appear. The ratio of abundances for each element within the associated group are listed in Table 1. In addition to a pure Seitenzahl-like composition, we also consider composition models in which the calcium content is depleted. These models named as “N100,” where is the enhancement () or depletion () of calcium by dex within the silicon group. For example, a Seitenzahl-like composition that is depleted by 1 dex in calcium would be named ‘N100-1.’ We note that the use of stable nuclides results in excess iron that should instead be in the form of cobalt and / or nickel at the epochs that we are considering. We have determined that this overabundance of iron does affect the flux by a factor of 2 blueward of about 5000 Å, but does not otherwise change the results and conclusions presented here.
| Mass | ||
| Fraction | ||
| within | ||
| Group | Element | Group |
| C | C | 1.0 |
| O | O | 1.0 |
| Mg | F | |
| Mg | Ne | |
| Mg | Na | |
| Mg | Mg | |
| Mg | Al | |
| Si | Si | |
| Si | P | |
| Si | S | |
| Si | Cl | |
| Si | Ar | |
| Si | K | |
| Si | Ca | |
| Fe | Sc | |
| Fe | Ti | |
| Fe | V | |
| Fe | Cr | |
| Fe | Mn | |
| Fe | Fe | |
| Fe | Co | |
| Fe | Ni | |
| Fe | Cu | |
| Fe | Zn | |
| Fe | Ga |
The composition of the material causing the HVF (i.e. the shell) is unknown, so we explore many possible models to identify those that look most similar to SN 2011fe. We base all compositions on the solar abundance of metals given in Asplund et al. (2009). Allowing that the material in the shell may be the result of mass transfer from a white dwarf or otherwise stripped-envelope star, we also consider compositions in which hydrogen has been completely converted to helium and compositions in which all hydrogen and helium have been converted to carbon and oxygen. We refer to the primary constituent of each composition as the substrate and to this group of compositions as “solar-type.” While the basis of each of the metal compositions is solar, we consider enhancement or depletion of calcium relative to a solar abundance. When referring to these abundance models, we name them by their substrate, basis composition, and calcium enhancement or depletion in dex. For example, a hydrogen substrate with solar abundance of metals and calcium enhanced by 2 dex is “H-Solar+2.”
In addition to solar-type abundances, we also consider the abundances of helium envelopes that have undergone detonation just prior to the supernova explosion, as described by Shen & Moore (2014). We select envelopes with masses of 0.005, 0.01, and 0.02 and the subsequent yield after detonating around a 1 carbon-oxygen white dwarf. The masses of these envelopes span the estimated range of mass of the high-velocity material and are enhanced in silicon and / or calcium, offering a possible source of HVF. The compositions for these envelopes after detonation, derived from Shen & Moore (2014, Figure 11) are given in Table 2. When generating spectra with these abundance models, we use the models of MW1 with a shell of appropriate mass, i.e. for an envelope of mass 0.01, we use the MW1 model with a shell of mass 0.01. The shell masses given in Shen & Moore (2014) do not contain the mass of outer unburned helium. The mass fractions we use for a given shell mass may thus be somewhat too large if normalized to the total mass of the shell. We also note that the kinematics of a sub-Chandrasekhar mass detonation and subsequent interaction with the envelope would not match that of the Gamezo et al. (2005) delayed-detonation supernova interacting with the shells of MW1. The resulting structure in our models has most of the density that will contribute to the spectrum of the shell near the base of the shell where the calcium that contributes to the spectrum will reside even if the original shell is layered. The detailed composition in the outer parts of the shell, helium or calcium, does not contribute much since they are accelerated to very high velocities and very small optical depths. We consider our treatment a first approximation to the effect of the helium envelope upon the spectra; the velocity of the material within the remnants of the envelope are likely to have a lower velocity, and perhaps higher density, than the shell models of MW1.
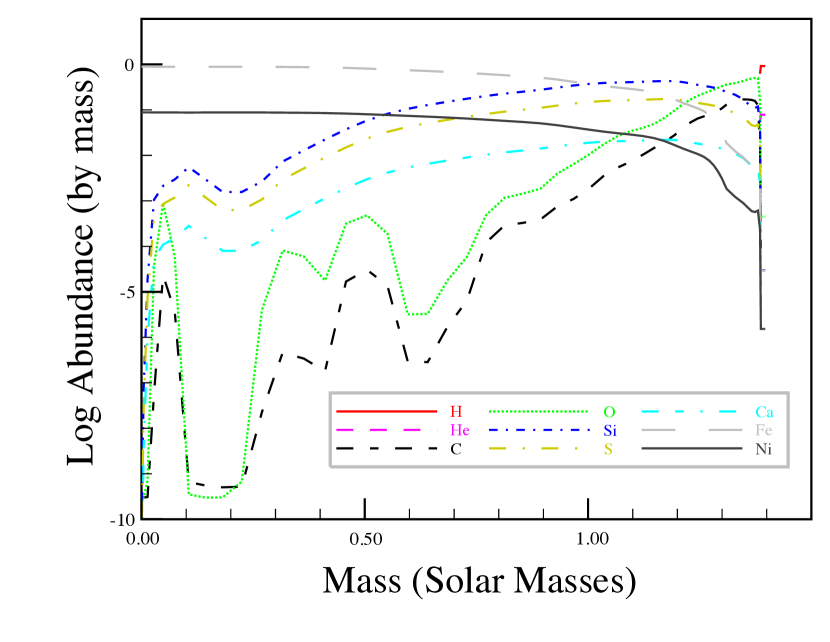
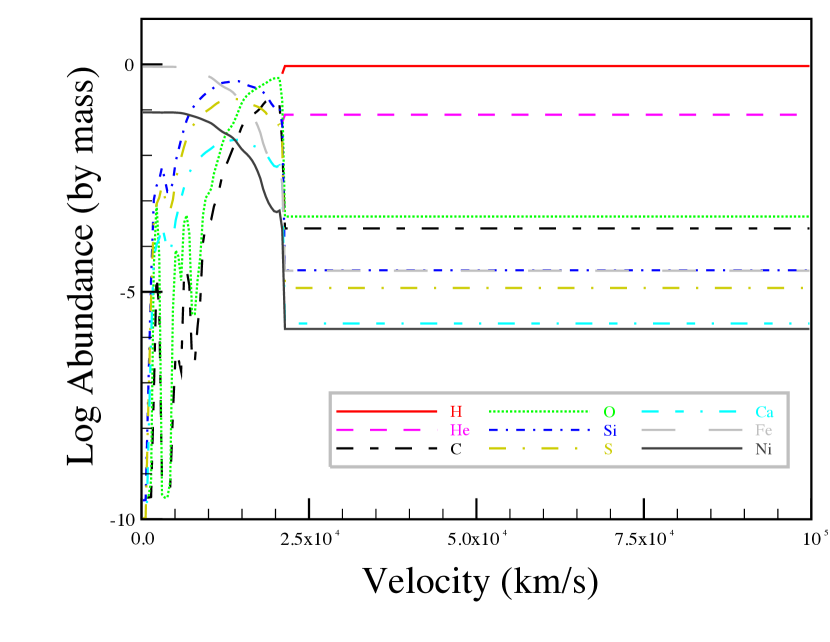
Figure 1 shows an example abundance as a function of mass (top panel) and velocity (bottom panel) for an abundance model N100+0 for the ejecta and model H-Solar+0 for the shell. This figure demonstrates that, while the shell consists only of a small fraction of the mass of the supernova ejecta, it occupies a large range of velocities. For the shell with a mass of 0.005, the contact discontinuity lies at 20,880.
| Envelope | |||||||
|---|---|---|---|---|---|---|---|
| Mass | |||||||
| Name | [] | ||||||
| S&M-M0.005 | 0.005 | -0.11 | -0.72 | - | - | - | - |
| S&M-M0.01 | 0.01 | -0.16 | -2.61 | -1.62 | -4.16 | - | - |
| S&M-M0.02 | 0.02 | -0.24 | -3.59 | -0.82 | -0.65 | -1.74 | -3.59 |
2.3 Synthetic spectra
We use tardis to generate the synthetic spectra of the models described in Sec. 2.1 and using the composition described in Sec. 2.2. Tardis is well suited for the particular problem explored in this paper that requires the computation of a large number of models to explore CaNIR HVF parameter space. Tardis can only compute supernova atmospheres in spherical symmetry, and while the HVF problem surely requires departure from spherical symmetry, our current models are also restricted to that regime. Given that condition, tardis uses Monte Carlo (MC) methods to iterate to a self-consistent calculation of the radiation field and corresponding ionization and excitation and to compute a synthetic spectrum. The radiative transfer and associated physics can be treated with various levels of sophistication. While quite general, tardis was originally designed to be efficiently applied to SN Ia, as we do here. In their presentation of the tardis code, Kerzendorf & Sim (2014) note that of the prominent species present in the atmospheres of SN Ia, silicon, sulfur, magnesium, and calcium, Ca ii features are the least sensitive to the choice of excitation mode and are well represented by simple Boltzmann excitation levels. This also bodes well for the current study.
Tardis does not simulate spectral evolution directly, but provides a “snapshot” at a given epoch, again a process well suited for the current problem where we study conditions at three specific epochs in the expansion of of the supernova. Tardis accepts an arbitrary density profile that we provide with our shell interaction models and an arbitrary abundance profile that we vary in this study. The total luminosity is specified for the supernova; tardis iterates upon a photospheric luminosity that results in the desired total luminosity. We use the luminosity of SN 2011fe as reported by Pereira et al. (2013), using linear interpolation of the log of the luminosity at each epoch, resulting in luminosities of 7.81 at 2 d, 8.62 at 5 d, and 9.19 at 9 d after the explosion.
Tardis does not treat non-radiative energy sources such as radioactive decay and we neglect all such effects in this work. This means the photosphere must be external to the regions in which the majority of the luminosity is produced, a good approximation for the early phases we study here. The radiation field is injected at the inner boundary (the photosphere) with a blackbody temperature consistent with the luminosity adopted at that radius. For the photospheric velocity, we use the photosphere velocities determined in MW2 for the model with a shell of mass 0.005, smoothed by a third-degree polynomial to reduce noise, resulting in a photospheric velocity of 16,470 at 2 d after the explosion, 14,300 at 5 d after the explosion, and 11,780 at 9 d after the explosion. Finally, for the initial temperature estimates, we use the color indices of Zhang et al. (2016) to estimate the color temperature of the radiation. We select initial temperatures of 6325 K at 2 d after the explosion, 6676 K at 5 d after the explosion, and 7321 K at 9 d after the explosion. We acknowledge that the effective temperatures of SN Ia are not well identified by the color temperature, but in practice we find that the choices of the initial radiation temperatures have little effect on the final temperatures in tardis. The final radiation temperatures generated by tardis at the inner boundary are 11,100 – 11,800 at 2 d, 11,600 – 12,100 at 5 d, and 13,400 – 13,800 at 9 d, with the ranges due to the slight differences in the electron density and total opacity resulting from the intermediate mass elements.
We use tardis in the nebular mode for ionization and the dilute-LTE mode for excitation. Radiative rates are treated in the detailed mode and line interactions are treated in the macroatom mode. We use packets for models during convergence, and or packets for each final spectrum. We have computed about 150 synthetic spectra using tardis in the course of this study. We find that each model requires several CPU-hours of computing time rather than the few minutes per spectrum described in Kerzendorf & Sim (2014). This is likely due to our use of detailed density and abundance models as inputs.
2.4 Reference spectra of SN 2011fe
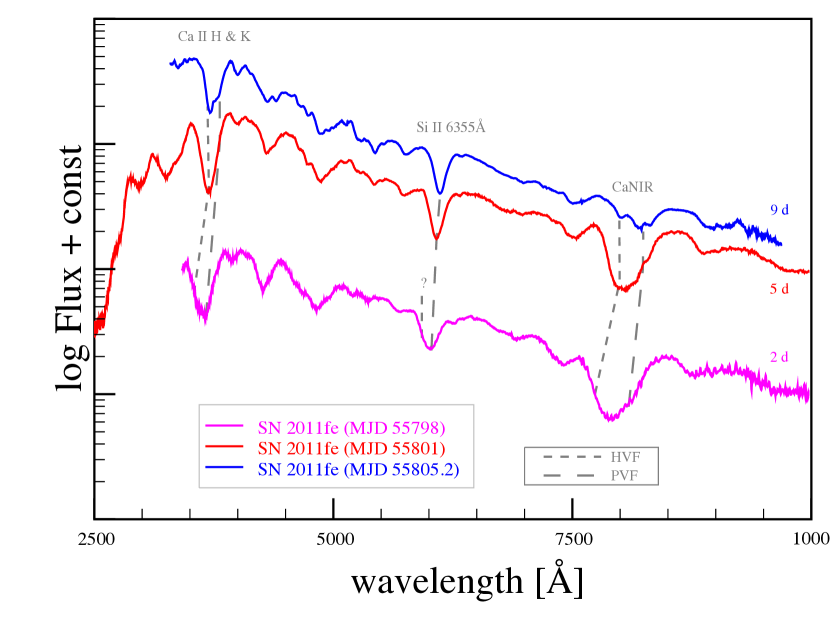
We use spectra of SN 2011fe as a comparison at each epoch (2, 5, 9 d) in order to get a sense of the relative strength of observed features, mainly focused on the Ca ii, Si ii, and O i features. The spectra were acquired from Guillochon et al. (2017), dereddened according to Cardelli et al. (1989) with corrections to the visual range from O’Donnell (1994) using of 0.0077, and shifted into the rest frame wavelength using a redshift of 0.000804. We assume an explosion date of MJD 55796.696 from Nugent et al. (2011), and use the Nugent et al. (2011) spectrum taken on MJD 55798.2 as a reference at 2 d after the explosion, the Mazzali et al. (2014) spectrum taken on MJD 55801.17 as a reference at 5 d after the explosion, and the Parrent et al. (2012) spectrum taken on MJD 55805.2 as a reference at 9 d after the explosion. At each epoch, we scale the data such that it approximately matches the synthetic spectra, typically using the blue side of the Si ii feature as the point of normalization. Figure 2 shows these spectra at each epoch, and highlights the Ca ii H&K, Si ii 6355 Å, and CaNIR HVF and PVF.
3 Results
We consider each abundance model for the shell and ejecta at three epochs: 2 d, 5 d, and 9 d after the explosion, spanning the range in which the high-velocity features of calcium are significant relative to the photospheric features. At each epoch, we consider the range of calcium abundance in the shell that may have an observable affect upon the spectrum. As described in the following sub-sections, we find that the solar-type composition models with a hydrogen substrate are broadly representative of the other solar-type models, and therefore use the hydrogen substrate only to demonstrate the effect of adjusting the calcium yield within the ejecta and to generate a “best” fitting model. We present the results with a helium and with a carbon-oxygen substrate in Appendices A and B, respectively.
We begin with a standard model and then alter the calcium abundance in the shell primarily to modify the blue portion of the CaNIR and the calcium abundance in the ejecta primarily to modify the red portion. For very strong shell calcium, flux is shifted to the red and also modifies that portion of the spectrum. We first illustrate variations in the shell abundance, then the ejecta abundance and then present a model that produces the overall best match to the data. This latter step is produced with “fit by eye" rather than any formal fitting procedure, given the expense of each model atmosphere.
3.1 2 days after the explosion
3.1.1 Solar-type with hydrogen substrate
Figure 3 shows the spectra that result from abundance model N100+0 for the ejecta and the hydrogen substrate abundance models for the shell. Note that as the quantity of calcium within the shell increases in the models, the absorption increases, leading to the P Cygni peak also getting stronger, illustrating the redistribution of the flux. Similar behavior is seen in many of the models presented below. The Ca ii H&K feature is not affected by the calcium within the shell at this epoch.
Despite the shell in these abundance models containing mostly hydrogen, there is no evidence of hydrogen absorption or emission within the synthetic spectra, including in the mid- and far-infrared to 3 (not shown in the figure). We note that limitations in the way Tardis treats excitations may play a role in this context. Tardis is not well designed to treat excitations in high energy levels such as the n = 2 level of hydrogen from which the Balmer lines arise. This may serve to artificially suppress the model hydrogen line strengths.
The bottom panel of Figure 3 shows just the CaNIR feature for the hydrogenic shells. The models with -0.5 dex and with solar calcium abundance in the shell have what appears to be a discernable HVF that is not seen in the models with more calcium in the shell, nor in SN 2011fe. This feature may show up in other models (see Figures 7, 16). The model with -0.5 dex calcium abundance in the shell shows that the absorption within the ejecta (i.e. the PVF) may be too strong at this epoch when using the N100+0.0 model. The shell with only a solar abundance of calcium cannot explain the observed HVF component, but an enhancement of +0.2 – +0.4 dex above solar value of calcium within the shell, with the N100+0.0 composition for the ejecta, does reasonably well in fitting the observed feature. As the quantity of calcium within the shell increases, the feature gets deeper and broader toward the blue, while the P Cygni peak is enhanced. An enhancement of 0.6 dex or more in calcium results in an excessively strong CaNIR feature.
There is an additional model absorption feature that appears near 8600 Å that has not been observed (or at least has not been observed to be as strong) in SN Ia and appears to get weaker with increasing calcium content in the shell. This feature will appear in nearly all spectra generated from the compositions that we consider. The apparent decrease in strength of this feature with increasing calcium within the shell is largely the result of increasing P Cygni emission as the CaNIR feature gets stronger. Fine tuning of the structure or composition of the ejecta would assist in improving the appearance of this feature but that is not the focus of this work.
It is notable that the synthetic spectrum is very deficient in the blue and may have excessive P Cygni emission associated with the silicon 6355 Å feature. The lack of blue photons may be the result of the use of the stable nuclides from the Seitenzahl N100 model — this particular mix only occurs years after the supernova when radioactive nuclei have decayed to stable isotopes; most notably all nickel-56 has decayed to iron-56; as the iron-group elements make up one per cent or more (by mass) of most of the ejecta, there is a strong excess of iron throughout the ejecta that causes absorption, particularly in the blue. At 2 d after the explosion, over 99 per cent of the material that will become iron-56 is still either nickel or cobalt. Not accounting for radiative effects, this suggests that the iron absorption is about 100 times too strong in these synthetic spectra. An alternative is that there may be limitations in the manner in which tardis determines the photosphere. In a “scattering" code such as tardis, the choice of photospheric location can potentially affect the overall spectral energy distribution. We have explored this possibility by varying the photospheric radius by 10%, with little effect. A larger variation would displace the minima of the photospheric features and hence violate that strong constraint. A deeper exploration of this issue may be warranted, but is beyond the scope of this paper.
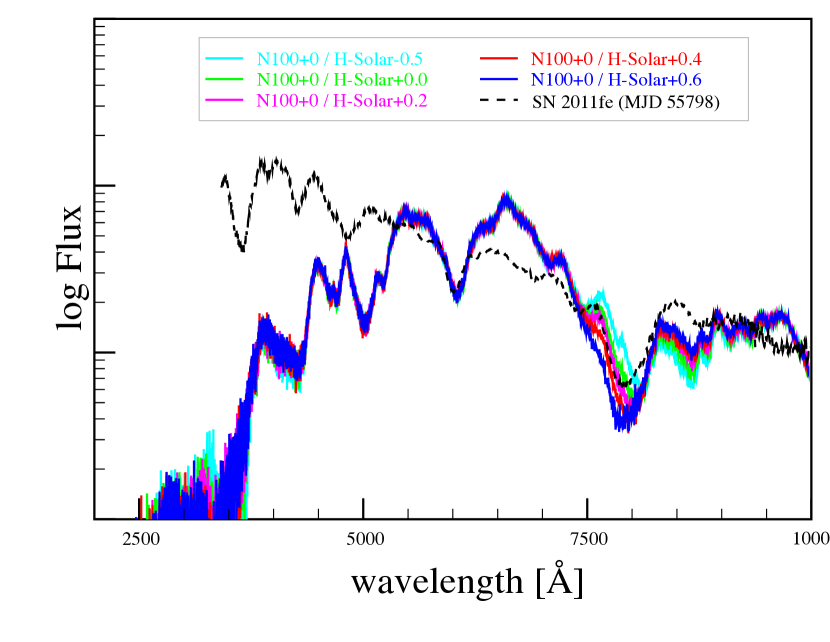
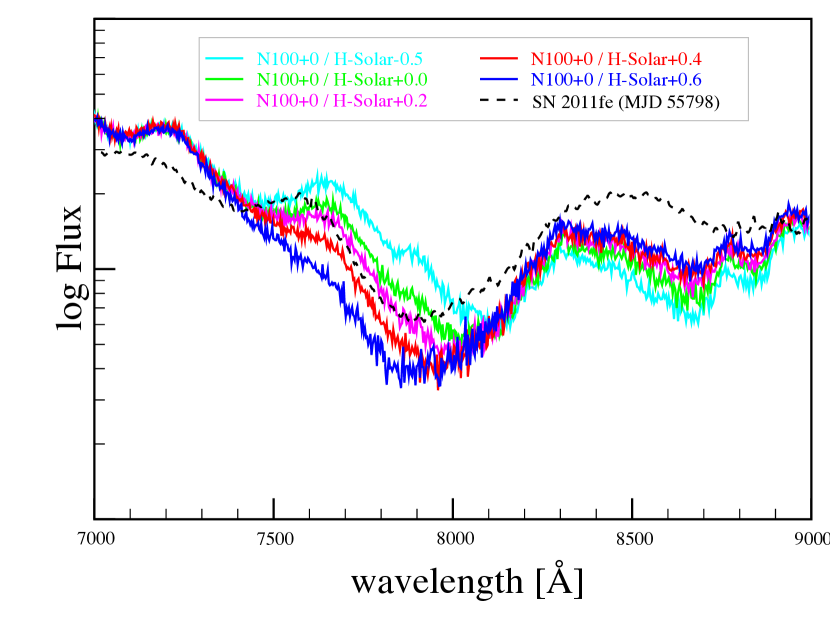
Figure 4 shows the effect of calcium within the ejecta on the synthetic spectra, depleting the calcium yield relative to the Seitenzahl et al. (2013) N100 model with stable nuclides by -5 – 0 dex. Decreasing the calcium within the ejecta has an effect of slightly weakening the CaNIR feature, though increasing the flux of the related P Cygni peak. The effect of the ejecta upon the CaNIR feature is entirely on the red side of the feature, at wavelengths 8000 Å. It is not clear that any one model of abundance in the ejecta results in a spectrum that is a better fit to the observed CaNIR feature at this epoch. Replacement of the calcium within the ejecta with silicon results in a slight enhancement of the Si ii 6355 Å feature.
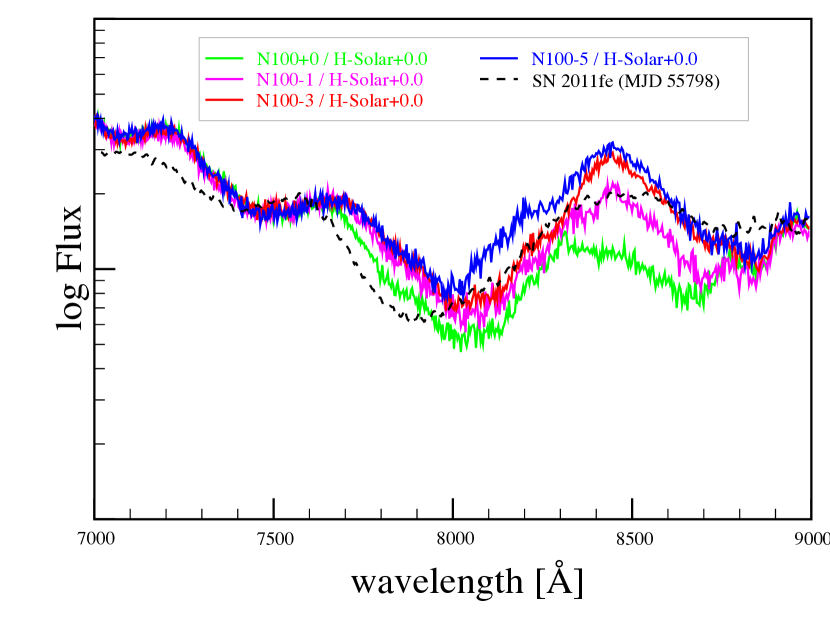
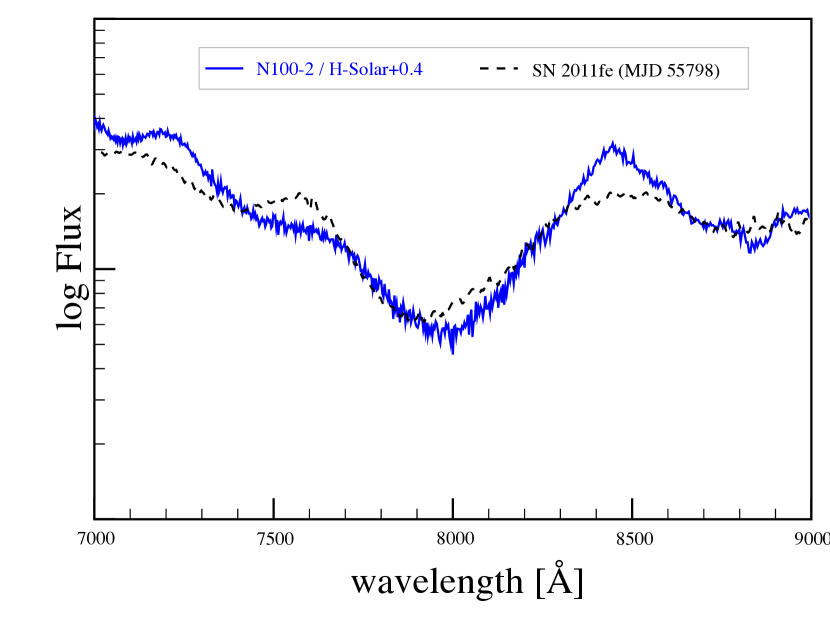
Figure 5 shows the result of an effort to produce a combination of ejecta and shell abundances to better match the observed CaNIR feature of SN 2011fe. We select a depletion of 2 dex of calcium relative to the Seitenzahl et al. (2013) N100 model with stable nuclides, and 0.4 dex of enhancement of calcium within the shell, relative to a solar value, based upon visual inspection of the results shown in Figures 3 and 4. The Ca ii H&K feature (not shown) is not affected by the choice of calcium within the ejecta or shell. This model captures the width and depth of the CaNIR feature reasonably well, though the peak of P Cygni emission is slightly too sharp and has slightly too much flux. The sharpness of the P Cygni peak may be in part due to the absorption feature near 8600 Å. The blue edge of the CaNIR feature is slightly too rounded relative to the observed feature.
3.1.2 Shen & Moore-type envelopes
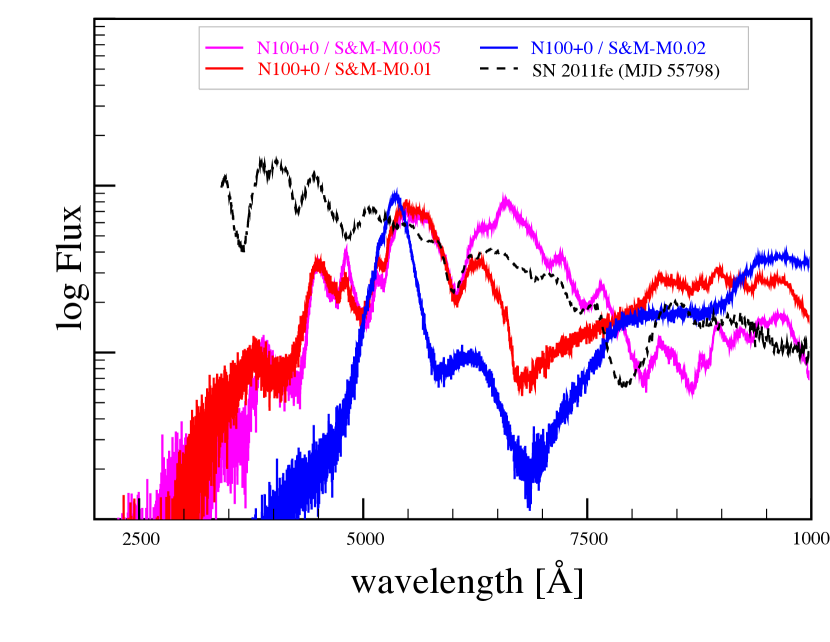
Figure 6 demonstrates the synthetic spectra resulting from Shen & Moore (2014) type abundances within the shell, as given in Table 2. Of the three models considered, that with a helium envelope of 0.005 fits the observed feature of SN 2011fe most closely. As this model does not include any calcium in the shell, the CaNIR feature is the result of only absorption within the ejecta and does not reproduce the high velocity wing of the feature. Despite the shell containing over 22 per cent silicon, there is no evidence of a HVF in the Si ii 6355 Å or other silicon features. This is related in part to the lack of calcium HVF in the helium substrate (see Appendix A) — the helium does not ionize easily, leading to lower electron density and higher ionization state of the silicon within the shell.
The 0.01 envelope model is similar to that of the helium substrate model with 3 dex enhancement of calcium(not shown), with a CaNIR feature extending to about 6300 Å; the 0.02 envelope model generates a strong calcium feature between about 5000 – 7500 Å. These two models clearly can be ruled out at this epoch.
3.2 5 days after the explosion
3.2.1 Solar-type with hydrogen substrate
Figure 7 shows the spectra that result from abundance model N100+0 for the ejecta and the hydrogen substrate abundance models for the shell at 5 d after the explosion. There continues to be no evidence of hydrogen absorption or emission within the synthetic spectra at this epoch, nor any effect of the calcium within the shell upon the Ca ii H&K feature.
The bottom panel of Figure 7 focuses on the CaNIR feature. At this epoch, an enhancement of near 1 dex of calcium within the shell, relative to a solar abundance, is required to match the CaNIR HVF of SN 2011fe. Enhancement of calcium by 2 dex within the shell causes an excessively strong feature. The blue edge of the feature is greatly softened by the material within the shell. The enhancement of calcium within the shell required to generate a HVF at this epoch is a factor of about 10 greater than the enhancement required at 2 d; we discuss the meaning and implications of this in Sec. 3.4.
The Si ii 6355 Å and O i 7773 Å features resulting from the models are stronger than the observed features at this epoch, with the O i feature being particularly enhanced. Both of these are associated with the ejecta rather than the shell and may represent an overabundance of silicon and oxygen at velocities higher than that of the photosphere within either the Gamezo et al. (2005) explosion model or an overabundance in the yields of oxygen and silicon within the Seitenzahl et al. (2013) N100 model.
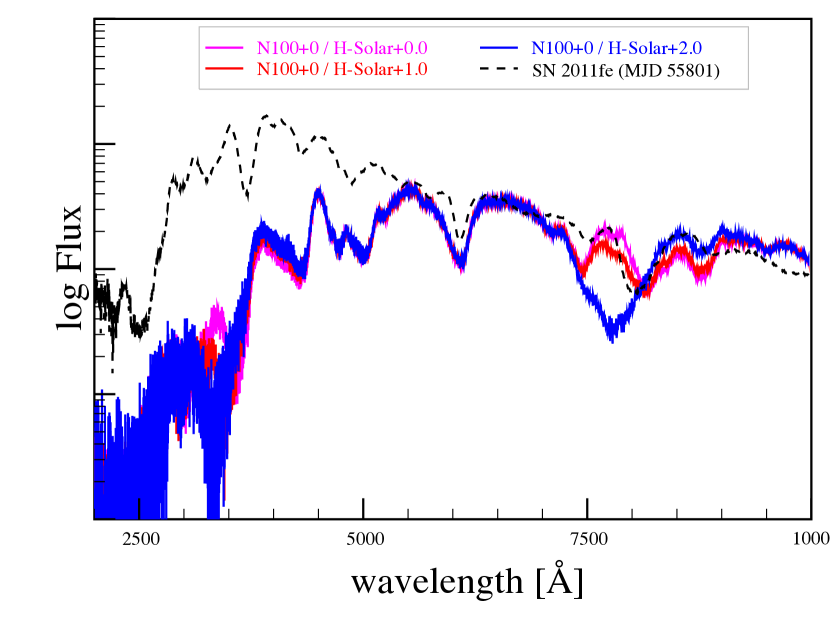
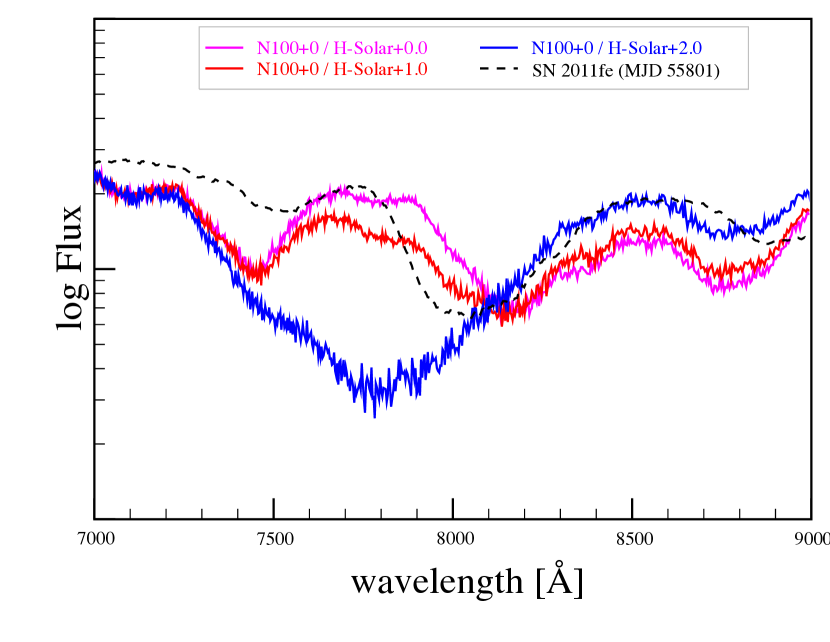
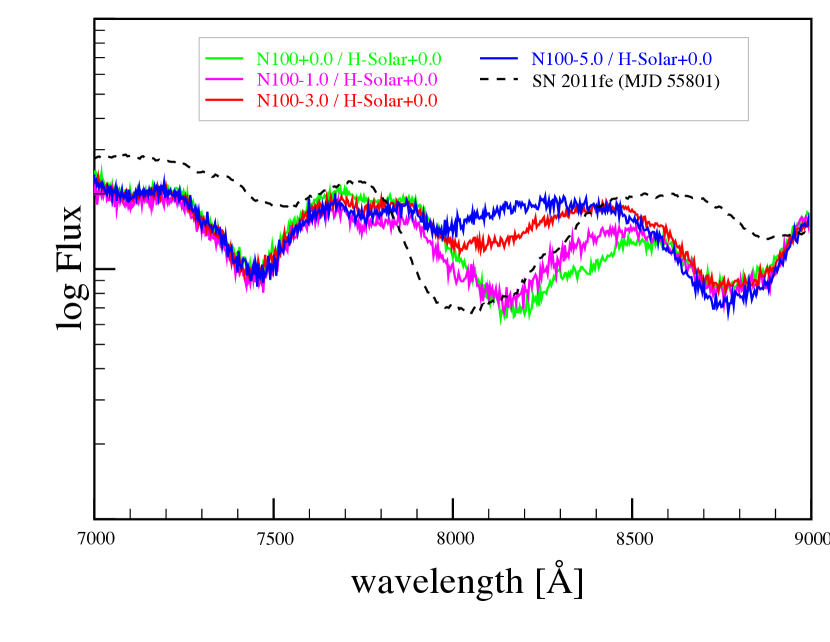
Figure 8 shows the effect of calcium within the ejecta on the synthetic spectra, depleting the calcium yield relative to the Seitenzahl et al. (2013) N100 model with stable nuclides by -5 – 0 dex. The effect of the ejecta on the CaNIR feature is entirely redward of 7900 Å, with the minimum occurring near 8150 Å. There is a significant HVF between 7800 – 8000 Å that cannot be explained entirely by the ejecta at this epoch. It is again not clear that any one model of abundance in the ejecta results in the CaNIR feature better fitting the observed feature at this epoch, though a calcium yield within – 0 dex of the Seitenzahl et al. (2013) N100 model is likely necessary to explain the PVF.
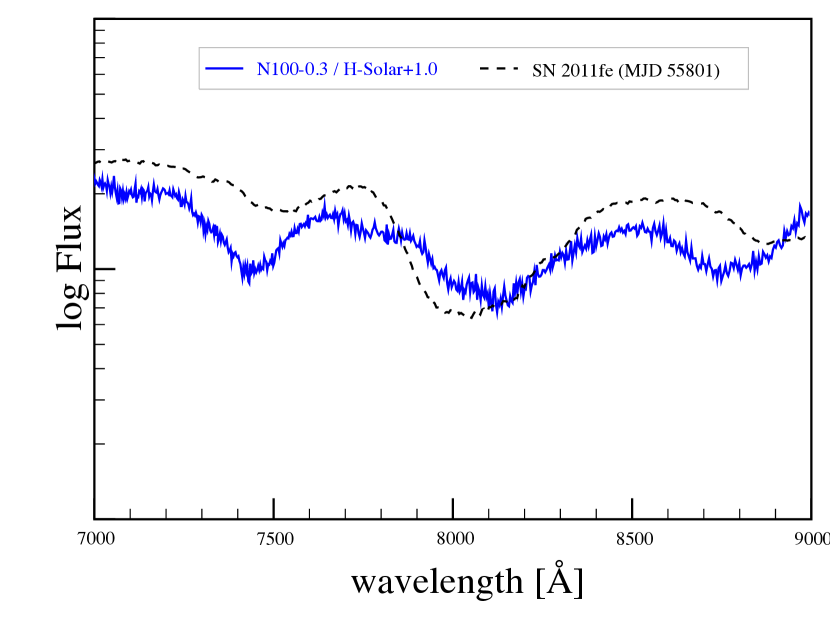
Figure 9 shows an effort to produce a best combination of ejecta and shell abundances to match the observed CaNIR feature of SN 2011fe. We select a depletion of 0.3 dex of calcium relative to the Seitenzahl et al. (2013) N100 model with stable nuclides, and 1.0 dex of enhancement of calcium within the shell, relative to a solar value. This model represents a balance between matching the depth of the feature blueward of 8000 Å, while avoiding excessive absorption blueward of 7800 Å. In this model, the P Cygni emission is slightly too weak compared to the observed CaNIR feature.
3.2.2 Shen & Moore-type envelopes
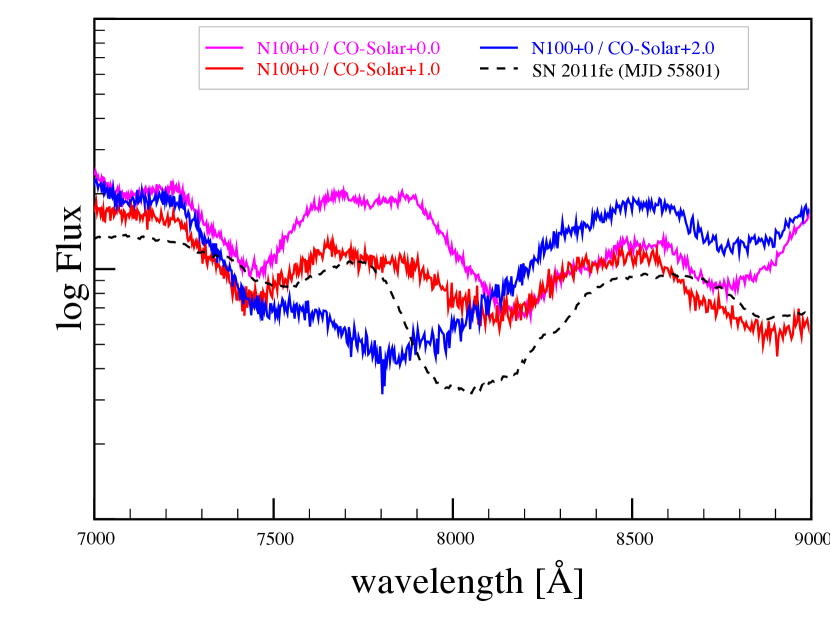
Figure 10 shows the synthetic spectra at 5 d for the Shen & Moore (2014) type abundance models. The models with an envelope of mass 0.01 and 0.02 have an excessively strong and extended CaNIR feature; the 0.02 model also shows evidence of an HVF for the Si ii 6355 Å feature that is much stronger than those that are observed. The model with an envelope of mass 0.005 is very similar to that of the models with a helium substrate for the shell but does not have any enhancement of calcium features due the absence of calcium in the envelope.
3.3 9 days after the explosion
At 9 d after the explosion, there appears a feature in the spectra of SN 2011fe at about 8240 Å that is clearly the HVF. As you will see in the following subsections and figure, it is difficult to reproduce this feature with our tardis models.
3.3.1 Solar-type with hydrogen substrate
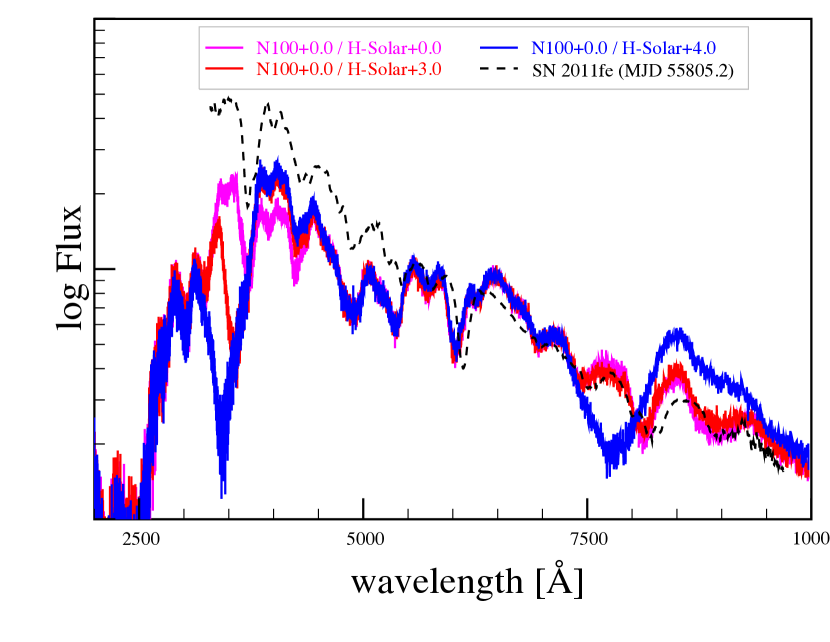
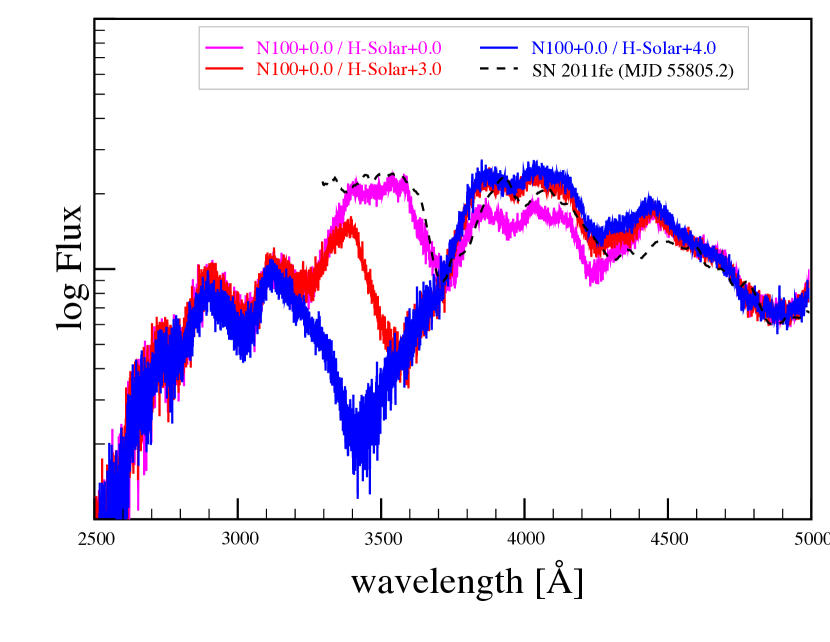
Figure 11 shows the spectra that result from abundance model N100+0 for the ejecta and the hydrogen substrate abundance models for the shell at 9 d after the explosion. There continues to be no evidence of hydrogen absorption or emission within the synthetic spectra at this epoch, but the calcium within the shell does affect the Ca ii H&K feature. The O i 7773 Å and Si ii 6355 Å features better match the observed features in SN 2011fe, although both features have minima that are too blue by 100 Å. We computed models with lower photospheric velocities, but the overall nature of the resulting model spectra deteriorated substantially, characterized by substantial deficit in the blue. The low velocities of the O i 7773 Å and Si ii 6355 Å features may be a structural problem with the models of Gamezo et al. (2005) rather than a problem with the photosphere velocity.
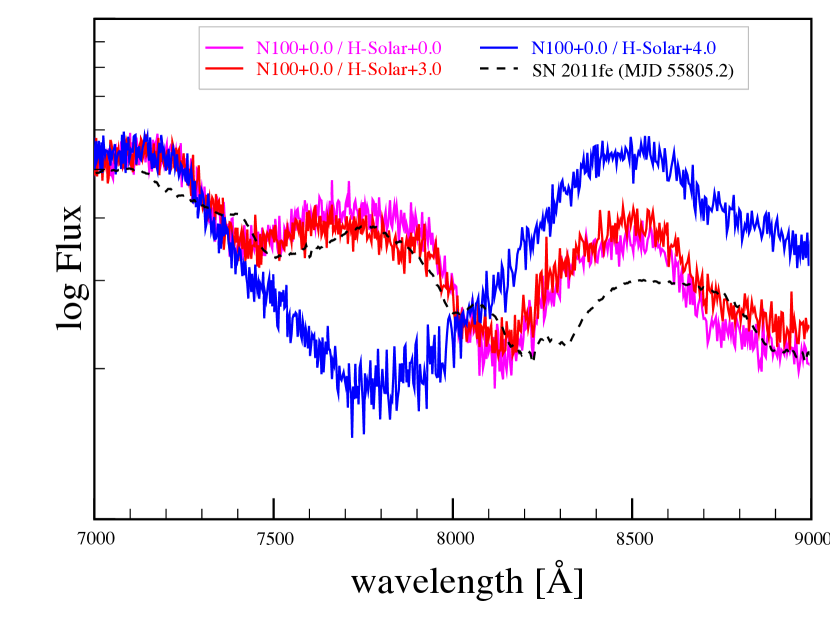
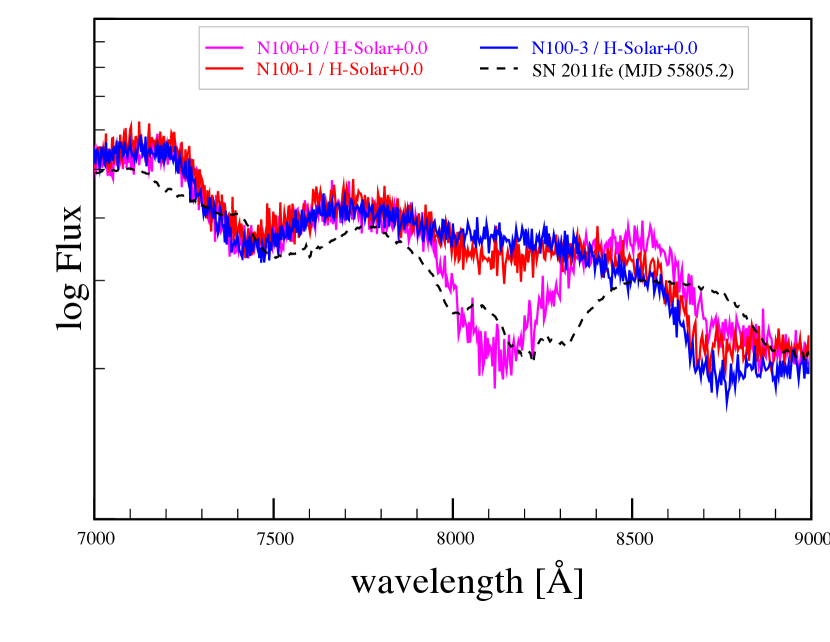
The bottom panel of Figure 11 focuses on the CaNIR feature. Up to +3 dex of enhancement of calcium above solar value within the shell has little to no effect on the CaNIR feature. An enhancement of +4 dex produces a strong HVF between 7500 – 8000 Å. At this epoch, the calcium within the ejecta results in a feature that is too blue by about 200 Å, or at least is lacking absorption near 8300 Å. Figure 12 shows the Ca ii H&K feature at this epoch. Enhancement of calcium within the shell leads to an overly deep and extended feature; this provides a constraint on the degree to which calcium can be enhanced in the shell without producing an overly strong Ca ii H&K feature.
Figure 13 shows the effect of calcium within the ejecta on the synthetic spectra, depleting the calcium yield relative to the Seitenzahl et al. (2013) N100 model with stable nuclides from -5 – 0 dex. The CaNIR feature becomes noticeably weaker with even a modest depletion of calcium in the ejecta. At this epoch, the observed feature in SN 2011fe is better matched by little to no depletion of calcium within the ejecta.
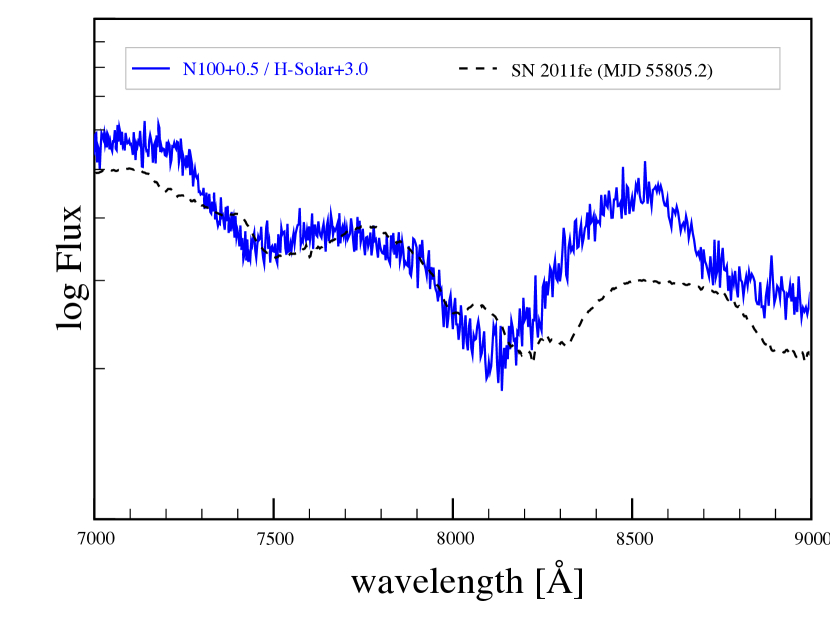
Figure 14 shows an effort to produce a best combination of ejecta and shell abundances to match the observed CaNIR feature of SN 2011fe. We select an enhancement of +0.5 dex of calcium in the ejecta, relative to the Seitenzahl et al. (2013) N100 model with stable nuclides, and +3.0 dex of enhancement of calcium within the shell, relative to a solar value. This model results in slightly too much absorption near 8100 Å, due to absorption within the ejecta, but matches the blue wing of the feature reasonably well. The model produces excessive flux on the red wing. Even with our best fitting model, we are unable to recreate the three components of the CaNIR feature seen in SN 2011fe at this epoch.
3.3.2 Shen & Moore-type envelopes
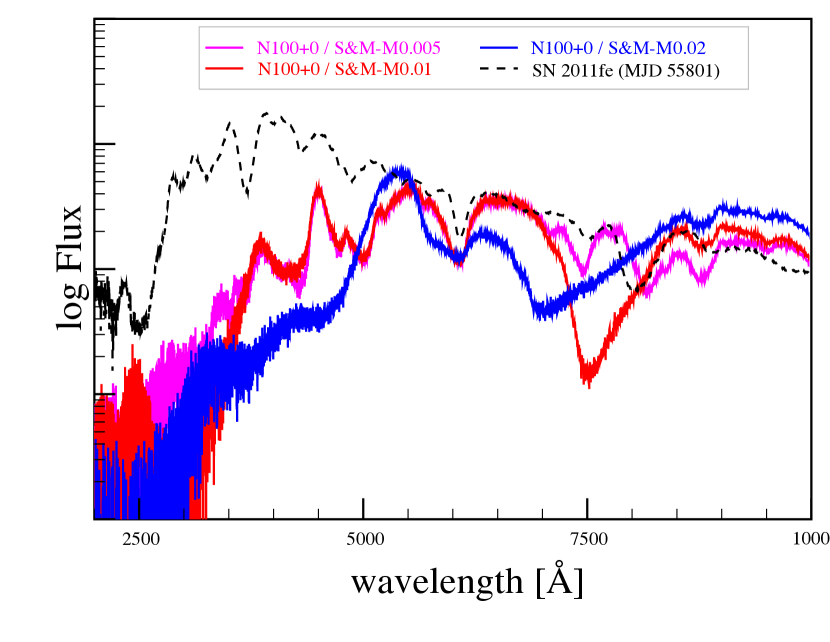
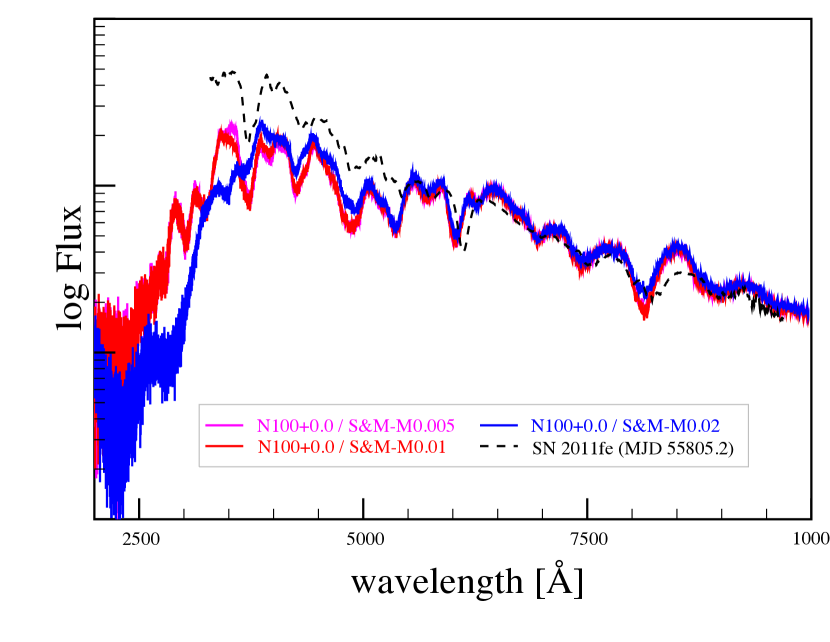
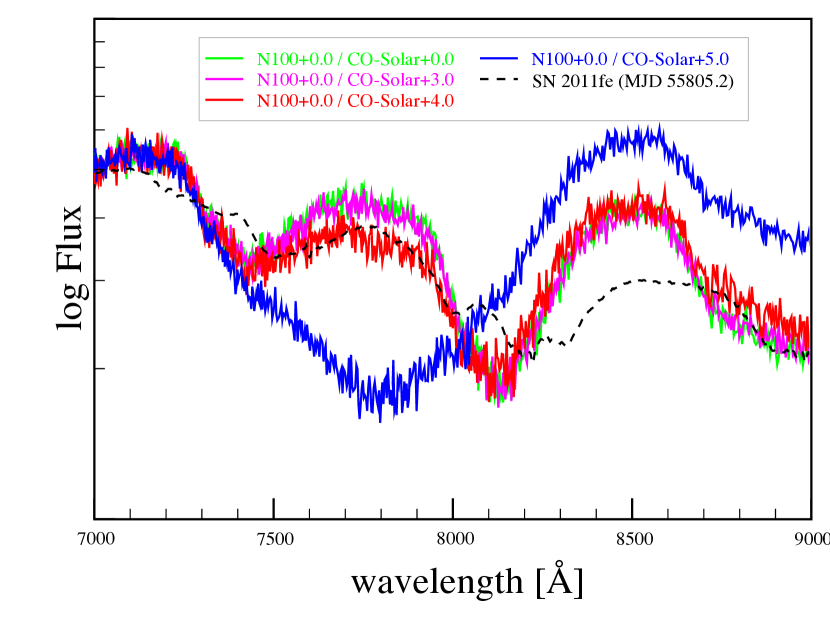
Figure 15 shows the synthetic spectra at 9 d for the Shen & Moore (2014) abundance models. At this epoch, the spectra generated from the 0.005 and 0.01 envelope models match that of the solar-type abundance models. The 0.02 model results in the flux blueward of 3500 Å to be affected, chiefly depletion by the iron present in the shell, and making the Ca ii H&K feature indistinct due to blending with absorption bands in the near-UV.
3.4 Discussion
In the prior subsections, we have considered shells with a mass of 0.005 with a hydrogen substrate and varying levels of enhancement of depletion of calcium within the shell or ejecta. Models with helium, or carbon-oxygen substrates are considered in the appendices. We find that the substrate has no effect on the spectrum, other than a higher abundance of calcium required in shells with a helium substrate due to the higher ionization potential (and hence lower electron density) of helium. Table 3 summarizes the preferred calcium abundances in the shell and in the ejecta at the three epochs we have considered 2, 5 and 7 days in comparison with SN 2011fe as given for Figures 5, 9, and 14. We also considered shells with masses of 0.005, 0.01, and 0.02 and employing related abundances of the helium envelopes of Shen & Moore (2014). The envelopes with a mass of 0.005 do not contain calcium, so fail to produce an HVF; the envelopes of 0.01 and 0.02 result in overly broad and strong HVF.
| Epoch | Shell1 | Ejecta2 |
|---|---|---|
| 2 days | +0.4 | -2.0 |
| 5 days | +1.0 | -0.3 |
| 9 days | +3.0 | +0.5 |
1 dex with respect to solar.
2 dex with respect to model N100 of Seitenzahl
et al. (2013).
Regarding shells with a mass of 0.005 with a hydrogen substrate, Shappee et al. (2013) and Botyánszki et al. (2018) find upper limits of and , respectively, of hydrogen during the nebular phase of SN 2011fe. These limits are based on the assumption of the hydrogen being stripped from a companion and residing at relatively low velocities (1,000–2,000) within the ejecta. It is not clear that this limit also applies to hydrogen that lies at the leading edge of the ejecta, well separated from the excitational radiation available from the nickel and cobalt decay nearer the centre of the supernova. For some models, we have extended the tardis results into the far-infrared. For our solar-type abundance models, there are no observable absorption or emission features due to the substrate within the near-ultraviolet to far-infrared range at the epochs that we consider.
A common result for all composition models at 2 and 5 d is that the PVF is too strong using the Seitenzahl et al. (2013) N100 composition model. There are many possible reasons for this: the abundance of calcium as a function of velocity within the ejecta may not be correct due to the combination of elements of similar atomic mass into groups in the explosion models of Gamezo et al. (2005); the distribution of silicon group elements in the explosion models may not represent the real distribution of these elements within SN Ia; the Seitenzahl et al. (2013) N100 explosion model may have an overabundance of calcium relative to other silicon group elements, or the physics that is incorporated into tardis does not fully explain the state of calcium within the ejecta. All of these factors likely play some role in affecting the appearance of the feature.
We have not found a consistent abundance of calcium within the shell that can explain the observed HVF. In MW2, we noted that the evolution of the parameters of the fit were inconsistent with the HVF fading solely due to the reduced density as the shell expands adiabatically. MW2 suggested that the ionization state of calcium within the shell (or ejecta) is likely not constant over the first few weeks after the explosion. While we expect that tardis does more accurately determine the ion state of calcium, it still relies on an incomplete approximation of the ionization state of all elements. The varying apparent abundance of calcium that is required may be the result of this approximation. We also note that we have assumed a uniform composition of the shell throughout; if the shell material is not homogeneous there may be less calcium required than we have found here. A non-homogeneous distribution of calcium within the shell may also explain why the blue side of the CaNIR feature for our best fit model tends to have a shallower slope than is observed in SN 2011fe.
At 9 d after the explosion, the CaNIR feature is better explained by only the calcium within the ejecta, although the PVF resulting from our models tends to be too shallow, slightly blue, and does not show the three components of the feature seen in SN 2011fe. The lack of a model HVF at this epoch is consistent with the findings of MW2. MW1 suggest that the strength of the PVF would overtake that of the HVF at about 8 d after the explosion, though we note that the photosphere velocity used in MW1 is much faster (by 5,000 – 14,000) than the velocities used in this work, leading to a much weaker PVF in MW1 at these early epochs. While Childress et al. (2014) and Silverman et al. (2015) both report a reasonably strong HVF component much later than 9 d after the explosion for SN 2011fe, we note that these works rely on fitting of multiple Gaussian features to an inherently non-Gaussian absorption feature. This fitting technique does not reliably capture the velocity or strength of the HVF once it blends with the PVF; see MW1 sec. 4.1 for further details.
3.4.1 Implications of super-solar calcium
In each of the solar-type compositions that we consider at 2 and 5 d, we need a super-solar abundance of calcium in the shell to generate the HVF. While this may be due to incorrect assumptions within tardis regarding the ionization or excitation state of calcium, it may accurately reflect the abundance of calcium in the shell. We can speculate on the source of this calcium by considering the possible sources of material for the shell.
If the source of the shell material is a companion star donating material, a super-solar calcium content may be suggestive of a relatively young companion. The ubiquity of HVF in SN Ia and the expectation that there are likely both long-delay and short-delay SN Ia suggest that many should have older companions with sub-solar abundances of calcium. Post-main sequence stars with masses below 7 tend to be depleted in calcium within their atmospheres (Karakas & Lugaro, 2016; Pignatari et al., 2016), so these are less likely to be the source of such calcium.
If the donor star were instead a white dwarf, the average calcium abundance may be solar, but settling of metals toward the center of the donor white dwarf would deplete the calcium in the outer layers and enhance it within the inner layers (Schatzman, 1958). The details of the merger process then dictate the abundance of calcium within the shell: it could be depleted in calcium, if it forms from the outermost layers of the donor; enhanced in calcium, if it forms from material nearer the core of the companion; or near the original metallicity of the star, if the material of the companion is mixed during the merger or accretion process. The original metallicity of the system should determine the strength of the HVF, suggesting that any SN Ia that originate from population II systems should have weaker calcium HVF. The ubiquity of the CaNIR HVF again argues against this possibility.
Another implication of the calcium content of the shell material being related to the original metallicity of the system suggests that HVF should be weaker with increasing redshift. The comprehensive studies of HVF in SN Ia that have been done to date (Childress et al., 2014; Maguire et al., 2014; Silverman et al., 2015) consider only nearby redshifts and no attempts have been made to evaluate the trend of the strength of the HVF with the redshift of the host galaxy.
Given that the HVF are common, generally similar in strength, and that variations of less than 1 dex in the abundance of calcium within the shell do not have significant effect on the HVF at 5 d and 9 d after the explosion (as well as at 2 d in some cases), it is possible that the calcium that generates the HVF is newly synthesized. This could be explained by material ejected from the supernova at high velocity, by nucelosynthesis on the surface of the progenitor during pre-explosion accretion, or by mixing of deeper layers of the supernova with the material in the shell. Our methodology here may be partially capturing that information, although it is unlikely that such ejected material would match our models in terms of density or kinematics.
One mechanism by which freshly synthesized calcium could be introduced into the shell would be through the Rayleigh-Taylor instabilities that would occur during the interaction between the shell and ejecta. If this were the source of the enhanced calcium in the shell, however, there would be a relatively smooth gradient of calcium abundance from the ejecta to the shell material, resulting in an indistinct HVF, unless only the outermost layers of the ejecta are somehow enhanced in calcium due to or prior to the explosion. As the MW1 models were produced through 1-D simulations, they do not include such mixing.
The helium envelopes of Shen & Moore (2014) can also contain freshly-formed calcium. We considered envelopes with a mass of 0.005, 0.01, and 0.02, none of which produce spectra that are a good match to SN 2011fe or any other SN Ia. We note that the 0.01 and 0.02 envelopes generate overly deep and extended calcium features; such features require correct handling of the Lorentzian wings and are not well approximated by tardis, but given that the spectra generated by these models are so different than observed spectra we rule these models out as possible explanations of SN Ia. An envelope with a mass near 0.008 or 0.09 may have the right abundance of calcium after the detonation to generate the observed HVF, though an envelope with a mass of 0.09 is likely excluded, as shells with such a high mass are likely to have a photosphere within the envelope at early epochs and result in an HVF that is too slow at later epochs. The calcium abundance as a function of the mass near 0.008 has a very steep slope of calcium abundance as a function of mass. While the models of MW1 and Shen & Moore (2014) are dynamically inconsistent, we take this an an indication that the mass of the envelope must be very fine-tuned to generate a calcium HVF that is comparable to those that have been observed. It is not clear why an envelope with such a finely-tuned mass would be favoured for that in which the detonation occurs. If this model is correct, identification of the ratio of calcium:helium required to generate the calcium HVF will provide a precise estimate of the mass of the envelope.
4 Conclusion
We have presented synthetic spectra at 2, 5, and 9 d after the explosion of a Type Ia supernova, generated using the Mulligan & Wheeler (2017) models of interaction between the supernova and a compact circumstellar shell using tardis (Kerzendorf & Sim, 2014). We apply abundance models to the shells that consist of either a hydrogen, helium, or carbon-oxygen substrate with overall solar abundance of metals and depletion or enhancement in the calcium abundance, as well as abundance models matching the yields of the Shen & Moore (2014) helium envelope detonation models for envelopes with a mass of 0.005, 0.01, and 0.02. We use a Seitenzahl et al. (2013) model N100 stable nuclide yield for abundances within the ejecta, with variations in the calcium abundance to adjust for using an explosion model (Gamezo et al. (2005) model ‘c’) that groups nucleosynthetic products into five groups (carbon, oxygen, magnesium, silicon, and iron).
We find that solar to super-solar abundances of calcium may be required to generate a high-velocity feature in the calcium near-infrared triplet for models involving the hydrogen, helium, and carbon-oxygen substrates for the material within the shell. In all cases, the substrate leaves no imprint upon the spectra, although the models with a helium substrate require a greater enhancement of calcium than do the models with a hydrogen or carbon-oxygen. The apparent need for super-solar abundance of calcium may be in tension with the ubiquity of high-velocity features, though such an enhanced abundance may come about due to synthesis of calcium as part of the explosion, or by the concentration of calcium, e.g, via settling, or pre-explosion surface nucleosynthesis, prior to the explosion. Accretion of hydrogen or helium from a non-degenerate companion can lead to shell flashes on the surface of the progenitor white dwarf. Kato et al. (2018) present a recent study of this possibility as well as a review of previous modeling of the phenomena. Kato et al. (2018) conclude that accretion-fed shell flashes could build up a layer enhanced in silicon surmounted by a layer enhanced in calcium especially in the case of a white dwarf with mass very close to the Chandrasekhar limit. They suggest that expulsion of this freshly synthesized surface material could be the source of HVF, with the calcium HVF typically moving somewhat faster than the silicon HVF. If it could be established that this process were responsible for the common presence of HVF in SN Ia, it would point to a single degenerate progenitor evolution and a delayed-detonation explosion. The explanation for the apparent calcium enhancement may have more plebian explanations. Within our models, the super-solar abundance could also be a result of our assumption of the homogeneity of calcium within the shell, or approximations made within tardis regarding the ion- or excitation state of calcium.
The Shen & Moore (2014) models are extremely sensitive to the mass of the envelope in terms of generating spectra that are similar to those observed in SN 2011fe at equivalent epochs. An envelope of mass 0.005 does not contain calcium and therefore does not produce an HVF, but neither does it produce a Si ii HVF despite containing 22 per cent silicon. An envelope of mass 0.01 produces an excessively deep and extended (both in wavelength and temporally) CaNIR absorption feature. Our methods suggest than an envelope with a mass near 0.008 would likely produce a HVF that is similar to those that have been observed; however, the models considered in Mulligan & Wheeler (2017) and Shen & Moore (2014) are not consistent so we take this only as indication that the mass of the envelope must be finely-tuned rather than having this precise mass. In the lower mass envelopes, the helium:calcium ratio is extremely sensitive to the mass of the envelope, so the ratio that is required to generate the observed HVF would be useful to constrain the mass of the envelope should the helium-envelope detonation model be found to be the cause of SN Ia.
We have clearly not solved the question of the nature of the HVF and their common occurrence in SN Ia but have put many of the issues in a new context by computing detailed spectral models. As in MW1 and MW2, we emphasize that a successful model of the HVF must account for its evolution in time. Within the context of the shell model, it is somewhat difficult to precisely reproduce the strongly blended profile of the CaNIR line at 2 and 5 d after the explosion. A reasonable representation can be achieved by judicious choice of the calcium abundance in the ejecta and the shell. The precise shape of the feature may depend on details like departures from spherical symmetry that we do not address. We were unable to reproduce the spectral details at 9 d after the explosion, especially the distinct feature that corresponds to what is easily identified as the separate HVF at that epoch.
An initial primary motivation of this work was to try to identify the composition of the substrate in which the shell calcium resides. This would give especially important constraints on the progenitor system and the explosion mechanism. If the shell model is roughly correct, our models show that it is very difficult to determine the composition of the substrate of the high-velocity shell that carries the observable calcium. While there is no direct evidence for or against a helium substrate for the shell, our models suggest that a “helium-rich" shell needs to be composed of mostly calcium rather than helium at 9 d after the explosion to generate a HVF, with a caveat that this demand for a large mass fraction of calcium may be an artifact of the ionization and excitation physics in tardis. If we take this result at face value, it is strongly suggestive that the material responsible for the calcium HVF is not helium rich.
An important issue to consider is whether there are other, weaker features that appear in the vicinity of the CaNIR line. Some of our models display a small dip around 7800 Å. This feature is probably a weaker line of some element in the ejecta and hence associated with the PVF, but it appears in the rough vicinity of the HVF of CaNIR. This feature could also be a reflection of the particular structure of the calcium abundance in our models. In any case, analysis of the HVF of CaNIR calls for caution in regard to possible contamination by other lines.
The possibility of contaminating lines raises another, more radical possibility, the issue of whether the HVF are truly real. Could the HVF be evidence of other, weaker lines rather than evidence of calcium at high velocities? The easiest way to explain why HVF track the PVF but with a roughly constant displacement to higher velocity is that the features associated with the HVF are actually PVF. If this were the case for the CaNIR feature, what of other species in which HVF have been identified, e.g. silicon, oxygen, and iron? Could those also be weaker mis-identified photospheric features? If so, what are the implications for compositions, progenitors, and explosion dynamics?
Much more work is called for to understand the ubiquitous HVF. Other supernovae should be studied in depth as we do here for three epochs of data on SN 2011fe. Not all events that display HVF manifest them in exactly the same way as does SN 2011fe. Because they are known to be polarized, HVF need to be studied with 3D dynamical and radiative transfer models. More care should be given to the details of the ionization and excitation of calcium. Another issue is whether the HVF earlier than 8 d should be treated differently than those at later epochs. At the earlier epochs, the HVF may be blended with the PVF, so it can be challenging to distinctly identify each component. Our shell models give broadening that is distinctly non-Gaussian, so identifying HVF by Gaussian fitting remains questionable.
We have concentrated on shell models as a plausible place to begin. Other models could be explored in the same depth we have tried to bring, stressing that any successful model must reproduce the line profile and the evolution of the HVF and PVF with time. Progenitor models must account for the ubiquity of the HVF and should also account for the absence in 91bg-like events. The issue of whether 91bg-like events are or are not related to “typical” SN Ia and whether they can or cannot be produced with Chandrasekhar-mass models is of great interest. The fact that 91bg-like supernovae do not show HVF (the dog that did not bark in the night) (Silverman et al., 2015) may be an important clue that they are substantially different in some manner.
Another issue of great interest is the growing number of SN Ia that, like SN 2011fe, have data at very early times. Stritzinger et al. (2018) and Jiang et al. (2018) give summaries. Among SN Ia that otherwise are similar near and after peak light, some, like SN 2011fe, show an early rise scaling about as (but see Noebauer et al., 2017), early red colors, and relatively weak C ii; others show an early rise that is roughly linear in luminosity, early nearly constant blue colors, strong C ii, somewhat larger peak luminosity, slower declines, and are classified as 91T-like or Shallow Silicon in the characterization of Branch et al. (2006). Examples of this latter behavior are SN 2017cbv (Hosseinzadeh et al., 2017) and SN iPTF2016abc (Miller et al., 2018). Various mechanisms are suggested to account for this bi-modal behavior including interaction with a companion and nickel mixing, but a commonly considered possibility is interaction with nearby circumstellar material, the basis for our current investigation of HVF. While there is no firm evidence in favor of a given model, it is clear that the red/blue bifurcation in early properties could have some implication for understanding HVF and vice versa.
Given the ubiquity of the HVF, they should appear in both types of SN Ia, and they do (Silverman et al., 2015), although SN iPTF2016abc may be an exception (Miller et al., 2018). It cannot be so simple that the early blue events represent some sort of circumstellar interaction that produces or suppresses HVF. Neither is it clear that outward mixing of nickel could account for HVF in a straightforward way. It could be that ejecta/shell interaction is the common mechanism for HVF with compact shells, as considered here, not contributing significantly to early light and somewhat more extended shells contributing early blue light. On the contrary, it is difficult to see how nickel mixing could contribute to the red/blue bifurcation and still lead to ubiquitous HVF whether the mixing is nil or extensive.
As pointed out by Miller et al. (2018), pulsating delayed detonation models (Khokhlov, 1991) might provide a natural way to produce some nearby unbound material that could play a role in forming the HVF. Shell-burning pulsations on the surface of the progenitor (Kato et al., 2018) could generate HVF through explicit high-velocity composition structures, but it is unclear how this phenomenon would relate to the red/blue bifurcation. Consideration of ejecta/shell interaction still seems a fruitful path to understand HVF and perhaps the early red/blue distribution. The origin of appropriate shells should give crucial new understanding to the progenitor evolution and explosion mechanism of SN Ia.
Appendix A Solar-type abundance with helium substrate
A.1 2 days
Figure 16 shows the spectra that result from shells with a helium substrate, again using the N100+0 abundance model for the ejecta. A purely solar abundance of calcium in the shell is insufficient to generate the observed CaNIR HVF due to the calcium being more likely to be in a higher ionization state (e.g. Ca iii) because of the higher ionization potential of helium and associated lower electron density in the gas. For He-Solar+0.0 model, the CaNIR feature is almost entirely photospheric, lacking evidence of a HVF. Calcium enhancement in the shell of 1 dex above solar levels produces a weak calcium HVF, but an enhancement of 2 dex above the solar value results in a very strong calcium feature. Note that the solar and +1 dex models show the feature around 7800 Å that appeared in some of the hydrogen models (see Figure 3).
We have not attempted to generate a better fit for the shells with a helium substrate. We estimate that, for the N100+0 abundance model for the ejecta, a shell enhancement of about 1.3 dex will produce a reasonably good fit to the observed feature of SN 2011fe. Other than the CaNIR feature, the spectrum resulting from a shell with a helium substrate is identical to that of a shell with a hydrogen substrate, i.e. there are no helium absorption or emission features and the Ca ii H&K feature is unaffected by calcium within the shell.
A.2 5 days
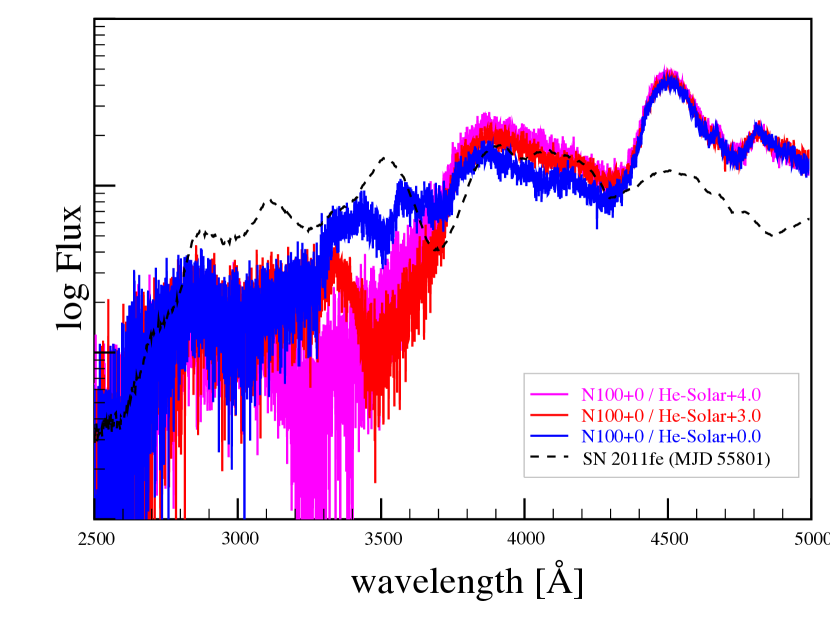
Figure 17 shows the synthetic spectra at 5 d for the shells with a helium substrate. For calcium abundances in the shell at up to 3 dex above a solar value there is no effect upon the CaNIR feature, although there is a small effect upon the Ca ii H&K feature, shown in the bottom panel of Figure 17. An enhancement of 4 dex above a solar value results in an extremely strong and extended CaNIR feature.
A.3 9 days
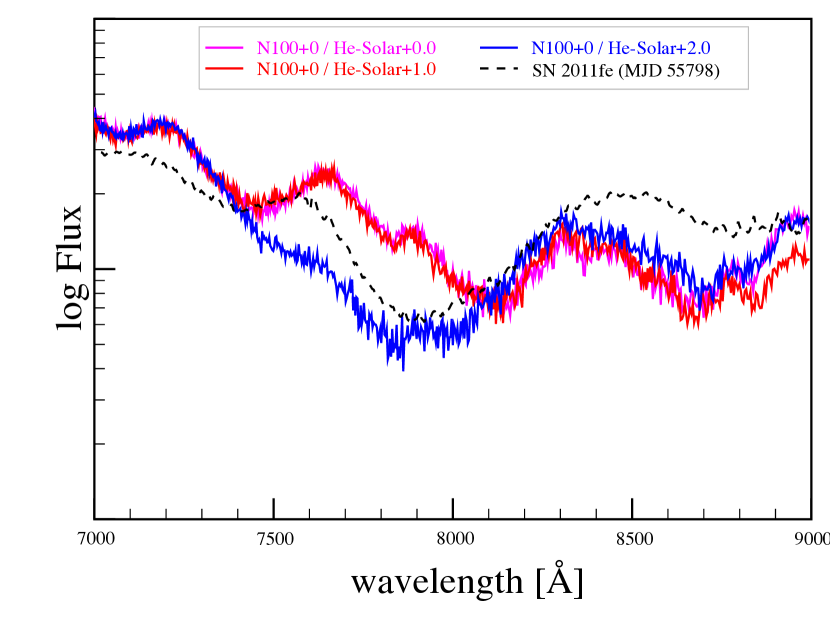
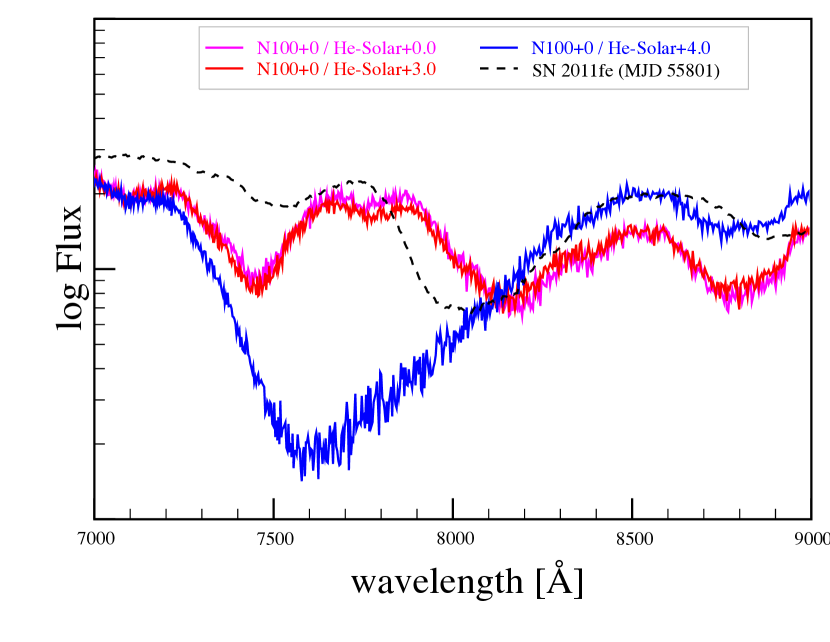
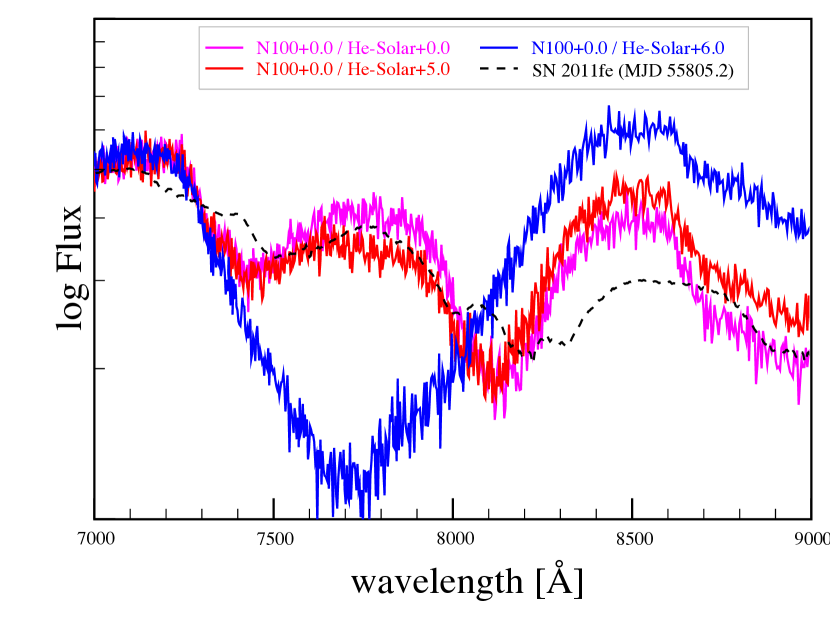
Figure 18 shows the synthetic spectra at 9 d for the helium substrate abundance models. At this epoch, the material within the shell requires an enhancement of over 5 dex above solar value in order to have a significant effect upon the CaNIR feature. Like the models with a hydrogen substrate, enhancement of calcium within the shell tends to produce an excessive HVF, though an enhancement of over 5 dex is required for this to occur with the helium substrate. The CaNIR PVF tends to be slightly too blue. There is no evidence of helium absorption or emission features at this epoch.
Appendix B Solar-type abundance with carbon-oxygen substrate
B.1 2 days
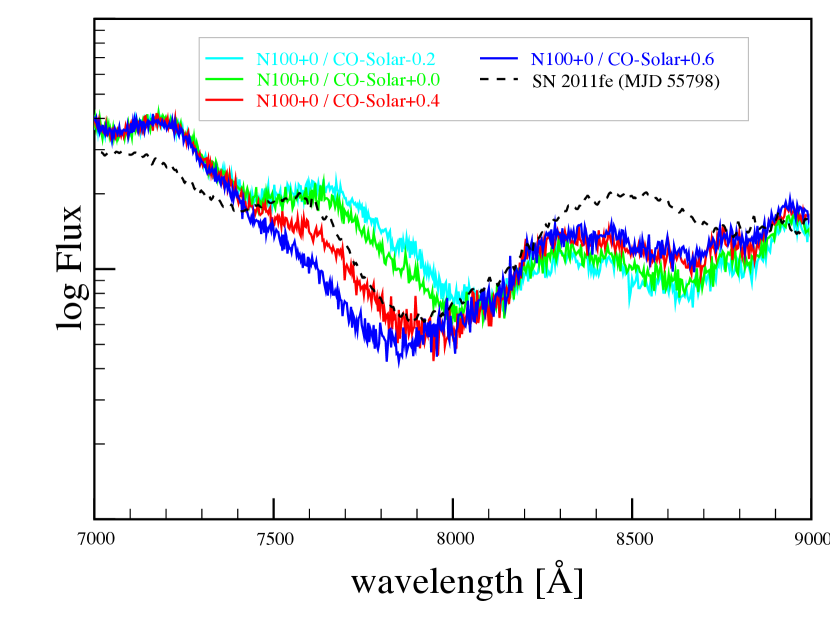
Figure 19 shows the spectra that result from shells with a carbon-oxygen substrate, again using the N100+0 abundance model for the ejecta. A purely solar abundance of calcium in the shell results in a feature that is similar to that observed in SN 2011fe. The models that include a carbon-oxygen substrate are nearly identical to those with a hydrogen substrate for the shell due to the similarity of ionization potential for hydrogen, carbon, and oxygen. Similar to the hydrogenic shell, a enhancement of about 0.4 dex of calcium in the shell relative to a solar abundance will result in a reasonably good fit to the observed feature of SN 2011fe. There is no evidence of any effect upon carbon or oxygen absorption features due to the carbon and oxygen in the shell at this epoch.
B.2 5 days
Figure 20 shows the synthetic spectra at 5 d for a shell with a carbon-oxygen substrate with an enhancement in calcium within the shell of 0 – 2 dex above solar value. For these models we see some evidence of a CaNIR HVF for all shells with solar abundance or more of calcium for the CaNIR feature. The CaNIR feature is clearly too strong for an abundance of 2 dex above a solar level of calcium. Like the models with a hydrogen substrate, the O i 7773 Å feature and Si ii 6355 Å features are too strong due to the ejecta and are unaffected by material in the shell.
At 0 – +1 dex of enhancement of calcium within the shell, the HVF tend to be weak and extended in range. For this composition of the ejecta, an enhancement of +2 dex of calcium within the shell causes excessive absorption. A color figure is available online.
B.3 9 days
Figure 21 shows the synthetic spectra at 9 d for the models with a carbon-oxygen substrate, focused on the CaNIR feature. At this epoch, the feature is only weakly affected by the calcium within the shell, as long as the enhancement of the calcium is less than 4 dex. At 5 dex of enhancement, an excessively strong HVF is produced. At a purely solar abundance of calcium within the shell, this model is indistinguishable from that of a hydrogen or helium substrate with an equivalent amount of calcium.
At 3 dex of calcium enhancement or less, the material within the shell has little to no effect on the CaNIR feature at this epoch; there is slight evidence of a HVF with an enhancement of 4 dex, and a strong HVF at an enhancement of 5 dex. A color figure is available online.
Acknowledgments
Thanks to Jeffrey Silverman, Jozsef Vinkó, and G. H. Marion for many discussions of HVF and to Ken Shen for a discussion of his models. We thank Harriet Dinerstein for information and discussion of post-main sequence nucleosynthesis and the effect on calcium abundance. We are also grateful to the referee for a cogent and helpful report that served to improve the manuscript. Brian W. Mulligan was supported in part by the Graduate School Summer Fellowship at the University of Texas at Austin. J. Craig Wheeler was supported in part by the Samuel T. and Fern Yanagisawa Regents Professorship in Astronomy and by NSF grant 1813825. K.-C. Zhang was supported by the China Scholarship Council (CSC, NO. 201706210140). This research made use of Tardis, a community-developed software package for spectral synthesis in supernovae. The development of Tardis received support from the Google Summer of Code initiative and from ESA’s Summer of Code in Space program. Tardis makes extensive use of Astropy and PyNE. For a current version of the code, see: https://zenodo.org/record/1292315.
References
- Asplund et al. (2009) Asplund M., Grevesse N., Sauval A. J., Scott P., 2009, ARA&A, 47, 481
- Blondin et al. (2013) Blondin S., Dessart L., Hillier D. J., Khokhlov A. M., 2013, MNRAS, 429, 2127
- Botyánszki et al. (2018) Botyánszki J., Kasen D., Plewa T., 2018, ApJ, 852, L6
- Branch et al. (2006) Branch D., et al., 2006, PASP, 118, 560
- Cardelli et al. (1989) Cardelli J. A., Clayton G. C., Mathis J. S., 1989, ApJ, 345, 245
- Childress et al. (2013) Childress M. J., et al., 2013, ApJ, 770, 29
- Childress et al. (2014) Childress M. J., Filippenko A. V., Ganeshalingam M., Schmidt B. P., 2014, MNRAS, 437, 338
- Gamezo et al. (2005) Gamezo V. N., Khokhlov A. M., Oran E. S., 2005, ApJ, 623, 337
- Gerardy et al. (2004) Gerardy C. L., et al., 2004, ApJ, 607, 391
- Guillochon et al. (2017) Guillochon J., Parrent J., Kelley L. Z., Margutti R., 2017, ApJ, 835, 64
- Hatano et al. (1999) Hatano K., Branch D., Fisher A., Baron E., Filippenko A. V., 1999, ApJ, 525, 881
- Hosseinzadeh et al. (2017) Hosseinzadeh G., et al., 2017, ApJ, 845, L11
- Jiang et al. (2018) Jiang J.-a., Doi M., Maeda K., Shigeyama T., 2018, preprint, (arXiv:1808.06343)
- Karakas & Lugaro (2016) Karakas A. I., Lugaro M., 2016, ApJ, 825, 26
- Kato et al. (2018) Kato M., Saio H., Hachisu I., 2018, ApJ, 863, 125
- Kerzendorf & Sim (2014) Kerzendorf W. E., Sim S. A., 2014, MNRAS, 440, 387
- Khokhlov (1991) Khokhlov A. M., 1991, A&A, 245, L25
- Maguire et al. (2014) Maguire K., et al., 2014, MNRAS, 444, 3258
- Marion et al. (2013) Marion G. H., et al., 2013, ApJ, 777, 40
- Mazzali et al. (2005) Mazzali P. A., et al., 2005, ApJ, 623, L37
- Mazzali et al. (2014) Mazzali P. A., et al., 2014, MNRAS, 439, 1959
- Miller et al. (2018) Miller A. A., et al., 2018, ApJ, 852, 100
- Mulligan & Wheeler (2017) Mulligan B. W., Wheeler J. C., 2017, MNRAS, 467, 778
- Mulligan & Wheeler (2018) Mulligan B. W., Wheeler J. C., 2018, MNRAS, 476, 1299
- Noebauer et al. (2017) Noebauer U. M., Kromer M., Taubenberger S., Baklanov P., Blinnikov S., Sorokina E., Hillebrandt W., 2017, MNRAS, 472, 2787
- Nugent et al. (2011) Nugent P. E., et al., 2011, Nature, 480, 344
- O’Donnell (1994) O’Donnell J. E., 1994, ApJ, 422, 158
- Parrent et al. (2012) Parrent J. T., et al., 2012, ApJ, 752, L26
- Patat et al. (2009) Patat F., Baade D., Höflich P., Maund J. R., Wang L., Wheeler J. C., 2009, A&A, 508, 229
- Pereira et al. (2013) Pereira R., et al., 2013, A&A, 554, A27
- Pignatari et al. (2016) Pignatari M., et al., 2016, ApJS, 225, 24
- Quimby et al. (2006) Quimby R., Höflich P., Kannappan S. J., Rykoff E., Rujopakarn W., Akerlof C. W., Gerardy C. L., Wheeler J. C., 2006, ApJ, 636, 400
- Schatzman (1958) Schatzman E. L., 1958, White dwarfs
- Seitenzahl et al. (2013) Seitenzahl I. R., et al., 2013, MNRAS, 429, 1156
- Shappee et al. (2013) Shappee B. J., Stanek K. Z., Pogge R. W., Garnavich P. M., 2013, ApJ, 762, L5
- Shen & Moore (2014) Shen K. J., Moore K., 2014, ApJ, 797, 46
- Silverman et al. (2015) Silverman J. M., Vinkó J., Marion G. H., Wheeler J. C., Barna B., Szalai T., Mulligan B. W., Filippenko A. V., 2015, MNRAS, 451, 1973
- Stritzinger et al. (2018) Stritzinger M. D., et al., 2018, preprint, (arXiv:1807.07576)
- Tanaka et al. (2006) Tanaka M., Mazzali P. A., Maeda K., Nomoto K., 2006, ApJ, 645, 470
- Thomas et al. (2004) Thomas R. C., Branch D., Baron E., Nomoto K., Li W., Filippenko A. V., 2004, ApJ, 601, 1019
- Wang & Wheeler (2008) Wang L., Wheeler J. C., 2008, ARA&A, 46, 433
- Wang et al. (2003) Wang L., et al., 2003, ApJ, 591, 1110
- Zhang et al. (2016) Zhang K., et al., 2016, ApJ, 820, 67
- Zhao et al. (2015) Zhao X., et al., 2015, ApJS, 220, 20
- Zhao et al. (2016) Zhao X., et al., 2016, ApJ, 826, 211