A Consistent Set of Empirical Scaling Relations for Spiral Galaxies: The – Relations
Abstract
Using the latest sample of 48 spiral galaxies having a directly measured supermassive black hole mass, , we determine how the maximum disk rotational velocity, (and the implied dark matter halo mass, ), correlates with the (i) black hole mass, (ii) central velocity dispersion, , and (iii) spiral-arm pitch angle, . We find that , significantly steeper than previously reported, and with a total root mean square scatter ( dex) similar to that about the – relation for spiral galaxies—in stark disagreement with claims that does not correlate with disks. Moreover, this – relation is consistent with the unification of the Tully–Fisher relation (involving the total stellar mass, ) and the steep relation observed in spiral galaxies. We also find that , consistent with past studies connecting stellar bulges (with ), dark matter halos, and a nonconstant ratio. Finally, we report that , providing a novel formulation between the geometry (i.e., the logarithmic spiral-arm pitch angle) and kinematics of spiral galaxy disks. While the – relation may facilitate distance estimations to face-on spiral galaxies through the Tully–Fisher relation and using as a proxy for , the – relation provides a path for determining dark matter halo masses from imaging data alone. Furthermore, based on a spiral galaxy sample size that is double the size used previously, the self-consistent relations presented here provide dramatically revised constraints for theory and simulations.
1 Introduction
Building on the possibility of unseen mass in the solar neighborhood (Jeans, 1922; Kapteyn, 1922; Lindblad, 1926; Oort, 1932), dark matter has been considered by many astronomers to be prevalent in galaxy clusters since the 1930s (Zwicky, 1933; Smith, 1936; Zwicky, 1937; Schwarzschild, 1954; Rood, 1965). In addition, the study of galaxy rotation curves provided strong evidence for the existence of dark matter (Babcock, 1939; Oort, 1940; Freeman, 1970; Rubin & Ford, 1970; Rogstad & Shostak, 1972; Roberts & Rots, 1973; Rubin et al., 1977, 1978; Krumm & Salpeter, 1979; Rubin et al., 1980; Bosma, 1981; Persic & Salucci, 1988; Broeils, 1992). The notion of nonbaryonic dark matter subsequently grew as a mechanism to explain this anomalous gravitational phenomenon (Gershtein & Zel’dovich, 1966; Marx & Szalay, 1972; Cowsik & McClelland, 1972; Szalay & Marx, 1976). Intriguingly, dark matter is believed to account for of the total mass in the universe (Planck Collaboration et al., 2018), but it remains elusive despite considerable efforts to achieve direct instrumental detection of its theorized particles (e.g., Tan et al., 2016; Akerib et al., 2017; Aprile et al., 2018).111See Seigar (2015), Arcadi et al. (2018), Hooper (2018), and Salucci (2019) for reviews on searches for dark matter. The concept of supermassive black holes (SMBHs) lurking in the center of galaxies has also had an interesting history of study (see Kormendy & Richstone, 1995; Longair, 1996, 2006; Ferrarese & Ford, 2005, for reviews on SMBHs). It was in a spiral galaxy, our Milky Way, where an SMBH (Sagittarius A*) was first calculated to exist (Lynden-Bell, 1969; Sanders & Lowinger, 1972). For half a century, confidence in its existence gradually increased from suggestion to certainty (see Alexander 2005 and Genzel et al. 2010 for reviews on Sagittarius A*), with modern measurements (Gravity Collaboration et al., 2018a, b; Amorim et al., 2019) even detecting the effects of general relativity (Einstein, 1916; Schwarzschild, 1916; Kerr, 1963; Bardeen et al., 1972) in its vicinity, and providing direct imaging via very long baseline interferometry (Issaoun et al., 2019).222See also the revolutionary imaging of the central SMBH in M87 (Event Horizon Telescope Collaboration et al., 2019). In contrast to dark matter, SMBHs residing at the centers of galaxies are thought to constitute a tiny fraction of the universe’s total mass (Graham et al., 2007; Vika et al., 2009; Davis et al., 2014; Mutlu-Pakdil et al., 2016).
Astronomers have long been comfortable with the idea that SMBH masses () should correlate with properties of their host galactic bulges, as evidenced by a vast literature dedicated to the study of correlations with a bulge’s stellar velocity dispersion (), (baryonic and total) mass, stellar luminosity, Sérsic index, etc. (see Graham, 2016, for a review), although many theoretical models advocate that the total gravitational mass of a galaxy or its most dominant component, the mass of its dark matter halo (), should dictate the formation of SMBHs (e.g., Loeb & Rasio, 1994; Haehnelt et al., 1998; Silk & Rees, 1998; Cattaneo et al., 1999; Haehnelt & Kauffmann, 2000; Monaco et al., 2000; Adams et al., 2001). The rotation curve informs us about the total mass of a disk galaxy and its dark matter component. Therefore, the rotational velocity profile of a galaxy disk, , can be considered a surrogate333Globular clusters have also been shown to be apropos tracers of the dark matter halo mass; both the globular cluster system mass (Spitler & Forbes, 2009) and the number of globular clusters (Burkert & Forbes, 2019) of a galaxy are directly proportional to its dark matter halo mass. for its . Thus, a relation between and some measure of or should be expected in observational data.
Recently, we showed in Davis et al. (2018) that a significant correlation exists between the total stellar mass () of a spiral galaxy and the mass of its central black hole. When combined with the well-known Tully & Fisher (1977) relation between the total stellar luminosity/mass of a galaxy and its rotational velocity, one obtains a relation between and . A contemporary study by Tiley et al. (2019) has defined the Tully–Fisher relation between and for late-type galaxies444If we calculate the Tully–Fisher relation from our dataset, we find that , which is consistent with Equation (1) at the level of . to be such that
| (1) |
In Davis et al. (2018), we found that
| (2) |
for spiral galaxies. Therefore, we should expect to find
| (3) |
which can subsequently be converted into an – relation using an expression from Katz et al. (2019) between and .
In addition to our focus on black hole mass scaling relations for spiral galaxies in this work, we also investigate scaling relations between (and ) with both and the logarithmic spiral-arm pitch angle (). A – ratio or relation for disk galaxies was first suggested by Whitmore et al. (1979) and Whitmore & Kirshner (1981). They found by measuring Hi line widths for local S0 and spiral galaxies. More recently, Cresci et al. (2009) found that gas-rich, turbulent, star-forming disk galaxies exhibit .555The dynamics of newly assembled massive objects (DYNAMO) project (Green et al., 2010, 2014; Bassett et al., 2014) demonstrated that their more local () sample of galaxies, selected to have high star-formation rates, are analogs of turbulent disk galaxies, with similar ratios. The – relation represents an intriguing connection between the stellar bulge of a galaxy and its dark matter halo, although for spiral galaxies with turbulent disks, may trace the stellar disk as much as the bulge. As a result, regular study of the – relation has persisted for 40 yr. We contribute to this legacy with our refinement of the – relation and an original quantification of the – relation based on the – expression in Katz et al. (2019).
As for the connection with the logarithmic spiral-arm pitch angle, Kennicutt (1981) and Kennicutt & Hodge (1982) presented an observational study of the shape of spiral arms and showed that the maximum rotational velocity of a galaxy disk, , correlated with the spiral-arm pitch angle. They found a definitive anticorrelation, such that galaxies with higher have lower , i.e., more tightly wound spiral patterns. Their tantalizing empirical result suggests that the trend of shapes across the spiral sequence of galaxies is partly kinematic in origin. We will use our measured pitch angle values from Davis et al. (2017) to quantify this – (and –) relation, and compare the scatter with other relations involving .
In this work, we shall endeavor to determine scaling relations from our (currently) complete sample of spiral galaxies with directly measured black hole masses. In Section 2, we describe our compilation of , , , and measurements and detail our conversion of into . Section 3 provides our regression analyses and discussion for six relations: –, –, –, –, –, and –. Finally, Section 4 presents our interpretation of the results and elucidates their significance. All printed uncertainties are () confidence intervals. All magnitudes are quoted in the Vega system.
2 Data
In Davis et al. (2017), we compiled a comprehensive sample of 44 galaxies classified as spirals and having directly measured (dynamical)666We include direct, dynamical (not including upper or lower limit) measurements derived from stellar proper motions, stellar dynamics, gas dynamics, or maser emission. We do not include black hole masses estimated via reverberation mapping, which is calibrated to the – relation (e.g., Onken et al., 2004; Peterson et al., 2004; Graham et al., 2011). black hole masses (see Table 1). In Davis et al. (2018, 2019), we used this sample to determine how the black hole mass of a spiral galaxy scales with its total stellar and bulge stellar masses, respectively. Here, we use the same sample, plus four new galaxies (NGC 613, NGC 1365, NGC 1566, and NGC 1672) from Combes et al. (2019), making our total sample of spiral galaxies with directly measured black hole masses twice the size of recent studies (e.g., Sabra et al., 2015). For this expanded sample, we tabulate the and measurements (predominantly from Davis et al., 2017), plus the measurements that we have assembled from the literature. We use this rotational velocity to draw a connection to the dark matter halo mass, which dictates the maximum rotational velocity at the outer radii of a galaxy. As revealed in Davis et al. (2017), particular care was taken to obtain the fundamental spiral-arm pitch angle rather than the harmonics, which may be a factor of two or three smaller or larger and are accidentally obtained when an insufficiently long section of spiral arms is used.
| Galaxy | Bar? | Reference | ||||||||||
|---|---|---|---|---|---|---|---|---|---|---|---|---|
| (deg) | (km s-1) | (km s-1) | (deg) | |||||||||
| (1) | (2) | (3) | (4) | (5) | (6) | (7) | (8) | (9) | ||||
| Circinus (catalog ) | Courtois et al. (2009) | 66.9 | ||||||||||
| Cygnus A (catalog )aaCygnus A has been questionably classified as a spiral galaxy; it resembles a dusty early-type galaxy, although with nuclear spiral arms. | ||||||||||||
| ESO 558-G009 (catalog ) | ||||||||||||
| IC 2560 (catalog ) | HyperLeda | 65.6 | ||||||||||
| J0437+2456 (catalog SDSS J043703.67+245606.8) | ||||||||||||
| Milky Way (catalog ) | bbThe outermost circular velocity (at a Galactocentric radius of kpc) from Eilers et al. (2019). | Eilers et al. (2019) | ccCompare with the recent measurement of from Eilers et al. (2019) for the Galaxy. | |||||||||
| Mrk 1029 (catalog ) | ||||||||||||
| NGC 0224 (catalog ) | HyperLeda | 72.2 | ||||||||||
| NGC 0253 (catalog ) | HyperLeda | 75.3 | ||||||||||
| NGC 0613 (catalog ) | ddBlack hole mass derived from dynamical gas measurements by Combes et al. (2019), who report on Atacama Large Millimeter/submillimeter Array observations of molecular tori around active galactic nuclei. | eeNew pitch angle measurement using 2dfft (Davis et al., 2012, 2016), spirality (Shields et al., 2015a, b), and/or sparcfire (Davis & Hayes, 2014) software packages. | ffFrom the HyperLeda database (Paturel et al., 2003), accessed 2018 December. | HyperLeda | 35.7 | |||||||
| NGC 1068 (catalog ) | HyperLeda | 37.2 | ||||||||||
| NGC 1097 (catalog ) | HyperLeda | 48.4 | ||||||||||
| NGC 1300 (catalog ) | Mathewson et al. (1992) | 49.6 | ||||||||||
| NGC 1320 (catalog ) | HyperLeda | 65.8 | ||||||||||
| NGC 1365 (catalog ) | ddBlack hole mass derived from dynamical gas measurements by Combes et al. (2019), who report on Atacama Large Millimeter/submillimeter Array observations of molecular tori around active galactic nuclei. | eeNew pitch angle measurement using 2dfft (Davis et al., 2012, 2016), spirality (Shields et al., 2015a, b), and/or sparcfire (Davis & Hayes, 2014) software packages. | ffFrom the HyperLeda database (Paturel et al., 2003), accessed 2018 December. | HyperLeda | 62.6 | |||||||
| NGC 1398 (catalog ) | HyperLeda | 47.7 | ||||||||||
| NGC 1566 (catalog ) | ddBlack hole mass derived from dynamical gas measurements by Combes et al. (2019), who report on Atacama Large Millimeter/submillimeter Array observations of molecular tori around active galactic nuclei. | ggFrom Davis et al. (2014). | ffFrom the HyperLeda database (Paturel et al., 2003), accessed 2018 December. | Mathewson & Ford (1996) | 47.9 | |||||||
| NGC 1672 (catalog ) | ddBlack hole mass derived from dynamical gas measurements by Combes et al. (2019), who report on Atacama Large Millimeter/submillimeter Array observations of molecular tori around active galactic nuclei. | eeNew pitch angle measurement using 2dfft (Davis et al., 2012, 2016), spirality (Shields et al., 2015a, b), and/or sparcfire (Davis & Hayes, 2014) software packages. | hhFrom Garcia-Rissmann et al. (2005). | HyperLeda | 28.2 | |||||||
| NGC 2273 (catalog ) | HyperLeda | 50.1 | ||||||||||
| NGC 2748 (catalog ) | Erroz-Ferrer et al. (2015) | 52.9 | ||||||||||
| NGC 2960 (catalog ) | HyperLeda | 51.5 | ||||||||||
| NGC 2974 (catalog ) | HyperLeda | 48.1 | ||||||||||
| NGC 3031 (catalog ) | HyperLeda | 54.4 | ||||||||||
| NGC 3079 (catalog ) | HyperLeda | 75.0 | ||||||||||
| NGC 3227 (catalog ) | Haynes et al. (2018) | 59.3 | ||||||||||
| NGC 3368 (catalog ) | HyperLeda | 46.2 | ||||||||||
| NGC 3393 (catalog ) | Courtois et al. (2009) | 31.8 | ||||||||||
| NGC 3627 (catalog ) | HyperLeda | 59.2 | ||||||||||
| NGC 4151 (catalog ) | iiFrom Onken et al. (2014). | Mundell et al. (1999) | 46.7 | |||||||||
| NGC 4258 (catalog ) | HyperLeda | 63.3 | ||||||||||
| NGC 4303 (catalog ) | HyperLeda | 32.3 | ||||||||||
| NGC 4388 (catalog ) | HyperLeda | 71.6 | ||||||||||
| NGC 4395 (catalog ) | Haynes et al. (2018) | 47.7 | ||||||||||
| NGC 4501 (catalog ) | HyperLeda | 62.9 | ||||||||||
| NGC 4594 (catalog ) | jjApparent maximum stellar rotation velocity of the disk-like component of this dual morphology galaxy (see Gadotti & Sánchez-Janssen, 2012). | HyperLeda | 47.9 | |||||||||
| NGC 4699 (catalog ) | HyperLeda | 42.6 | ||||||||||
| NGC 4736 (catalog ) | HyperLeda | 31.8 | ||||||||||
| NGC 4826 (catalog ) | HyperLeda | 55.2 | ||||||||||
| NGC 4945 (catalog ) | HyperLeda | 77.0 | ||||||||||
| NGC 5055 (catalog ) | Flores et al. (1993) | 52.5 | ||||||||||
| NGC 5495 (catalog ) | HyperLeda | 32.8 | ||||||||||
| NGC 5765b (catalog ) | HyperLeda | 49.1 | ||||||||||
| NGC 6264 (catalog ) | ||||||||||||
| NGC 6323 (catalog ) | ||||||||||||
| NGC 6926 (catalog ) | HyperLeda | 78.1 | ||||||||||
| NGC 7582 (catalog ) | HyperLeda | 64.3 | ||||||||||
| UGC 3789 (catalog ) | HyperLeda | 43.2 | ||||||||||
| UGC 6093 (catalog ) | Haynes et al. (2018) | 23.2 | ||||||||||
Note. — Column (1): galaxy name. Column (2): indicates (with a checkmark) whether the galaxy exhibits a barred morphology. Column (3): black hole mass listed in Davis et al. (2017, 2019), compiled from references therein. Column (4): logarithmic spiral-arm pitch angle (face-on, absolute value in degrees) from Davis et al. (2017). Column (5): central ( kpc) stellar velocity dispersion listed in Davis et al. (2017), compiled from references therein (HyperLeda values have been updated as of December 2018). Column (6): maximum rotational velocity of the galaxy disk (Equation (4)). Column (7): reference for maximum rotational velocity. Column (8): inclination angle (from the reference in Column (7), if available) used to correct the observed rotational velocity via Equation (4). Column (9): dark matter halo mass from Equation (1); their errors should be considered minimum estimates due to lack of an intrinsic scatter measurement from Katz et al. (2019) for Equation (1).
Forty-two galaxies out of our total sample of 48 galaxies have measurements in the literature. These are mostly (29 out of 42) from the HyperLeda database777http://leda.univ-lyon1.fr/ (Paturel et al., 2003), which provides homogenized maximum rotational velocities calculated from the 21 cm line maximum widths () or available rotation curves (generally H rotation curves). These velocities are derived from the observed line-of-sight velocities (), after correcting for inclination (), such that
| (4) |
The internal orbital velocity for a galaxy at a given radius can be used to estimate the mass of the galaxy interior to that radius; this mass is the sum of the baryonic and nonbaryonic (i.e., dark matter) masses. At the outer regions of a galaxy, the gravitational potential is thought to be dominated by the dark matter halo (but see Milgrom 1983 and McGaugh & Schombert 2015), for which the maximum rotational velocity is a proxy.
For our conversions from into , we consulted the recent work of Katz et al. (2019), who determined – relations from the Spitzer Photometry and Accurate Rotation Curves (SPARC) sample gas and stellar mass models (Lelli et al., 2016) and employed the Markov chain Monte Carlo simulations from Katz et al. (2017) to empirically determine halo masses. Katz et al. (2019) present evidence that a variety of rotational measurements are capable of accurately predicting dark matter halo masses in spiral galaxies. They explored many of the standard measurements: (i) , the rotational velocity along the flat portion of a rotation curve, (ii) , the rotational velocity at 2.2 disk scale lengths, (iii) , the rotational velocity at the effective half-light radius of a galaxy, and (iv) . Katz et al. (2019) presented empirical relations for the –, –, –, and – relations from a sample of 120 late-type galaxies with rotational velocity measurements and dark matter halo masses estimated using the Di Cintio et al. (2014a) halo profile. Their halo profile model is derived from cosmological galaxy formation simulations, which account for baryonic processes affecting their host dark matter halos (Di Cintio et al., 2014a, b; Artale et al., 2019), unlike cosmological dark matter-only simulations (Navarro et al., 1996).888Katz et al. (2019) also compared their results with halo masses derived from the Navarro et al. (1996) halo profile, but found poor results owing to “the cusp-core problem” for galaxies with slowly rising rotation curves (de Blok et al., 2001; de Blok & Bosma, 2002; Gentile et al., 2004; Kuzio de Naray et al., 2006, 2008, 2009; Katz et al., 2017). Katz et al. (2019) argue that tight relations between all of these choices for rotational velocity indicate that the kinematics of a late-type galaxy, at radii much smaller than its virial radius,999Katz et al. (2019) note that is generally measured at a radius farther out than the typical measurement radii of , , or , where the halo influence dominates the rotation curve. Even at the radius () where is measured, they deduce that (on average) of a halo mass is external to . can be reliably used to estimate its halo mass.
Based on their sample of 120 late-type galaxies, they concluded that all of these different measures produce consistent results. We have elected to use due to its ubiquity in published extragalactic Hi source catalogs. Additionally, we assume that is an accurate tracer of the circular velocity () for spiral galaxies at large radii (i.e., ). We employ the – relation from Katz et al. (2019), which is such that
{IEEEeqnarray}rCl
log(MDMM☉) & = (2.439±0.196)log(vmax138 km s-1)
+ (11.552±0.108),
with total root mean square (rms) scatter dex101010Katz et al. (2019) find an equivalent level of scatter ( dex in ) for the baryonic Tully–Fisher relation (Freeman, 1999; Walker, 1999; McGaugh et al., 2000) derived from the same sample of galaxies. in the direction.111111Because they used an unnormalized value of by Katz et al. (2019), the error on their intercept at is elevated through the inflated covariance between the slope and intercept (Tremaine et al., 2002). In Equation (1), we have estimated a normalization constant of 138 km s-1 with an associated intercept of from the upper right panel of Figure 2 in Katz et al. (2019). We apply Equation (1) to the values (Table 1, Column (6)) and list the derived dark matter halo masses in Table 1, Column (9).
3 Analysis and Discussion
3.1 The – Relation
The correlation between and suggests a relationship between the dark matter halo and the stellar bulge of a galaxy, at least for galaxies with bulges. Ferrarese (2002) initially presented an empirical – relation involving 38 spiral galaxies. Baes et al. (2003) followed up this work by adding a dozen spiral galaxies and found a consistent, tight correlation. Pizzella et al. (2005) then argued that the – relation is different for high- and low surface brightness galaxies, while Ho (2007, and later ) showed from a large sample of 792 galaxies with diverse morphological types that the – relation varies significantly for subsamples based on morphology. Courteau et al. (2007) subsequently showed that massive galaxies scattered about a relation (see Serra et al., 2016, who found for early-type galaxies) and pure disks obeyed , and they advocated that a trivariate relationship with total light concentration was needed to properly model the data.
Here, we produce a – relation for the 40 spiral galaxies with both and measurements (not including NGC 4395). Knowing , this relation can be used to estimate , and indirectly predict (through Equation (1)); this is useful for galaxies with velocity dispersion measurements that lack reliable rotational velocity measurements (e.g., nearly face-on disk galaxies). The bces bisector regression (Akritas & Bershady, 1996; Nemmen et al., 2012)121212https://github.com/rsnemmen/BCES yields
{IEEEeqnarray}rCl
log(vmaxkm s-1) & = (0.65±0.10)log(σ0141 km s-1)
+ (2.34±0.01),
with dex and intrinsic scatter131313Calculated through Equation (1) from Graham & Driver (2007). dex, both in the direction (see Figure 1).
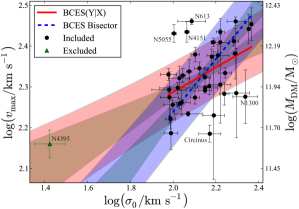
Except for NGC 4395, it is apparent from inspection of Figure 1 that five galaxies (Circinus, NGC 613, NGC 1300, NGC 4151, and NGC 5055) are mild outliers, noticeably outside the () scatter band. Of these five galaxies, two galaxies (NGC 1300 and NGC 5055) are outliers. Davis et al. (2018) note that NGC 1300 is an outlier in the – diagram for spiral galaxies, with either an overmassive black hole or a low total stellar mass, which is matched here by either a low or a high . Davis et al. (2017) pointed out that NGC 5055 is an outlier in the – diagram for spiral galaxies, with either an overmassive black hole or a low central stellar velocity dispersion.
Our dataset can be described by a Pearson correlation coefficient , and a -value probability equal to that the null hypothesis is true. The Spearman rank-order correlation coefficient , with that the null hypothesis is true. However, the slope of the – relation is inconsistent with a value of 1 at the level. That is, is not a constant ratio. We do, however, acknowledge that the – relation may be bent or curved, but we require more data with to see this. We find that the slope of our – relation is shallower than but consistent with the – slope () from Ferrarese (2002) for 38 spiral galaxies; the slope () from Pizzella et al. (2005) for 40 high surface brightness disk galaxies, eight giant low surface brightness galaxies, and 24 elliptical galaxies; and the slope () from Kormendy & Bender (2011) for 30 spiral galaxies, which are a subset of the Ferrarese (2002) sample; at the levels of , , and , respectively.
Our sample selection of only galaxies with dynamically estimated black hole masses does appear to have resulted in a selection bias, artificially truncating data such that we have a deficit of galaxies with (as seen in Figure 1). Lynden-Bell et al. (1988, their Figure 10) discuss this problem and present a solution by modifying the type of linear regression. By using a regression of on , i.e., the bces(YX) routine that minimizes the residuals in the Y-direction, we can generate a relation that is less strongly affected by this bias. Doing so, we find
{IEEEeqnarray}rCl
log(vmaxkm s-1) & = (0.30±0.11)log(σ0141 km s-1)
+ (2.33±0.01),
with dex and dex, both in the direction (see Figure 1).
Indeed, it is prudent to show concern for possible selection bias. Batcheldor (2010) pointed out that a false – relation can be obtained from galaxies with randomly assigned black hole masses by imposing a spatial resolution cutoff to censor unresolvable spheres of influence. Thus, it is important to be cautious about unobserved data in samples of spiral galaxies with dynamical black hole mass estimates. However, it is also possible that the – relation breaks down for small galaxies. For example, Courteau et al. (2007, see their Figure 1) show that the – relation only holds for galaxies with and , and they attribute the breakdown for smaller galaxies to less certain rotational and dispersion estimates due to amplified gas turbulence, velocity anisotropy, and measurement errors.
3.1.1 Pseudobulges
Galaxies that allegedly contain pseudobulges141414See Fisher & Drory (2016) for a review, summarizing the observed properties of pseudobulges and classical bulges, and see Graham (2015) for concerns with identifying pseudobulges, splitting what may be a bulge continuum, and galaxies hosting both types of bulge (see Izquierdo-Villalba et al., 2019, for semianalytical models of galaxy formation yielding composite bulges). Equally concerning, Costantin et al. (2018) assess that bulge classification is difficult with any observational diagnostic other than their intrinsic three-dimensional shape; classical bulges appear as thick oblate spheroids, with pseudobulges distinguishable by their relative disk-like flattening. constitute the bulk of our sample (i.e., 36 out of 42; Davis et al., 2017). For local () galaxies, the central stellar velocity dispersion is primarily a measurement of the kinematics of the bulge; however, for those galaxies with only pseudobulges or small bulges, the kinematics of the bar and disk will contribute in a higher proportion than the weak contribution in galaxies with large classical bulges (Courteau et al., 2007).151515Similarly, the use of (the velocity dispersion within the effective half-light radius of a galaxy) is not desirable because it is heavily biased by any bar or disk in the galaxy. Hartmann et al. (2014) show that the central is not only but rather due to contamination by the disk, which increases with disk inclination. When a classical bulge does not dominate, it is important to take into account the disk, the effect of gas (whereas the gas is negligible in massive galaxies and ellipticals), the bar orientation,161616Bars, when viewed from an end-on orientation, may exhibit a small secondary biasing effect. Sight-lines down the major axis of a bar should elevate the observed , and thus more edge-on disks would have higher values if the bar were additionally positioned in the right way within the disk plane for this sight-line to occur. the spectral line used for the measurement,171717Harris et al. (2012) point out that the spectral line used for the measurement of can bias the result by as much as . the rotation,181818Spectroscopic measurements of velocity dispersion through a fixed aperture do not yield reliable estimates for the true of a galaxy due to contamination from galactic rotation (Taylor et al., 2010; Bezanson et al., 2011; van Uitert et al., 2013; Hasan & Crocker, 2019). Kang et al. (2013) address the problem of rotation contaminating the measurement and try to remove the rotation and isolate the true with small apertures. They report consistent values from the optical and near-infrared absorption lines, but find that a rotation component can cause to vary by up to in a single-aperture spectrum. and the inclination. These complications are beyond the scope of this project; however, we might suspect a dependency on inclination for our sample, especially for the galaxies with the lowest observed values, where disk star contamination (if present) will be fractionally more noteworthy. An additional investigation of the bar strength is beyond the desired scope of this work; however, a significant follow-up study might garner further insight. For example, NGC 613 and NGC 1300 (both classical barred galaxies) are prominent outliers in Figure 1, suggesting that their bars might have significantly altered the kinematics of these galaxies.
Graham et al. (2011) demonstrate that the scatter in the – diagram can be mitigated by fitting an offset relation for barred galaxies. For pseudobulges built from bars, the “bulge” is very flattened, and the velocity dispersion is anisotropic, much larger in the horizontal direction than in the vertical direction. Bellovary et al. (2014) specifically treat this anisotropic issue, and show that increased inclination not only produces an elevated scatter at the low-mass end of the – relation, but also introduces a bias, to increase globally both the average and the median value above the true , which tends to show an offset – relation for disky galaxies. This bias applies not just to barred galaxies but all to spiral galaxies because all spiral galaxies will likely possess a bar at some point in their life. Sheth et al. (2008) describe the development of a bar as an indicator of maturity, although bars may be recurrent and therefore not a sign of either maturity or immaturity.
In consideration of the effects of inclination, we have investigated vs. and found no correlation. We do, however, note that some galaxies have uncharacteristically low values. For instance, NGC 253 (the Sculptor galaxy) has , but it is a bulgy, massive, and inclined () galaxy. Perhaps some explanation for this galaxy can be obtained by considering that NGC 253 is a prototypical starburst galaxy (Watson et al., 1996; Kornei & McCrady, 2009; Leroy et al., 2018; Mangum et al., 2019; Martín et al., 2019; Takano et al., 2019). As a result, may depend on the age of the stars: when there is gas, young stars can form from the gas, strongly weight the optical spectrum, and “cool” the stellar component.191919This is contrary to a collision-less simulation, where the stellar component only heats up. This process in the disk can contribute to the measurement of , leading to a small -drop at the center of a galaxy and could explain why is low for NGC 253 and other star-forming galaxies. Indeed, other prominent starburst galaxies display this behavior. The ratios of NGC 253 and three other prominent star-forming galaxies, IC 342, NGC 2146, and NGC 6946 (see Gorski et al., 2018, and references therein), are all elevated with , , , and (all from HyperLeda), respectively. Moreover, the bar in NGC 253 is not end-on but inclined (if not completely side-on), reducing its effect on .
The widespread presence of low- to medium-luminosity, active galactic nuclei (AGNs) in spiral galaxies (e.g., Beifiori et al., 2009; Jiang et al., 2011; Xiao et al., 2011) indicates that the efficient growth of SMBHs through the accretion of gas is prevalent. It is evident that secular processes in disk galaxies play a key role in the development of SMBHs (Cisternas et al., 2011; Schawinski et al., 2011, 2012; Araya Salvo et al., 2012; Kocevski et al., 2012; Simmons et al., 2012; Treister et al., 2012; Debattista et al., 2013; Zubovas & King, 2019). Nuclear bars have been theorized to drive gas inflows into the center, feeding black holes (e.g., Shlosman et al., 1989, 1990; Hopkins & Quataert, 2010). Du et al. (2017, see also ) considered the effect of an SMBH on a nuclear bar, showing that nuclear bars are destroyed at lower SMBH masses than the large-scale bars in their simulations. Specifically, they found that embedded bars are quickly dissolved when , halting the inner-bar-driven gas-feeding mechanism. For comparison, we find that for the subsample of 35 pseudobulge spiral galaxies in Davis et al. (2018), the median ratio is is approximately an order of magnitude lower, .
The central velocity dispersion is enhanced by the presence of a bar, ultimately leading to slightly higher values of in barred galaxies than in unbarred galaxies. Hartmann et al. (2014) conducted simulations, showing that bar growth heats the disk, forms the bulge, and concentrates the mass,202020The bar strength is not necessarily a clear indicator of mass concentration, as a galaxy could have already passed its maturity, concentrated its mass, and its once strong bar could now appear weakened or have disappeared. therefore the mass evolution increases the central velocity dispersion,212121The simulations of Hartmann et al. (2014) show that the formation of a bar yields an elevated even when viewing the disk face-on. This suggests a connection with out-of-plane buckling that leads to peanut shell-shaped structures (Burbidge & Burbidge, 1959; de Vaucouleurs, 1974; Illingworth, 1983; Jarvis, 1986; Combes et al., 1990; Bureau & Freeman, 1999; Lütticke et al., 2000a, b; Patsis et al., 2002; Buta et al., 2007; Athanassoula, 2016; Ciambur & Graham, 2016) that are more readily visible in edge-on spiral galaxies, but are also recognizable in more face-on systems (Laurikainen et al., 2011, 2013, 2014, 2015, 2018; Erwin & Debattista, 2013; Athanassoula et al., 2015; Buta et al., 2015; Laurikainen & Salo, 2016, 2017; Herrera-Endoqui et al., 2017; Salo & Laurikainen, 2017a, b; Saha et al., 2018). The bar or peanut shell shape may also increase the vertical dispersion of the disk, in addition to the bar, but this is a small effect considering the great streaming in the disk. Therefore, if Hartmann et al. (2014) see an effect for , it is more likely due to the concentration of the mass in the center and the global heating than due to the peanut shell shape. Moreover, when gas is present, there is a diminished box or peanut shell-shape effect; the presence of a large gas fraction tends to weaken or destroy the peanut shell shape. which causes barred galaxies to move to higher velocity dispersions in the – diagram. However, their simulations did not include gas (see Seo et al., 2019), which meant that gas was not present to possibly form new stars (cooling the stellar component and decreasing ) or fuel SMBHs in their galaxies (increase ). From complementary simulations, Brown et al. (2013) found that the growth of an SMBH also affects the nuclear stellar kinematics of a galaxy, increasing .222222Hartmann et al. (2014) remark that the increase in due to SMBH growth within a bar, seen by Brown et al. (2013), is only a small effect () compared to that resulting from the formation and evolution of a bar.
3.1.2 The – Relation
As mentioned in Section 1, some theoretical models suggest that dark matter halos should be related to the mass of their SMBHs. Additionally, lambda cold dark matter (CDM) disk–bulge–halo models indicate that the disks and bulges are formed from the cooling of baryons inside dark matter halos, implying that the disk and bulge of a galaxy should also be partially determined by the properties of its dark matter halo (e.g., Haehnelt et al., 1998; van den Bosch, 2000; Zhang & Wyse, 2000). As a consequence of this bulge–halo connection and the known – relation, there should be an – correlation. Combining our – relation (Equation (12)) with Equation (1) yields
{IEEEeqnarray}rCl
log(MDMM☉) & = (1.58±0.29)log(σ0141 km s-1)
+ (12.03±0.12).
Additional uncertainty is introduced through the propagation of errors232323Error propagation calculations were performed with the python package uncertainties (http://pythonhosted.org/uncertainties/). when Equations (12) and (1) are combined, however, Equation (3.1.2) provides a useful method of quickly estimating in spiral galaxies with bulges when only measurements are available.
Zahid et al. (2016) examine the – relation for massive () quiescent galaxies at . They find that , which is the same as the scaling relation between the dark matter halo velocity dispersion and halo mass (i.e., ) obtained by -body simulations (Evrard et al., 2008; Posti et al., 2014). We can compare our result by rearranging Equation (3.1.2) to show that for late-type galaxies has twice the slope derived by Zahid et al. (2016) for early-type galaxies.
To the best of our knowledge, this is the first time that the relationship between the mass of the dark matter halo and the central stellar velocity dispersion has been derived or presented for spiral galaxies, although we caution against its extrapolation to late-type (Sc) spiral galaxies with that potentially are overinfluenced by the disk kinematics. Alternatively, combining Equation (1) with Equation (1) yields
{IEEEeqnarray}rCl
log(MDMM☉) & = (0.74±0.26)log(σ0141 km s-1)
+ (12.03±0.12).
3.2 The – Relation
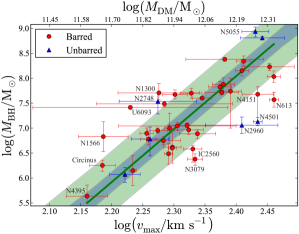
Here, we derive the – scaling relation for the largest sample of spiral galaxies with directly measured black hole masses to date. Our dataset, consisting of 42 galaxies, can be described by , , , and . The bces bisector regression yields the relation
{IEEEeqnarray}rCl
log(MBHM☉) & = (10.62±1.37)log(vmax210 km s-1)
+ (7.22±0.09),
with and , both in the direction (see Figure 2). These levels of scatter place the – relation on par with the scatter ( and ) about the – relation for spiral galaxies (Davis et al., 2017).
The slope for the – relation is significantly steeper than the slopes presented in previous works. However, the steep slope is in good agreement with the prediction from Equation (3), consistent at the level of , which both confirms that our – relation is in agreement with the Tully–Fisher relation and that the – relation must have the steep slope of reported by Davis et al. (2018).242424For reference, the –(stellar bulge mass) relation for spiral galaxies has a slope of (Davis et al., 2019).
We do not find barred galaxies to be offset in our – relation (see Figure 2); the bulk of our galaxies have barred morphologies (35 out of 42). Courteau et al. (2003) found that barred galaxies are not offset in the Tully–Fisher relation, reinforcing our finding that appears to predict black hole masses equally well for barred and nonbarred galaxies.252525In a highly influential work, Ostriker & Peebles (1973) concluded from their simulations of galaxies that massive halos would act to stabilize disks and suppress bar instabilities; thus, bars would preferentially form in galaxies with low-concentration halos. However, we now know that this is wrong. Bosma (1996) remark on the stabilizing influence of a bulge, and Sellwood & Evans (2001) find that high central rates of shear can stabilize a disk regardless of the dark matter halo density. In fact, the halo does not stabilize the disk, and even in some cases destabilizes it by increasing the bar instability (Athanassoula, 2002). That is, a single – Tully–Fisher relation for spiral galaxies combined with a single – relation for spiral galaxies yields a single – relation for spiral galaxies.
Based on the behavior of four spiral galaxies, Ferrarese (2002) postulated that halos with , i.e., , are progressively less efficient or perhaps incapable of forming SMBHs.262626Alternatively, van Wassenhove et al. (2010) find that a few percent of their simulated galaxies with massive black holes encounter stripping during their evolution, which leaves them “naked,” having lost most of their surrounding dark matter halos. As can be seen in Figure 2, three of our galaxies (Circinus, NGC 1566, and NGC 4395, two of which were outliers in Figure 1) have (i.e., km s-1 from Equation (1)). Our results show that is not a hard-and-fast threshold; however, given that our uncertainties on are greater than dex (see Table 1, Column (9)), our smallest dark matter halos are only marginally below this limit. For example, based on , we predict that NGC 1566 has a quite low . However, because NGC 1566 is a Type I Seyfert galaxy (Alloin et al., 1985; Oknyansky et al., 2019), it is hard to imagine it not possessing an SMBH.
If we track the location of the six outliers from Figure 1 to Figure 2, we find that the locations of NGC 613, NGC 1300, and NGC 4151 suggest that their maximum rotational velocities are anomalous, rather than their central stellar velocity dispersions or black hole masses. Circinus, NGC 4395, and NGC 5055 are not outliers in Figure 2, indicating that they might have abnormal central stellar velocity dispersions, rather than deviant maximum rotational velocities or black hole masses. NGC 4501 is the most significant outlier in Figure 2. It was not an outlier in Figure 1, implying that the black hole might be undermassive, although, it was not an outlier in any of our past black hole mass scaling relations with , , stellar bulge mass, or stellar galaxy mass.
The – relation (and/or the – relation, see §3.2.1) have been studied for nearly two decades (Ferrarese, 2002; Baes et al., 2003; Zasov et al., 2005; Sabra et al., 2008; Kormendy & Bender, 2011; Volonteri et al., 2011; Beifiori et al., 2012; Sun et al., 2013; Sabra et al., 2015). These studies have been conducted on varied galaxy samples, including all manner of morphological types, black hole mass estimates, measures of rotational velocities, and linear regression routines. The published results for the – relations have been quite diverse, ranging from a null result (Kormendy & Bender, 2011) to a shallow slope of (Sabra et al., 2015) and up to (Volonteri et al., 2011). None of these results are steep enough to give consistency between the – (Equation (2)) and Tully–Fisher (Equation (1)) relations for spiral galaxies.
Some of the explanation for why all previous studies seem to have underestimated the slope of the – relation lies in an almost ubiquitous adoption of a nearly linear – relation. If this were true, then our earlier prediction (Equation (3)) would become , which lies in the middle of the findings to date. Such a slope might conceivably make some sense for a population of massive elliptical galaxies that have formed from the result of many mergers, but even then, Sahu et al. (2019) find for early-type galaxies as a whole, and, for core-Sérsic early-type galaxies. A linear – relation is therefore closer to reality for early-type galaxies, stellar orbits are more random, and both kinematical measures, and , are well correlated (Zasov et al., 2005; Courteau et al., 2007; Ho, 2007) and roughly consistent with for the singular isothermal sphere profile, such that a collision-less system of stars is identical to an isothermal self-gravitating sphere of gas (Binney & Tremaine, 2011). However, none of this applies to low-mass spiral galaxies, which have been historically underrepresented in black hole mass scaling relations.
One additional factor depressing the slopes of some past studies of the – and – relations has been the inclusion of early-type galaxies in their samples. Sahu et al. (2019) find that early-type galaxies follow a different – relation than late-type galaxies, with early-type galaxies with disks (ES/S0) exhibiting . Because most early-type galaxies contain disks (e.g., Emsellem et al., 2011; Krajnović et al., 2011), and lenticular galaxies also follow the Tully–Fisher relation (Williams et al., 2009), for lenticular galaxies, Equation (3) would become , a result that is most similar to the results of Sabra et al. (2008)272727Sabra et al. (2008) obtained from a sample consisting of approximately half early-type galaxies. Seven years later, Sabra et al. (2015) found conflicting results between the relation fit from their data () and their prediction () from the observational study of galaxies by Bandara et al. (2009). and Volonteri et al. (2011), consistent at the level of and , respectively.
3.2.1 The – Relation
Observations find AGN in galaxies with little or no bulge (Satyapal et al., 2007, 2008) and thus hint at a possible underlying correlation between dark matter mass and black hole mass, rather than between bulge mass and black hole mass (Treuthardt et al., 2012). Such observations elevate the possibility of an – relation (with coming from through Equation (1)) in bulgy and bulgeless spiral galaxies, which might indicate that it is the cornerstone of black hole mass scaling relations. However, AGN feedback scenarios (e.g., Debuhr et al., 2010) suggest that the best correlation should be with the total baryonic mass rather than with the dark matter halo mass (if it is not the bulge mass) because the dark matter halo is mostly outside the baryons, and might not have much effect on the gas inflow to fuel the central SMBH. This means that the – relation would be an indirect result of the –(total baryonic mass) relation.
Theoretical models suggest that the – relation should be nonlinear. Haehnelt et al. (1998) demonstrated that the mass function of dark matter haloes could be matched to the luminosity function for quasars with lifetimes in the range of –. Their models show a strong correlation between the lifetime of quasars and the slope of the – relation, supporting longer quasar lifetimes as the slope of the – relation becomes progressively steeper; a linear relationship would require quasar lifetimes shorter than yr. Silk & Rees (1998) and Haehnelt et al. (1998) posited that (here, the typical quasar lifetime is a few times yr) for an isothermal sphere of cold dark matter, where a proportionality exists between the energy injected by a black hole and the gravitational binding energy () of the halo.
Alternatively, Di Matteo et al. (2003) suggested that , based on their CDM cosmological hydrodynamic simulations. Booth & Schaye (2010) concluded that is determined primarily by and found agreement with the isothermal prediction of Silk & Rees (1998) and Haehnelt et al. (1998), with , which is itself in exact agreement with the observational study of Bandara et al. (2009), who find .282828See also the observational study by Bogdán & Goulding (2015), who find from a sample of 3130 elliptical galaxies. However, these results should not be considered applicable to spiral galaxies as these studies focused on massive galaxies, e.g., the sample of Bandara et al. (2009) consisted of galaxies with and . Other published slopes for this relation, from galaxies with estimates, include (Ferrarese, 2002) for 38 spiral galaxies and (Baes et al., 2003) for 50 spiral galaxies.
Recently, Mutlu-Pakdil et al. (2018) found from a new set of simulations (Vogelsberger et al., 2014), which is in precise agreement with the above findings (Bandara et al., 2009; Booth & Schaye, 2010). Their work is different from previous studies because it focused on extending the relation to lower-mass spiral galaxies. However, their precise agreement with past studies of high-mass galaxies and an isothermal model indicate that their simulations remain tied or tuned to the old black hole mass scaling relations that assume that black holes and their host galaxies follow a nearly linear – relation. Specifically, Mutlu-Pakdil et al. (2018) perceive that , with a slope half as steep as our result for late-type galaxies (Equation (2)), but consistent with the relation for early-type galaxies from Sahu et al. (2019).292929From inspection of Figures 7 and 8 from Mutlu-Pakdil et al. (2018), we point out an apparent bend in the respective scaling relations with black hole mass. There is a noticeable dichotomy between low- and high-mass black holes, such that it warrants a steeper slope for spiral galaxies hosting low-mass black holes and a shallow slope for early-type galaxies hosting high-mass black holes, rather than their single regression fit to the combined sample. Combining the results of Mutlu-Pakdil et al. (2018), , would suggest that the – relation is almost exactly linear.
Evolutionary studies show how the – relation changes with time (Hansen et al., 2009; Behroozi et al., 2010, 2013, 2019; Moster et al., 2010, 2013, 2018; Leauthaud et al., 2012; Yang et al., 2012; Reddick et al., 2013; Wang et al., 2013; Birrer et al., 2014; Lu et al., 2015; Rodríguez-Puebla et al., 2017; Kravtsov et al., 2018; Mowla et al., 2019). Tiley et al. (2019) performed an analysis of the Tully–Fisher relation at and by carefully comparing local and distant samples of late-type galaxies and degrading the quality of the local sample to match that of the distant sample. They concluded that no significant difference is apparent between the two epochs, suggesting an intimate link between stellar mass and dark matter (as traced by ) in late-type galaxies over at least an Gyr period.
The – relation is traditionally fit with a double power law, exhibiting a steep low-mass slope and a shallow high-mass slope (Yang et al., 2012; Moster et al., 2013).303030However, Behroozi et al. (2013) note that a pure double power law is not perfect and results in a – relation that is off by as much as dex. For the low-mass portion of the double power-law – relation, Katz et al. (2018) speculate that late-type galaxies should follow a theoretical relation, powered by supernovae feedback and its role in regulating galaxy formation. Furthermore, Katz et al. (2018) follow this theoretical prediction up with an observational determination of from their sample of late-type galaxies from the SPARC sample with Di Cintio et al. (2014a) dark matter halo profiles. Combining this result with Equation (2) necessarily implies that
| (5) |
Combining our spiral galaxy – relation (Equation (3.2)) with Equation (1) yields
{IEEEeqnarray}rCl
log(MBHM☉) & = (4.35±0.66)log(MDM1012M☉)
+ (7.22±0.12),
which is consistent with the slope from Equation (5) at the level of . This slope for spiral galaxies is notably steeper than reported in past studies (e.g., Haehnelt et al., 1998; Silk & Rees, 1998; Ferrarese, 2002; Baes et al., 2003; Bandara et al., 2009; Booth & Schaye, 2010; Bogdán & Goulding, 2015; Mutlu-Pakdil et al., 2018).
3.3 The – Relation
The maximum rotational velocity does not only correlate with (Figure 2), but it also correlates with, among other things, the spiral-arm pitch angle, (for an introduction, see Davis et al., 2017).313131Logarithmic spirals have been adopted as the natural metric for the form of spiral arms in disk galaxies since the pioneering works of von der Pahlen (1911), Groot (1925), Reynolds (1925), Lindblad (1927, 1938, 1941), and Danver (1942). Kennicutt (1981) observed a correlation between the maximum rotational velocity and the spiral-arm pitch angle, which was later reanalyzed and quantified by Savchenko & Reshetnikov (2011). Kennicutt (1981) described the anticorrelation as being “fairly strong,”323232Kendall et al. (2011, 2015) present a study of vs. from near-infrared Spitzer Space Telescope imaging and “find no evidence for the strong anticorrelation” that was found in the optical by Kennicutt & Hodge (1982). and claimed that it supports the density-wave theory expectations for spiral-arm geometry (Roberts et al., 1975).333333See the recent reviews on spiral structure in disk galaxies (Dobbs & Baba, 2014) and spiral density wave theory (Shu, 2016) for additional information and historical context.
Our dataset of 42 galaxies can be described by , , , and . The bces bisector regression yields
{IEEEeqnarray}rCl
log(vmaxkm s-1) & = (-0.85±0.14)[tan—ϕ—-tan1335]
+ (2.33±0.01),
with dex and dex, both in the direction (see Figure 3).
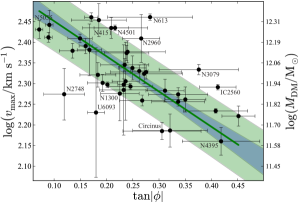
The outliers in Figure 3 match the behavior in the – diagram (Figure 2). This reflects the tight – relation (Seigar et al., 2008; Berrier et al., 2013; Davis et al., 2017). However, NGC 2748 was an outlier in the – diagram (Davis et al., 2017), suggesting that its continued deviance in the – diagram (Figure 3) is more due to its irregular spiral arms than to its maximum rotational velocity measurement because it was not an outlier in the – diagram (Figure 1).
Kennicutt (1981) qualitatively investigated the – relation using a sample of 113 spiral galaxies, but he did not perform a linear regression. Savchenko & Reshetnikov (2011) culled the sample from Kennicutt (1981) down to a subsample of 46 galaxies and performed a linear (not a power-law) regression, yielding
| (6) |
When we perform a similar regression on our () dataset of 42 spiral galaxies, we find that the bces bisector regression yields
{IEEEeqnarray}rCl
—ϕ— & = (-0.127±0.019)(vmax-210 km s-1km s-1)
+ (1443±066),
with and in pitch angle. Our slope of is more than times as steep as their slope. However, we argue that the slope of Savchenko & Reshetnikov (2011) in Equation (6) is too shallow because their zero-point predicts that at . In contrast, our zero-point would predict that at , which is on par with some of the highest measured pitch angle measurements in the literature. Nevertheless, such a formulation of the – relation is inherently limited, given that equals zero at high , which should not be the case. Only a rotating disk can have a spiral pattern with a measurable pitch angle. We prefer our formulation of the – relation in Equation (3.3), where never equals zero. Because is defined such that , the best-fit values from Equation (3.3) yield , respectively.
Savchenko & Reshetnikov (2011) used the correlation to predict for a distant sample of galaxies in the Hubble Deep Fields (Ferguson et al., 2000; Beckwith et al., 2006) and ultimately concluded that the distant galaxies follow the local Tully–Fisher relation if they follow the local – relation that they derived (for which we just doubled the slope). Given that Tiley et al. (2019) observe no significant difference between the zero-points343434Tiley et al. (2019) remark that it is difficult to precisely constrain the slope of the Tully–Fisher relation at due to large scatter; they instead perform fixed slope fits to their sample. of the Tully–Fisher relation at and ,353535This lack of evolution in the zero-point is also seen in the baryonic Tully–Fisher relation out to (Puech et al., 2010, 2011) and possibly even to (Weiner et al., 2006). we combine our modified – relation (Equation (3.3)) with the -band absolute magnitude ()363636Near-infrared imaging can offer a more complete view of spiral morphology as the optical morphologies of some spiral galaxies can appear significantly different (Block & Wainscoat, 1991; Block et al., 1994; Seigar & James, 1998a, b), with flocculent optical morphologies occasionally exhibiting grand-design morphologies in the near-infrared (Thornley, 1996; Seigar et al., 2003). On the whole, Buta et al. (2010b) found that (save for the most dusty galaxies) morphological classifications are well correlated with blue-light classifications. Tully–Fisher relation from Tiley et al. (2019)
{IEEEeqnarray}rCl
M_K & = (-8.3±0.3)log(vrot100 km s-1)
- (22.26±0.07) mag,
with mag and mag, to obtain
{IEEEeqnarray}rCl
M_K & = (7.08±1.17)[tan—ϕ—-tan1335]
- (25.03±0.15) mag.
This new relation allows us to estimate the intrinsic luminosity of a spiral galaxy (and therefore, a distance) based on its spiral geometry (see van den Bergh, 1960a, b, who presented a strong correlation between absolute luminosity and the degree of development of spiral arms), which is measurable from simple imaging.
3.3.1 The – Relation
Here, we present new evidence that spiral galaxy geometry becomes a useful indicator for the dark matter content of a galaxy. Combining our updated – relation (Equation (3.3)) with the – relation (Equation (1)) yields
{IEEEeqnarray}rCl
log(MDMM☉) & = (-2.08±0.37)[tan—ϕ—-tan1335]
+ (12.03±0.11).
Adding the total rms scatters from Equations (1) and (3.3) in quadrature yields an implied in the direction. This level of scatter is equivalent to that of the – relation from Davis et al. (2018), indicating a connection between the large gravitational potential well of a galaxy and its spiral-arm geometry, which is manifest in the – relation (Equation (3.3)). The ability of to predict dark matter halo masses in late-type galaxies with such a small slope and level of scatter is remarkable given that no other parameter in this paper is as simple to measure or has such minimal observational requirements.
Mutlu-Pakdil et al. (2018) also presented an – relation by measuring the pitch angles of spiral galaxies produced from the Illustris simulation (Vogelsberger et al., 2014). They found from 95 simulated spiral galaxies that . When we fit a linear bces bisector regression between and for our sample of 42 spiral galaxies, we similarly find . Therefore, because we find agreement between our observations and the Illustris simulations for the – relation (Equation (3.3.1)), but disagree with Mutlu-Pakdil et al. (2018) when it comes to the – relation (Equation (5)), we conclude that the Illustris simulation (and indeed most simulations) fail to properly model black hole mass scaling relations for spiral galaxies. Specifically, the simulations appear to correctly model the total stellar mass of spiral galaxies and the corresponding geometry of their spiral arms but underestimate the mass of SMBHs in spiral galaxies.
The existence of an – relation (Equation (3.3.1)) is not unforeseen; the – and – relations can be seen as complementary relations to the – relation (Equation (5)). Moreover, a correlation has been known to exist between rotation curve shear rate ()373737Shear is a dimensionless parameter that quantifies the shape (rising, falling, or flat) of rotation curves, and thus is dependent on the total baryonic and dark matter concentrations. for a flat rotation curve, for a falling rotation curve, and for a rising rotation curve (see Seigar et al., 2014, for a formal definition). and spiral-arm pitch angle. Block et al. (1999) and Seigar et al. (2004, 2005, 2006, 2014) have demonstrated the existence of an – relation from observations, and Grand et al. (2013) have confirmed the correlation through -body simulations. Precisely, (Seigar et al., 2006) and (Grand et al., 2013).383838See also the additional studies of the – relation from simulations (Michikoshi & Kokubo, 2014) and observations (Kendall et al., 2015; Yu & Ho, 2019). Similarly, Font et al. (2019) conducted a comparison of the “shear parameter” (the difference between the pattern speed of the bar and the spiral arms, relative to the angular rate of the outer disk) vs. in their observational study.
Kalinova et al. (2017) introduced a new parameter to classify the rotation curves of galaxies quantitatively: the coefficient of the first eigenvector (PC1) of the reconstructed circular velocity rotation curve of a galaxy through principal component analysis.393939PC1 is a measure of the shape and amplitude of the rotation curve and thus reflects the mass distribution of dark matter in galaxies. Galaxies with PC exhibit high-amplitude centrally-peaked rotation curves and galaxies with PC exhibit low-amplitude slow-rising rotation curves (see Kalinova et al., 2017, for additional information). Yu & Ho (2019) performed an observational study of PC1 vs. and uncovered a strong correlation (), from which they deduced the implication “that dark matter content might help to shape spiral arms.”
While perhaps not fundamental, is more a consequence of the presence of a sizeable stabilizing mass, making the disk less self-gravitating. Indeed, when the disk is stable, due to a large central mass (contributed by the bulge and maybe also the dark matter halo), then the pitch angle is small with a tightly wound spiral pattern or even a multi-arm structure. When the disk is unstable, it forms a bar, which can emanate loosely wound spiral arms from its ends. The observational results from Buta et al. (2010a) support this, showing that the frequency of strong bars progressively increases when moving through the morphological types from lenticular to early- and late-type spirals. Additionally, there can be evolution in time, since violent bar instability heats the disk, which becomes more stable due to a high Toomre parameter, , where is the tangential velocity dispersion and is the critical (i.e., the minimum dispersion needed for stability) velocity dispersion. Toomre (1964) established that , where is the disk surface density, and is the epicyclic frequency; is particularly high when there is a high mass concentration, making small and the disk stable. In the end, what counts is the mass concentration, not only the bulge (which is part of it). Rotational velocity is also a sign of mass concentration; is higher if the mass is more concentrated for the same total mass.
Numerical simulations also illustrate the importance of mass concentration. A sufficient mass concentration in barred galaxies creates two inner Lindblad resonances, inside of which the stable (x2) periodic prograde orbits404040For supplementary reading on families of periodic orbits, see Contopoulos & Papayannopoulos (1980), Contopoulos & Grosbol (1989), Sellwood & Wilkinson (1993), Binney & Tremaine (2011), and Sellwood (2014). are perpendicular to the bar and thus do not sustain the bar, but rather weaken it (Shaw et al., 1993). Mayer & Wadsley (2004) showed that bars need a minimum mass to form in galaxies with low surface brightness. Because the disk is diluted and not self-gravitating in a stabilizing halo, this leads to multi-arm or tightly wound spiral patterns with small . Foyle et al. (2008) demonstrated how the mass concentration can change the pattern and also create two exponential disks.
A decade of research has demonstrated a strong correlation between pitch angle and black hole mass (Seigar et al., 2008; Ringermacher & Mead, 2009; Berrier et al., 2013; Davis et al., 2017). Combining the fact that the geometry of spiral arms is undeniably a consequence of galactic rotation (and likely other factors such as the bulge mass and the density of the disk, see Davis et al., 2015) with the results of these aforementioned studies of , , , and shear, inevitably lead to the conclusion that an – relation must exist. Notably, the total gravitational mass of a galaxy determines its profile, shear rate is a parameterization of the differential rotation exhibited by the profile, which establishes a quasi-static density wave and generates a long-lived logarithmic spiral pattern of enhanced star formation with a unique pitch angle.
Moving farther afield, high- spirals are rare but documented in the literature. Labbé et al. (2003) presented a sample of half a dozen “large disk-like galaxies at high redshift” (), with some of the nearer galaxies exhibiting “evidence of well-developed grand-design spiral structure.” Contini et al. (2016) studied a sample of 28 star-forming galaxies at some of which were identified to exhibit spiral structure. Similarly, Burkert et al. (2016) analyzed a sample of 433 () massive star-forming disk galaxies. Recently, Yuan et al. (2017) discovered a gravitationally lensed high-redshift spiral galaxy at through source-plane reconstruction, making it “the highest-redshift spiral galaxy observed with the highest spatial resolution and spectroscopic depth to date.”414141See also the potential evidence for spiral arms in high-redshift submillimeter galaxies from Hodge et al. (2019). Just a few years ago, spiral galaxies were thought not to exist beyond , and the spirals found at were thought not to be true spirals, merely “spiral-like alignments of star formation clumps” (Elmegreen & Elmegreen, 2014). Studies of these early epochs are essential for evolutionary studies. van Dokkum et al. (2013) showed that mass growth in the central regions (and the black holes) of present-day Milky Way-like galaxies occurred primarily between and .
The discovery of high- spiral galaxies allows for the derivation of the high- – and high- – relations, which can be compared with their local counterparts, checking for signs of evolution. There may also be implications for the evolution of the black hole mass. Recent results from Drew et al. (2018) reveal a star-bursting galaxy at with a flat outer rotation curve, which is indicative of a rotation-supported disk galaxy, rich in dark matter and similar to disk galaxies at low redshift. If this single finding is representative of other high- galaxies, our – relation may become a useful tool in the estimation of dark matter at earlier epochs than our local sample. Because logarithmic spirals are scale-invariant curves and are thus unaltered by distance, might be an ideal messenger to convey an estimate of a host galaxy dark matter mass, especially at high redshifts, if the – relation does not evolve with , and we can therefore use the local – relation.
4 Conclusions
The – relation (§3.1) provides insights into the apparent connection between the kinematics of a galaxy dark matter halo and its stellar bulge. We have shown that the – relation, for , is consistent with studies over nearly the past two decades. We find that the slope is inconsistent with a value of one at the level, revealing that is not a constant value. We introduce and highlight the implied – relation (Equation (3.1.2)) and its practical application for galaxies with measurements of their bulges, yielding predictions of their dark matter halo masses.
We have presented observational evidence that a strong correlation exists between and for spiral galaxies (Figure 2). The – and – relations for spiral galaxies with have similar levels of scatter, with and in , respectively. Alleged pseudobulges dominate our sample of spiral galaxies (36 out of 42). Some may therefore prefer , over , as a predictor of black hole masses for spiral galaxies. Our – relation (Equation (3.2)) is steeper than previous studies, but we argue that past studies did not demonstrate consistency between complementary scaling relations, i.e., the slope we present for the – relation is supported by its agreement with the unification of the Tully–Fisher (–) relation (Equation (1)) and the – relation (Equation (2)).
The scatter for the – relation (Davis et al., 2018) is higher ( in ), suggesting that the influence of dark matter, as traced by ,424242All relations in this work involving are constrained by the Di Cintio et al. (2014a) halo profile and the empirical – relation (Equation (1)) of Katz et al. (2019). Other relations using are based directly on observational data. (rather than total stellar mass) on the central black hole mass is relevant. The low value of just dex in (Davis et al., 2017) about the shallow slope of the – relation still remains unmatched for spiral galaxies via , which is a defining characteristic of spiral galaxies. We acknowledge that these studies (i.e., Davis et al., 2017, 2018, 2019, and this work) focus on a sample constructed from selection of all spiral galaxies with available dynamical mass estimates of their central black holes. Because the sample size (48) is not yet large enough to explore a volume-limited sample, the resulting scaling relations unavoidably suffer from selection effects. Thus, underrepresented populations of galaxies with difficult to measure black hole masses would likely act to increase the scatter in these relations if they could be included (i.e., the quoted scatters should be considered minimum estimates),
Because is a reliable predictor of for late-type galaxies (Katz et al., 2019), our strong – correlation ( and ) retains its strength when translated into an – relation (Equation (5)). We find steep slopes for these two relations, which is indicative of a history of substantial black hole mass increase through accretion and long-lived quasars (Haehnelt et al., 1998). Concerning late-type galaxies, evolution along the steep – relation implies that galaxies host black holes that underwent rapid mass growth relative to their host (i.e., relative to maintaining a constant ratio). We echo our arguments from Davis et al. (2018) that it is crucial to separate galaxies according to morphology when black hole mass scaling relations are investigated. As revealed in Savorgnan et al. (2016) and Sahu et al. (2019), the – relation for early-type galaxies is very different.
We have also provided evidence of a link between the geometry of spiral galaxy arms and their dark matter halos. Indeed, the seminal work by Kennicutt (1981) qualitatively showed that is well correlated with , in particular for the later-type spiral galaxies. Such a specific connection between the kinematics of a galaxy and its spiral pattern has important consequences for spiral-arm genesis theories, such as the spiral density-wave (quasi-stationary spiral structure) modal theory (Lindblad, 1963, 1964; Lin & Shu, 1964, 1966; Roberts et al., 1975; Roberts, 1975; Bertin et al., 1989a, b; Bertin, 1991, 1993, 1996; Fuchs, 1991, 2000; Bertin & Lin, 1996), swing amplification theory (Julian & Toomre, 1966; Goldreich & Tremaine, 1978; Toomre, 1981; Toomre & Kalnajs, 1991; D’Onghia et al., 2013), kinematic spiral waves (Kalnajs, 1973; Toomre, 1977), the stochastic self-propagating star formation theory (Gerola & Seiden, 1978; Seiden & Gerola, 1979), solid-body rotation of material arms (Kormendy & Norman, 1979), recurrent cycles of groove modes (Sellwood, 2000), manifold theory (Romero-Gómez et al., 2006; Voglis et al., 2006b, see also Danby 1965)434343Two versions of the manifold theory have been developed: (i) the “flux-tube” version (Romero-Gómez et al., 2006, 2007; Athanassoula et al., 2009a, b, 2010; Athanassoula, 2012) and (ii) the “apocentric manifolds” version (Voglis et al., 2006a, b; Tsoutsis et al., 2008, 2009; Efthymiopoulos, 2010; Harsoula et al., 2016); see also the recent work by Efthymiopoulos et al. (2019)., superposed transient instabilities (Sellwood & Carlberg, 2014), etc. We have quantified the – relation (Equation (3.3)) to enable and facilitate testing between rival theories of spiral-arm formation (Kennicutt & Hodge, 1982). The connection between spiral-arm winding and kinematics can also be applied to the Tully–Fisher relation to indirectly estimate distances to spiral galaxies (Equation (36)). For a complete understanding of galaxy formation and evolutionary processes, it is necessary to study and gain insight into the influence of dark matter. To that end, we have translated the – relation into an – relation (Equation (3.3.1)) providing for the first time a useful method of predicting dark matter halo masses from the geometry of spiral arms in uncalibrated photometric images of spiral galaxies.
Metaphorically, we can ascribe a dark matter halo as the central nervous system of its host galaxy, filling and connecting all regions of the galaxy. Indeed, the dark matter halo of a spiral galaxy can be considered a legitimate puppet-master, covertly influencing the observable properties and components of its host galaxy. This notion that the dark matter halo determines everything in a spiral galaxy (e.g., , mass concentration, and maybe ) has already been put forward by the proponents of modified gravity (Milgrom, 1983; McGaugh et al., 2000): when the baryon distribution is known, the implied dark matter distribution and total mass can be deduced.444444From the standpoint of modified Newtonian dynamics, Milgrom (1983) would argue that the baryonic mass is the total mass (i.e., there is no dark matter). Much of this dates back to the Tully–Fisher relation (Tully & Fisher, 1977; Aaronson et al., 1979, 1980; Mould et al., 1980; Aaronson & Mould, 1983), refined by the baryonic Tully–Fisher relation (Freeman, 1999; Walker, 1999; McGaugh et al., 2000).454545This critical dependency on the inventory of baryons would also necessitate an accounting of the gas in galaxies as well (i.e., taking gas into account should improve all scaling relations). For our sample, the gas content is thought to be a small fraction of the total mass, and thus we ignore it.
Intermediate-mass black holes (IMBHs; ) remain elusive stepping stones in the evolution from stellar mass () to supermassive () black holes (see Mezcua 2017 and Koliopanos 2017 for reviews). Recent studies (Koliopanos et al., 2017; Graham & Soria, 2019; Graham et al., 2019) have used multiple black hole mass scaling relations, in combination with X-ray observations of nuclear point sources, to identify IMBH candidates in local galaxies. Studies like these provide several independent estimates of black hole masses and serve as important guides for follow-up targets to hopefully confirm IMBH masses through more direct measurements. We offer one additional black hole hole mass scaling relation: –, which, when extrapolated, predicts that galaxies with ( through Equation (5)) should harbor IMBHs. For reference, our Galaxy464646The quantity should not be confused with the circular rotation velocity of the disk of our Galaxy at the location of the Sun and equal to (Bland-Hawthorn & Gerhard, 2016) or (Eilers et al., 2019). has and (Eilers et al., 2019), with (Boehle et al., 2016).
Despite claims that does not correlate with disks (Kormendy et al., 2011), the – relation for spiral galaxies has similar scatter as the – relation for spiral galaxies with . The steep – relation observed here brings consistency between the Tully–Fisher relation () and the relation for spiral galaxies. We note that the – relation (Equation (3.2)) and the – relation (Equation (12)) are also compatible with the – relation for spiral galaxies (Davis et al., 2017), i.e., combined with – yields , which is consistent with our result for spiral galaxies () from Davis et al. (2017) at the level of . Alternatively, if we cautiously assume that a selection bias is present, censoring galaxies with low from our sample, we can instead combine Equation (3.2) with Equation (1), which yields . When we compare this with the (YX) regression fit to the – relation (which similarly reduces any potential bias due to unobserved galaxies with low velocity dispersions) from Davis et al. (2017), , there is consistency at the level of . To conclude, the self-consistent relations presented in this work were derived from a spiral galaxy sample with directly measured SMBH masses that doubles the size of previous samples. These relations necessitate a salient revision to constraints that are applied to theory and simulations.
References
- Aaronson et al. (1979) Aaronson, M., Huchra, J., & Mould, J. 1979, ApJ, 229, 1, doi: 10.1086/156923
- Aaronson & Mould (1983) Aaronson, M., & Mould, J. 1983, ApJ, 265, 1, doi: 10.1086/160648
- Aaronson et al. (1980) Aaronson, M., Mould, J., Huchra, J., et al. 1980, ApJ, 239, 12, doi: 10.1086/158084
- Adams et al. (2001) Adams, F. C., Graff, D. S., & Richstone, D. O. 2001, ApJ, 551, L31, doi: 10.1086/319828
- Akerib et al. (2017) Akerib, D. S., Alsum, S., Araújo, H. M., et al. 2017, Phys. Rev. Lett., 118, 021303, doi: 10.1103/PhysRevLett.118.021303
- Akritas & Bershady (1996) Akritas, M. G., & Bershady, M. A. 1996, ApJ, 470, 706, doi: 10.1086/177901
- Alexander (2005) Alexander, T. 2005, Phys. Rep., 419, 65, doi: 10.1016/j.physrep.2005.08.002
- Alloin et al. (1985) Alloin, D., Pelat, D., Phillips, M., & Whittle, M. 1985, ApJ, 288, 205, doi: 10.1086/162783
- Amorim et al. (2019) Amorim, A., Bauböck, M., Berger, J. P., et al. 2019, Phys. Rev. Lett., 122, 101102, doi: 10.1103/PhysRevLett.122.101102
- Aprile et al. (2018) Aprile, E., Aalbers, J., Agostini, F., et al. 2018, Phys. Rev. Lett., 121, 111302, doi: 10.1103/PhysRevLett.121.111302
- Araya Salvo et al. (2012) Araya Salvo, C., Mathur, S., Ghosh, H., Fiore, F., & Ferrarese, L. 2012, ApJ, 757, 179, doi: 10.1088/0004-637X/757/2/179
- Arcadi et al. (2018) Arcadi, G., Dutra, M., Ghosh, P., et al. 2018, European Physical Journal C, 78, 203, doi: 10.1140/epjc/s10052-018-5662-y
- Artale et al. (2019) Artale, M. C., Pedrosa, S. E., Tissera, P. B., Cataldi, P., & Di Cintio, A. 2019, A&A, 622, A197, doi: 10.1051/0004-6361/201834096
- Athanassoula (2002) Athanassoula, E. 2002, ApJ, 569, L83, doi: 10.1086/340784
- Athanassoula (2012) —. 2012, MNRAS, 426, L46, doi: 10.1111/j.1745-3933.2012.01320.x
- Athanassoula (2016) Athanassoula, E. 2016, in Astrophysics and Space Science Library, Vol. 418, Galactic Bulges, ed. E. Laurikainen, R. Peletier, & D. Gadotti (Springer International Publishing Switzerland), 391
- Athanassoula et al. (2015) Athanassoula, E., Laurikainen, E., Salo, H., & Bosma, A. 2015, MNRAS, 454, 3843, doi: 10.1093/mnras/stv2231
- Athanassoula et al. (2009a) Athanassoula, E., Romero-Gómez, M., Bosma, A., & Masdemont, J. J. 2009a, MNRAS, 400, 1706, doi: 10.1111/j.1365-2966.2009.15583.x
- Athanassoula et al. (2010) —. 2010, MNRAS, 407, 1433, doi: 10.1111/j.1365-2966.2010.17010.x
- Athanassoula et al. (2009b) Athanassoula, E., Romero-Gómez, M., & Masdemont, J. J. 2009b, MNRAS, 394, 67, doi: 10.1111/j.1365-2966.2008.14273.x
- Babcock (1939) Babcock, H. W. 1939, Lick Observatory Bulletin, 19, 41, doi: 10.5479/ADS/bib/1939LicOB.19.41B
- Baes et al. (2003) Baes, M., Buyle, P., Hau, G. K. T., & Dejonghe, H. 2003, MNRAS, 341, L44, doi: 10.1046/j.1365-8711.2003.06680.x
- Bandara et al. (2009) Bandara, K., Crampton, D., & Simard, L. 2009, ApJ, 704, 1135, doi: 10.1088/0004-637X/704/2/1135
- Bardeen et al. (1972) Bardeen, J. M., Press, W. H., & Teukolsky, S. A. 1972, ApJ, 178, 347, doi: 10.1086/151796
- Bassett et al. (2014) Bassett, R., Glazebrook, K., Fisher, D. B., et al. 2014, MNRAS, 442, 3206, doi: 10.1093/mnras/stu1029
- Batcheldor (2010) Batcheldor, D. 2010, ApJ, 711, L108, doi: 10.1088/2041-8205/711/2/L108
- Beckwith et al. (2006) Beckwith, S. V. W., Stiavelli, M., Koekemoer, A. M., et al. 2006, AJ, 132, 1729, doi: 10.1086/507302
- Behroozi et al. (2019) Behroozi, P., Wechsler, R. H., Hearin, A. P., & Conroy, C. 2019, MNRAS, 1134, doi: 10.1093/mnras/stz1182
- Behroozi et al. (2010) Behroozi, P. S., Conroy, C., & Wechsler, R. H. 2010, ApJ, 717, 379, doi: 10.1088/0004-637X/717/1/379
- Behroozi et al. (2013) Behroozi, P. S., Wechsler, R. H., & Conroy, C. 2013, ApJ, 770, 57, doi: 10.1088/0004-637X/770/1/57
- Beifiori et al. (2012) Beifiori, A., Courteau, S., Corsini, E. M., & Zhu, Y. 2012, MNRAS, 419, 2497, doi: 10.1111/j.1365-2966.2011.19903.x
- Beifiori et al. (2009) Beifiori, A., Sarzi, M., Corsini, E. M., et al. 2009, ApJ, 692, 856, doi: 10.1088/0004-637X/692/1/856
- Bellovary et al. (2014) Bellovary, J. M., Holley-Bockelmann, K., Gültekin, K., et al. 2014, MNRAS, 445, 2667, doi: 10.1093/mnras/stu1958
- Berrier et al. (2013) Berrier, J. C., Davis, B. L., Kennefick, D., et al. 2013, ApJ, 769, 132, doi: 10.1088/0004-637X/769/2/132
- Bertin (1991) Bertin, G. 1991, in IAU Symposium, Vol. 146, Dynamics of Galaxies and Their Molecular Cloud Distributions, ed. F. Combes & F. Casoli, 93
- Bertin (1993) Bertin, G. 1993, PASP, 105, 640, doi: 10.1086/133209
- Bertin (1996) Bertin, G. 1996, in Astrophysics and Space Science Library, Vol. 209, New Extragalactic Perspectives in the New South Africa, Proceedings of the International Conference on“Cold Dust and Galaxy Morphology” Held in Johannesburg, South Africa, January 22-26, 1996, ed. D. L. Block & J. M. Greenberg (Dordrecht: Kluwer Academic Publishers), 227
- Bertin & Lin (1996) Bertin, G., & Lin, C. C. 1996, Spiral Structure in Galaxies a Density Wave Theory (Cambridge, MA MIT Press)
- Bertin et al. (1989a) Bertin, G., Lin, C. C., Lowe, S. A., & Thurstans, R. P. 1989a, ApJ, 338, 78, doi: 10.1086/167182
- Bertin et al. (1989b) —. 1989b, ApJ, 338, 104, doi: 10.1086/167183
- Bezanson et al. (2011) Bezanson, R., van Dokkum, P. G., Franx, M., et al. 2011, ApJ, 737, L31, doi: 10.1088/2041-8205/737/2/L31
- Binney & Tremaine (2011) Binney, J., & Tremaine, S. 2011, Galactic Dynamics: Second Edition, Princeton Series in Astrophysics (Princeton University Press). https://books.google.com.au/books?id=6mF4CKxlbLsC
- Birrer et al. (2014) Birrer, S., Lilly, S., Amara, A., Paranjape, A., & Refregier, A. 2014, ApJ, 793, 12, doi: 10.1088/0004-637X/793/1/12
- Bland-Hawthorn & Gerhard (2016) Bland-Hawthorn, J., & Gerhard, O. 2016, Annual Review of Astronomy and Astrophysics, 54, 529, doi: 10.1146/annurev-astro-081915-023441
- Block et al. (1994) Block, D. L., Bertin, G., Stockton, A., et al. 1994, A&A, 288, 365
- Block et al. (1999) Block, D. L., Puerari, I., Frogel, J. A., et al. 1999, Ap&SS, 269, 5, doi: 10.1023/A:1017099302995
- Block & Wainscoat (1991) Block, D. L., & Wainscoat, R. J. 1991, Nature, 353, 48, doi: 10.1038/353048a0
- Boehle et al. (2016) Boehle, A., Ghez, A. M., Schödel, R., et al. 2016, ApJ, 830, 17, doi: 10.3847/0004-637X/830/1/17
- Bogdán & Goulding (2015) Bogdán, Á., & Goulding, A. D. 2015, ApJ, 800, 124, doi: 10.1088/0004-637X/800/2/124
- Booth & Schaye (2010) Booth, C. M., & Schaye, J. 2010, MNRAS, 405, L1, doi: 10.1111/j.1745-3933.2010.00832.x
- Bosma (1981) Bosma, A. 1981, AJ, 86, 1791, doi: 10.1086/113062
- Bosma (1996) Bosma, A. 1996, in Astronomical Society of the Pacific Conference Series, Vol. 91, IAU Colloq. 157: Barred Galaxies, ed. R. Buta, D. A. Crocker, & B. G. Elmegreen, 132
- Broeils (1992) Broeils, A. H. 1992, A&A, 256, 19
- Brown et al. (2013) Brown, J. S., Valluri, M., Shen, J., & Debattista, V. P. 2013, ApJ, 778, 151, doi: 10.1088/0004-637X/778/2/151
- Burbidge & Burbidge (1959) Burbidge, E. M., & Burbidge, G. R. 1959, ApJ, 130, 20, doi: 10.1086/146691
- Bureau & Freeman (1999) Bureau, M., & Freeman, K. C. 1999, AJ, 118, 126, doi: 10.1086/300922
- Burkert & Forbes (2019) Burkert, A., & Forbes, D. 2019, arXiv e-prints, arXiv:1901.00900. https://arxiv.org/abs/1901.00900
- Burkert et al. (2016) Burkert, A., Förster Schreiber, N. M., Genzel, R., et al. 2016, ApJ, 826, 214, doi: 10.3847/0004-637X/826/2/214
- Buta et al. (2010a) Buta, R., Laurikainen, E., Salo, H., & Knapen, J. H. 2010a, ApJ, 721, 259, doi: 10.1088/0004-637X/721/1/259
- Buta et al. (2007) Buta, R. J., Corwin, H. G., & Odewahn, S. C. 2007, The de Vaucouleurs Atlas of Galaxies (Cambridge University Press, Cambridge, UK)
- Buta et al. (2010b) Buta, R. J., Sheth, K., Regan, M., et al. 2010b, ApJS, 190, 147, doi: 10.1088/0067-0049/190/1/147
- Buta et al. (2015) Buta, R. J., Sheth, K., Athanassoula, E., et al. 2015, ApJS, 217, 32, doi: 10.1088/0067-0049/217/2/32
- Cattaneo et al. (1999) Cattaneo, A., Haehnelt, M. G., & Rees, M. J. 1999, MNRAS, 308, 77, doi: 10.1046/j.1365-8711.1999.02693.x
- Ciambur & Graham (2016) Ciambur, B. C., & Graham, A. W. 2016, MNRAS, 459, 1276, doi: 10.1093/mnras/stw759
- Cisternas et al. (2011) Cisternas, M., Jahnke, K., Inskip, K. J., et al. 2011, ApJ, 726, 57, doi: 10.1088/0004-637X/726/2/57
- Combes et al. (1990) Combes, F., Debbasch, F., Friedli, D., & Pfenniger, D. 1990, A&A, 233, 82
- Combes et al. (2019) Combes, F., García-Burillo, S., Audibert, A., et al. 2019, A&A, 623, A79, doi: 10.1051/0004-6361/201834560
- Contini et al. (2016) Contini, T., Epinat, B., Bouché, N., et al. 2016, A&A, 591, A49, doi: 10.1051/0004-6361/201527866
- Contopoulos & Grosbol (1989) Contopoulos, G., & Grosbol, P. 1989, A&A Rev., 1, 261, doi: 10.1007/BF00873080
- Contopoulos & Papayannopoulos (1980) Contopoulos, G., & Papayannopoulos, T. 1980, A&A, 92, 33
- Costantin et al. (2018) Costantin, L., Corsini, E. M., Méndez-Abreu, J., et al. 2018, MNRAS, 481, 3623, doi: 10.1093/mnras/sty1754
- Courteau et al. (2003) Courteau, S., Andersen, D. R., Bershady, M. A., MacArthur, L. A., & Rix, H.-W. 2003, ApJ, 594, 208, doi: 10.1086/376754
- Courteau et al. (2007) Courteau, S., McDonald, M., Widrow, L. M., & Holtzman, J. 2007, ApJ, 655, L21, doi: 10.1086/511524
- Courtois et al. (2009) Courtois, H. M., Tully, R. B., Fisher, J. R., et al. 2009, AJ, 138, 1938, doi: 10.1088/0004-6256/138/6/1938
- Cowsik & McClelland (1972) Cowsik, R., & McClelland, J. 1972, Physical Review Letters, 29, 669, doi: 10.1103/PhysRevLett.29.669
- Cresci et al. (2009) Cresci, G., Hicks, E. K. S., Genzel, R., et al. 2009, ApJ, 697, 115, doi: 10.1088/0004-637X/697/1/115
- Danby (1965) Danby, J. M. A. 1965, AJ, 70, 501, doi: 10.1086/109773
- Danver (1942) Danver, C.-G. 1942, Annals of the Observatory of Lund, 10, 3
- Davis et al. (2012) Davis, B. L., Berrier, J. C., Shields, D. W., et al. 2012, ApJS, 199, 33, doi: 10.1088/0067-0049/199/2/33
- Davis et al. (2016) —. 2016, 2DFFT: Measuring Galactic Spiral Arm Pitch Angle, Astrophysics Source Code Library. http://ascl.net/1608.015
- Davis et al. (2018) Davis, B. L., Graham, A. W., & Cameron, E. 2018, ApJ, 869, 113, doi: 10.3847/1538-4357/aae820
- Davis et al. (2019) —. 2019, ApJ, 873, 85, doi: 10.3847/1538-4357/aaf3b8
- Davis et al. (2017) Davis, B. L., Graham, A. W., & Seigar, M. S. 2017, MNRAS, 471, 2187, doi: 10.1093/mnras/stx1794
- Davis et al. (2014) Davis, B. L., Berrier, J. C., Johns, L., et al. 2014, ApJ, 789, 124, doi: 10.1088/0004-637X/789/2/124
- Davis et al. (2015) Davis, B. L., Kennefick, D., Kennefick, J., et al. 2015, ApJ, 802, L13, doi: 10.1088/2041-8205/802/1/L13
- Davis & Hayes (2014) Davis, D. R., & Hayes, W. B. 2014, ApJ, 790, 87, doi: 10.1088/0004-637X/790/2/87
- de Blok & Bosma (2002) de Blok, W. J. G., & Bosma, A. 2002, A&A, 385, 816, doi: 10.1051/0004-6361:20020080
- de Blok et al. (2001) de Blok, W. J. G., McGaugh, S. S., Bosma, A., & Rubin, V. C. 2001, ApJ, 552, L23, doi: 10.1086/320262
- de Vaucouleurs (1974) de Vaucouleurs, G. 1974, in IAU Symposium, Vol. 58, The Formation and Dynamics of Galaxies: Proceedings from IAU Symposium no. 58 held in Canberra, Australia, August 12-15, 1973, ed. J. R. Shakeshaft (Dordrecht; Boston: Reidel), 335
- Debattista et al. (2013) Debattista, V. P., Kazantzidis, S., & van den Bosch, F. C. 2013, ApJ, 765, 23, doi: 10.1088/0004-637X/765/1/23
- Debuhr et al. (2010) Debuhr, J., Quataert, E., Ma, C.-P., & Hopkins, P. 2010, MNRAS, 406, L55, doi: 10.1111/j.1745-3933.2010.00881.x
- Di Cintio et al. (2014a) Di Cintio, A., Brook, C. B., Dutton, A. A., et al. 2014a, MNRAS, 441, 2986, doi: 10.1093/mnras/stu729
- Di Cintio et al. (2014b) Di Cintio, A., Brook, C. B., Macciò, A. V., et al. 2014b, MNRAS, 437, 415, doi: 10.1093/mnras/stt1891
- Di Matteo et al. (2003) Di Matteo, T., Croft, R. A. C., Springel, V., & Hernquist, L. 2003, ApJ, 593, 56, doi: 10.1086/376501
- Dobbs & Baba (2014) Dobbs, C., & Baba, J. 2014, PASA, 31, e035, doi: 10.1017/pasa.2014.31
- D’Onghia et al. (2013) D’Onghia, E., Vogelsberger, M., & Hernquist, L. 2013, ApJ, 766, 34, doi: 10.1088/0004-637X/766/1/34
- Drew et al. (2018) Drew, P. M., Casey, C. M., Burnham, A. D., et al. 2018, ApJ, 869, 58, doi: 10.3847/1538-4357/aaedbf
- Du et al. (2017) Du, M., Debattista, V. P., Shen, J., Ho, L. C., & Erwin, P. 2017, ApJ, 844, L15, doi: 10.3847/2041-8213/aa7ecb
- Efthymiopoulos (2010) Efthymiopoulos, C. 2010, European Physical Journal Special Topics, 186, 91, doi: 10.1140/epjst/e2010-01261-8
- Efthymiopoulos et al. (2019) Efthymiopoulos, C., Kyziropoulos, P. E., Páez, R. I., Zouloumi, K., & Gravvanis, G. A. 2019, MNRAS, 484, 1487, doi: 10.1093/mnras/stz035
- Eilers et al. (2019) Eilers, A.-C., Hogg, D. W., Rix, H.-W., & Ness, M. K. 2019, ApJ, 871, 120, doi: 10.3847/1538-4357/aaf648
- Einstein (1916) Einstein, A. 1916, Annalen der Physik, 354, 769, doi: 10.1002/andp.19163540702
- Elmegreen & Elmegreen (2014) Elmegreen, D. M., & Elmegreen, B. G. 2014, ApJ, 781, 11, doi: 10.1088/0004-637X/781/1/11
- Emsellem et al. (2011) Emsellem, E., Cappellari, M., Krajnović, D., et al. 2011, MNRAS, 414, 888, doi: 10.1111/j.1365-2966.2011.18496.x
- Erroz-Ferrer et al. (2015) Erroz-Ferrer, S., Knapen, J. H., Leaman, R., et al. 2015, MNRAS, 451, 1004, doi: 10.1093/mnras/stv924
- Erwin & Debattista (2013) Erwin, P., & Debattista, V. P. 2013, MNRAS, 431, 3060, doi: 10.1093/mnras/stt385
- Event Horizon Telescope Collaboration et al. (2019) Event Horizon Telescope Collaboration, Akiyama, K., Alberdi, A., et al. 2019, ApJ, 875, L1, doi: 10.3847/2041-8213/ab0ec7
- Evrard et al. (2008) Evrard, A. E., Bialek, J., Busha, M., et al. 2008, ApJ, 672, 122, doi: 10.1086/521616
- Ferguson et al. (2000) Ferguson, H. C., Dickinson, M., & Williams, R. 2000, Annual Review of Astronomy and Astrophysics, 38, 667, doi: 10.1146/annurev.astro.38.1.667
- Ferrarese (2002) Ferrarese, L. 2002, ApJ, 578, 90, doi: 10.1086/342308
- Ferrarese & Ford (2005) Ferrarese, L., & Ford, H. 2005, Space Sci. Rev., 116, 523, doi: 10.1007/s11214-005-3947-6
- Fisher & Drory (2016) Fisher, D. B., & Drory, N. 2016, Galactic Bulges, 418, 41, doi: 10.1007/978-3-319-19378-6_3
- Flores et al. (1993) Flores, R., Primack, J. R., Blumenthal, G. R., & Faber, S. M. 1993, ApJ, 412, 443, doi: 10.1086/172934
- Font et al. (2019) Font, J., Beckman, J. E., James, P. A., & Patsis, P. A. 2019, MNRAS, 482, 5362, doi: 10.1093/mnras/sty2983
- Foyle et al. (2008) Foyle, K., Courteau, S., & Thacker, R. J. 2008, MNRAS, 386, 1821, doi: 10.1111/j.1365-2966.2008.13201.x
- Freeman (1970) Freeman, K. C. 1970, ApJ, 160, 811, doi: 10.1086/150474
- Freeman (1999) Freeman, K. C. 1999, in Astronomical Society of the Pacific Conference Series, Vol. 170, The Low Surface Brightness Universe, ed. J. I. Davies, C. Impey, & S. Phillips, 3
- Fuchs (1991) Fuchs, B. 1991, in Dynamics of Disk Galaxies. Proc. Conf., Varberg Castle, Sweden, 25-30 May 1991, ed. B. Sundelius (Dept. Astron. Astrophys., Chalmers Univ. of Technology, Göteborg), 359–363
- Fuchs (2000) Fuchs, B. 2000, in Astronomical Society of the Pacific Conference Series, Vol. 197, Dynamics of Galaxies: from the Early Universe to the Present, 15th IAP Meeting Held in Paris, France, July 9-13, 1999, ed. F. Combes, G. A. Mamon, & V. Charmandaris (San Francisco, CA: ASP), 53
- Gadotti & Sánchez-Janssen (2012) Gadotti, D. A., & Sánchez-Janssen, R. 2012, MNRAS, 423, 877, doi: 10.1111/j.1365-2966.2012.20925.x
- Garcia-Rissmann et al. (2005) Garcia-Rissmann, A., Vega, L. R., Asari, N. V., et al. 2005, MNRAS, 359, 765, doi: 10.1111/j.1365-2966.2005.08957.x
- Gentile et al. (2004) Gentile, G., Salucci, P., Klein, U., Vergani, D., & Kalberla, P. 2004, MNRAS, 351, 903, doi: 10.1111/j.1365-2966.2004.07836.x
- Genzel et al. (2010) Genzel, R., Eisenhauer, F., & Gillessen, S. 2010, Reviews of Modern Physics, 82, 3121, doi: 10.1103/RevModPhys.82.3121
- Gerola & Seiden (1978) Gerola, H., & Seiden, P. E. 1978, ApJ, 223, 129, doi: 10.1086/156243
- Gershtein & Zel’dovich (1966) Gershtein, S. S., & Zel’dovich, Y. B. 1966, ZhETF Pisma Redaktsiiu, 4, 174
- Goldreich & Tremaine (1978) Goldreich, P., & Tremaine, S. 1978, ApJ, 222, 850, doi: 10.1086/156203
- Gorski et al. (2018) Gorski, M., Ott, J., Rand, R., et al. 2018, ApJ, 856, 134, doi: 10.3847/1538-4357/aab3cc
- Graham (2015) Graham, A. 2015, Highlights of Astronomy, 16, 360, doi: 10.1017/S1743921314011326
- Graham (2016) Graham, A. W. 2016, Galactic Bulges, 418, 263, doi: 10.1007/978-3-319-19378-6_11
- Graham & Driver (2007) Graham, A. W., & Driver, S. P. 2007, ApJ, 655, 77, doi: 10.1086/509758
- Graham et al. (2007) Graham, A. W., Driver, S. P., Allen, P. D., & Liske, J. 2007, MNRAS, 378, 198, doi: 10.1111/j.1365-2966.2007.11770.x
- Graham et al. (2011) Graham, A. W., Onken, C. A., Athanassoula, E., & Combes, F. 2011, MNRAS, 412, 2211, doi: 10.1111/j.1365-2966.2010.18045.x
- Graham & Soria (2019) Graham, A. W., & Soria, R. 2019, MNRAS, 484, 794, doi: 10.1093/mnras/sty3398
- Graham et al. (2019) Graham, A. W., Soria, R., & Davis, B. L. 2019, MNRAS, 484, 814, doi: 10.1093/mnras/sty3068
- Grand et al. (2013) Grand, R. J. J., Kawata, D., & Cropper, M. 2013, A&A, 553, A77, doi: 10.1051/0004-6361/201321308
- Gravity Collaboration et al. (2018a) Gravity Collaboration, Abuter, R., Amorim, A., et al. 2018a, A&A, 615, L15, doi: 10.1051/0004-6361/201833718
- Gravity Collaboration et al. (2018b) —. 2018b, A&A, 618, L10, doi: 10.1051/0004-6361/201834294
- Green et al. (2010) Green, A. W., Glazebrook, K., McGregor, P. J., et al. 2010, Nature, 467, 684, doi: 10.1038/nature09452
- Green et al. (2014) —. 2014, MNRAS, 437, 1070, doi: 10.1093/mnras/stt1882
- Groot (1925) Groot, H. 1925, MNRAS, 85, 535, doi: 10.1093/mnras/85.6.535
- Haehnelt & Kauffmann (2000) Haehnelt, M. G., & Kauffmann, G. 2000, MNRAS, 318, L35, doi: 10.1046/j.1365-8711.2000.03989.x
- Haehnelt et al. (1998) Haehnelt, M. G., Natarajan, P., & Rees, M. J. 1998, MNRAS, 300, 817, doi: 10.1046/j.1365-8711.1998.01951.x
- Hansen et al. (2009) Hansen, S. M., Sheldon, E. S., Wechsler, R. H., & Koester, B. P. 2009, ApJ, 699, 1333, doi: 10.1088/0004-637X/699/2/1333
- Harris et al. (2012) Harris, C. E., Bennert, V. N., Auger, M. W., et al. 2012, ApJS, 201, 29, doi: 10.1088/0067-0049/201/2/29
- Harsoula et al. (2016) Harsoula, M., Efthymiopoulos, C., & Contopoulos, G. 2016, MNRAS, 459, 3419, doi: 10.1093/mnras/stw748
- Hartmann et al. (2014) Hartmann, M., Debattista, V. P., Cole, D. R., et al. 2014, MNRAS, 441, 1243, doi: 10.1093/mnras/stu627
- Hasan & Crocker (2019) Hasan, F., & Crocker, A. 2019, arXiv e-prints, arXiv:1904.00486. https://arxiv.org/abs/1904.00486
- Haynes et al. (2018) Haynes, M. P., Giovanelli, R., Kent, B. R., et al. 2018, ApJ, 861, 49, doi: 10.3847/1538-4357/aac956
- Herrera-Endoqui et al. (2017) Herrera-Endoqui, M., Salo, H., Laurikainen, E., & Knapen, J. H. 2017, A&A, 599, A43, doi: 10.1051/0004-6361/201628849
- Ho (2007) Ho, L. C. 2007, ApJ, 668, 94, doi: 10.1086/521270
- Hodge et al. (2019) Hodge, J. A., Smail, I., Walter, F., et al. 2019, ApJ, 876, 130, doi: 10.3847/1538-4357/ab1846
- Hooper (2018) Hooper, D. 2018, ArXiv e-prints, arXiv:1812.02029. https://arxiv.org/abs/1812.02029
- Hopkins & Quataert (2010) Hopkins, P. F., & Quataert, E. 2010, MNRAS, 407, 1529, doi: 10.1111/j.1365-2966.2010.17064.x
- Illingworth (1983) Illingworth, G. 1983, in IAU Symposium, Vol. 100, Internal Kinematics and Dynamics of Galaxies; Proceedings of the Symposium, Besancon, France, August 9-13, 1982 (A83-49201 24-89), ed. E. Athanassoula (Dordrecht, D. Reidel Publishing Co.), 257–268
- Issaoun et al. (2019) Issaoun, S., Johnson, M. D., Blackburn, L., et al. 2019, ApJ, 871, 30, doi: 10.3847/1538-4357/aaf732
- Izquierdo-Villalba et al. (2019) Izquierdo-Villalba, D., Bonoli, S., Spinoso, D., et al. 2019, arXiv e-prints, arXiv:1901.10490. https://arxiv.org/abs/1901.10490
- Jarvis (1986) Jarvis, B. J. 1986, AJ, 91, 65, doi: 10.1086/113980
- Jeans (1922) Jeans, J. H. 1922, MNRAS, 82, 122, doi: 10.1093/mnras/82.3.122
- Jiang et al. (2011) Jiang, Y.-F., Greene, J. E., Ho, L. C., Xiao, T., & Barth, A. J. 2011, ApJ, 742, 68, doi: 10.1088/0004-637X/742/2/68
- Julian & Toomre (1966) Julian, W. H., & Toomre, A. 1966, ApJ, 146, 810, doi: 10.1086/148957
- Kalinova et al. (2017) Kalinova, V., Colombo, D., Rosolowsky, E., et al. 2017, MNRAS, 469, 2539, doi: 10.1093/mnras/stx901
- Kalnajs (1973) Kalnajs, A. J. 1973, Proceedings of the Astronomical Society of Australia, 2, 174, doi: 10.1017/S1323358000013461
- Kang et al. (2013) Kang, W.-R., Woo, J.-H., Schulze, A., et al. 2013, ApJ, 767, 26, doi: 10.1088/0004-637X/767/1/26
- Kapteyn (1922) Kapteyn, J. C. 1922, ApJ, 55, 302, doi: 10.1086/142670
- Katz et al. (2018) Katz, H., Desmond, H., Lelli, F., et al. 2018, MNRAS, 480, 4287, doi: 10.1093/mnras/sty2129
- Katz et al. (2019) Katz, H., Desmond, H., McGaugh, S., & Lelli, F. 2019, MNRAS, 483, L98, doi: 10.1093/mnrasl/sly203
- Katz et al. (2017) Katz, H., Lelli, F., McGaugh, S. S., et al. 2017, MNRAS, 466, 1648, doi: 10.1093/mnras/stw3101
- Kendall et al. (2015) Kendall, S., Clarke, C., & Kennicutt, R. C. 2015, MNRAS, 446, 4155, doi: 10.1093/mnras/stu2431
- Kendall et al. (2011) Kendall, S., Kennicutt, R. C., & Clarke, C. 2011, MNRAS, 414, 538, doi: 10.1111/j.1365-2966.2011.18422.x
- Kennicutt & Hodge (1982) Kennicutt, R., J., & Hodge, P. 1982, ApJ, 253, 101, doi: 10.1086/159614
- Kennicutt (1981) Kennicutt, R. C., J. 1981, AJ, 86, 1847, doi: 10.1086/113064
- Kerr (1963) Kerr, R. P. 1963, Phys. Rev. Lett., 11, 237, doi: 10.1103/PhysRevLett.11.237
- Kocevski et al. (2012) Kocevski, D. D., Faber, S. M., Mozena, M., et al. 2012, ApJ, 744, 148, doi: 10.1088/0004-637X/744/2/148
- Koliopanos (2017) Koliopanos, F. 2017, in Proceedings of the XII Multifrequency Behaviour of High Energy Cosmic Sources Workshop. 12-17 June. Palermo, Italy, 51
- Koliopanos et al. (2017) Koliopanos, F., Ciambur, B. C., Graham, A. W., et al. 2017, A&A, 601, A20, doi: 10.1051/0004-6361/201630061
- Kormendy & Bender (2011) Kormendy, J., & Bender, R. 2011, Nature, 469, 377, doi: 10.1038/nature09695
- Kormendy et al. (2011) Kormendy, J., Bender, R., & Cornell, M. E. 2011, Nature, 469, 374, doi: 10.1038/nature09694
- Kormendy & Norman (1979) Kormendy, J., & Norman, C. A. 1979, ApJ, 233, 539, doi: 10.1086/157414
- Kormendy & Richstone (1995) Kormendy, J., & Richstone, D. 1995, Annual Review of Astronomy and Astrophysics, 33, 581, doi: 10.1146/annurev.aa.33.090195.003053
- Kornei & McCrady (2009) Kornei, K. A., & McCrady, N. 2009, ApJ, 697, 1180, doi: 10.1088/0004-637X/697/2/1180
- Krajnović et al. (2011) Krajnović, D., Emsellem, E., Cappellari, M., et al. 2011, MNRAS, 414, 2923, doi: 10.1111/j.1365-2966.2011.18560.x
- Kravtsov et al. (2018) Kravtsov, A. V., Vikhlinin, A. A., & Meshcheryakov, A. V. 2018, Astronomy Letters, 44, 8, doi: 10.1134/S1063773717120015
- Krumm & Salpeter (1979) Krumm, N., & Salpeter, E. E. 1979, AJ, 84, 1138, doi: 10.1086/112521
- Kuzio de Naray et al. (2008) Kuzio de Naray, R., McGaugh, S. S., & de Blok, W. J. G. 2008, ApJ, 676, 920, doi: 10.1086/527543
- Kuzio de Naray et al. (2006) Kuzio de Naray, R., McGaugh, S. S., de Blok, W. J. G., & Bosma, A. 2006, ApJS, 165, 461, doi: 10.1086/505345
- Kuzio de Naray et al. (2009) Kuzio de Naray, R., McGaugh, S. S., & Mihos, J. C. 2009, ApJ, 692, 1321, doi: 10.1088/0004-637X/692/2/1321
- Labbé et al. (2003) Labbé, I., Rudnick, G., Franx, M., et al. 2003, ApJ, 591, L95, doi: 10.1086/377149
- Laurikainen & Salo (2016) Laurikainen, E., & Salo, H. 2016, in Astrophysics and Space Science Library, Vol. 418, Galactic Bulges, ed. E. Laurikainen, R. Peletier, & D. Gadotti (Springer International Publishing Switzerland), 77
- Laurikainen & Salo (2017) Laurikainen, E., & Salo, H. 2017, A&A, 598, A10, doi: 10.1051/0004-6361/201628936
- Laurikainen et al. (2013) Laurikainen, E., Salo, H., Athanassoula, E., et al. 2013, MNRAS, 430, 3489, doi: 10.1093/mnras/stt150
- Laurikainen et al. (2014) Laurikainen, E., Salo, H., Athanassoula, E., Bosma, A., & Herrera-Endoqui, M. 2014, MNRAS, 444, L80, doi: 10.1093/mnrasl/slu118
- Laurikainen et al. (2015) Laurikainen, E., Salo, H., Buta, R., & Knapen, J. 2015, Highlights of Astronomy, 16, 331, doi: 10.1017/S174392131400595X
- Laurikainen et al. (2011) Laurikainen, E., Salo, H., Buta, R., & Knapen, J. H. 2011, MNRAS, 418, 1452, doi: 10.1111/j.1365-2966.2011.19283.x
- Laurikainen et al. (2018) Laurikainen, E., Salo, H., Laine, J., & Janz, J. 2018, A&A, 618, A34, doi: 10.1051/0004-6361/201833138
- Leauthaud et al. (2012) Leauthaud, A., Tinker, J., Bundy, K., et al. 2012, ApJ, 744, 159, doi: 10.1088/0004-637X/744/2/159
- Lelli et al. (2016) Lelli, F., McGaugh, S. S., & Schombert, J. M. 2016, AJ, 152, 157, doi: 10.3847/0004-6256/152/6/157
- Leroy et al. (2018) Leroy, A. K., Bolatto, A. D., Ostriker, E. C., et al. 2018, ApJ, 869, 126, doi: 10.3847/1538-4357/aaecd1
- Lin & Shu (1964) Lin, C. C., & Shu, F. H. 1964, ApJ, 140, 646, doi: 10.1086/147955
- Lin & Shu (1966) —. 1966, Proceedings of the National Academy of Science, 55, 229
- Lindblad (1926) Lindblad, B. 1926, Uppsala Meddelanden, 11, 30
- Lindblad (1927) —. 1927, MNRAS, 87, 420, doi: 10.1093/mnras/87.5.420
- Lindblad (1938) —. 1938, Zeitschrift fur Astrophysik, 15, 124
- Lindblad (1941) —. 1941, Stockholms Observatoriums Annaler, 13, 10.1
- Lindblad (1963) —. 1963, Stockholms Observatoriums Annaler, 5, 5
- Lindblad (1964) —. 1964, Astrophysica Norvegica, 9, 103
- Loeb & Rasio (1994) Loeb, A., & Rasio, F. A. 1994, ApJ, 432, 52, doi: 10.1086/174548
- Longair (1996) Longair, M. S. 1996, Our Evolving Universe (Cambridge, New York: Cambridge University Press)
- Longair (2006) Longair, M. S. M. S. . 2006, The Cosmic Century: A History of Astrophysics and Cosmology (Cambridge University Press, Cambridge, UK)
- Lu et al. (2015) Lu, Z., Mo, H. J., Lu, Y., et al. 2015, MNRAS, 450, 1604, doi: 10.1093/mnras/stv667
- Lütticke et al. (2000a) Lütticke, R., Dettmar, R.-J., & Pohlen, M. 2000a, A&AS, 145, 405, doi: 10.1051/aas:2000354
- Lütticke et al. (2000b) —. 2000b, A&A, 362, 435
- Lynden-Bell (1969) Lynden-Bell, D. 1969, Nature, 223, 690, doi: 10.1038/223690a0
- Lynden-Bell et al. (1988) Lynden-Bell, D., Faber, S. M., Burstein, D., et al. 1988, ApJ, 326, 19, doi: 10.1086/166066
- Mangum et al. (2019) Mangum, J. G., Ginsburg, A. G., Henkel, C., et al. 2019, ApJ, 871, 170, doi: 10.3847/1538-4357/aafa15
- Martín et al. (2019) Martín, S., Muller, S., Henkel, C., et al. 2019, A&A, 624, A125, doi: 10.1051/0004-6361/201935106
- Marx & Szalay (1972) Marx, G., & Szalay, A. S. 1972, Proc. “Neutrino ’72” Technoinform, Budapest, 1, 123
- Mathewson & Ford (1996) Mathewson, D. S., & Ford, V. L. 1996, ApJS, 107, 97, doi: 10.1086/192356
- Mathewson et al. (1992) Mathewson, D. S., Ford, V. L., & Buchhorn, M. 1992, ApJS, 81, 413, doi: 10.1086/191700
- Mayer & Wadsley (2004) Mayer, L., & Wadsley, J. 2004, MNRAS, 347, 277, doi: 10.1111/j.1365-2966.2004.07202.x
- McGaugh & Schombert (2015) McGaugh, S. S., & Schombert, J. M. 2015, ApJ, 802, 18, doi: 10.1088/0004-637X/802/1/18
- McGaugh et al. (2000) McGaugh, S. S., Schombert, J. M., Bothun, G. D., & de Blok, W. J. G. 2000, ApJ, 533, L99, doi: 10.1086/312628
- Mezcua (2017) Mezcua, M. 2017, International Journal of Modern Physics D, 26, 1730021, doi: 10.1142/S021827181730021X
- Michikoshi & Kokubo (2014) Michikoshi, S., & Kokubo, E. 2014, ApJ, 787, 174, doi: 10.1088/0004-637X/787/2/174
- Milgrom (1983) Milgrom, M. 1983, ApJ, 270, 371, doi: 10.1086/161131
- Monaco et al. (2000) Monaco, P., Salucci, P., & Danese, L. 2000, MNRAS, 311, 279, doi: 10.1046/j.1365-8711.2000.03043.x
- Moster et al. (2013) Moster, B. P., Naab, T., & White, S. D. M. 2013, MNRAS, 428, 3121, doi: 10.1093/mnras/sts261
- Moster et al. (2018) Moster, B. P., Naab, T., & White, S. D. M. 2018, MNRAS, 477, 1822, doi: 10.1093/mnras/sty655
- Moster et al. (2010) Moster, B. P., Somerville, R. S., Maulbetsch, C., et al. 2010, ApJ, 710, 903, doi: 10.1088/0004-637X/710/2/903
- Mould et al. (1980) Mould, J., Aaronson, M., & Huchra, J. 1980, ApJ, 238, 458, doi: 10.1086/158002
- Mowla et al. (2019) Mowla, L., van der Wel, A., van Dokkum, P., & Miller, T. B. 2019, ApJ, 872, L13, doi: 10.3847/2041-8213/ab0379
- Mundell et al. (1999) Mundell, C. G., Pedlar, A., Shone, D. L., & Robinson, A. 1999, MNRAS, 304, 481, doi: 10.1046/j.1365-8711.1999.02331.x
- Mutlu-Pakdil et al. (2016) Mutlu-Pakdil, B., Seigar, M. S., & Davis, B. L. 2016, ApJ, 830, 117, doi: 10.3847/0004-637X/830/2/117
- Mutlu-Pakdil et al. (2018) Mutlu-Pakdil, B., Seigar, M. S., Hewitt, I. B., et al. 2018, MNRAS, 474, 2594, doi: 10.1093/mnras/stx2935
- Navarro et al. (1996) Navarro, J. F., Frenk, C. S., & White, S. D. M. 1996, ApJ, 462, 563, doi: 10.1086/177173
- Nemmen et al. (2012) Nemmen, R. S., Georganopoulos, M., Guiriec, S., et al. 2012, Science, 338, 1445, doi: 10.1126/science.1227416
- Oknyansky et al. (2019) Oknyansky, V. L., Winkler, H., Tsygankov, S. S., et al. 2019, MNRAS, 483, 558, doi: 10.1093/mnras/sty3133
- Onken et al. (2004) Onken, C. A., Ferrarese, L., Merritt, D., et al. 2004, ApJ, 615, 645, doi: 10.1086/424655
- Onken et al. (2014) Onken, C. A., Valluri, M., Brown, J. S., et al. 2014, ApJ, 791, 37, doi: 10.1088/0004-637X/791/1/37
- Oort (1932) Oort, J. H. 1932, Bull. Astron. Inst. Netherlands, 6, 249
- Oort (1940) —. 1940, ApJ, 91, 273, doi: 10.1086/144167
- Ostriker & Peebles (1973) Ostriker, J. P., & Peebles, P. J. E. 1973, ApJ, 186, 467, doi: 10.1086/152513
- Patsis et al. (2002) Patsis, P. A., Skokos, C., & Athanassoula, E. 2002, MNRAS, 337, 578, doi: 10.1046/j.1365-8711.2002.05943.x
- Paturel et al. (2003) Paturel, G., Theureau, G., Bottinelli, L., et al. 2003, A&A, 412, 57, doi: 10.1051/0004-6361:20031412
- Persic & Salucci (1988) Persic, M., & Salucci, P. 1988, MNRAS, 234, 131, doi: 10.1093/mnras/234.1.131
- Peterson et al. (2004) Peterson, B. M., Ferrarese, L., Gilbert, K. M., et al. 2004, ApJ, 613, 682, doi: 10.1086/423269
- Pizzella et al. (2005) Pizzella, A., Corsini, E. M., Dalla Bontà, E., et al. 2005, ApJ, 631, 785, doi: 10.1086/430513
- Planck Collaboration et al. (2018) Planck Collaboration, Aghanim, N., Akrami, Y., et al. 2018, ArXiv e-prints, arXiv:1807.06209. https://arxiv.org/abs/1807.06209
- Posti et al. (2014) Posti, L., Nipoti, C., Stiavelli, M., & Ciotti, L. 2014, MNRAS, 440, 610, doi: 10.1093/mnras/stu301
- Puech et al. (2010) Puech, M., Hammer, F., Flores, H., et al. 2010, A&A, 510, A68, doi: 10.1051/0004-6361/200912081
- Puech et al. (2011) Puech, M., Hammer, F., Flores, H., et al. 2011, in IAU Symposium, Vol. 277, Tracing the Ancestry of Galaxies: On the Land of Our Ancestors, Ouagadougou, Burkina Faso, 13-17 December 2010, ed. C. Carignan, F. Combes, & K. C. Freeman (Cambridge University Press), 138–141
- Reddick et al. (2013) Reddick, R. M., Wechsler, R. H., Tinker, J. L., & Behroozi, P. S. 2013, ApJ, 771, 30, doi: 10.1088/0004-637X/771/1/30
- Reynolds (1925) Reynolds, J. H. 1925, MNRAS, 85, 1014, doi: 10.1093/mnras/85.12.1014
- Ringermacher & Mead (2009) Ringermacher, H. I., & Mead, L. R. 2009, AJ, 137, 4716, doi: 10.1088/0004-6256/137/6/4716
- Roberts & Rots (1973) Roberts, M. S., & Rots, A. H. 1973, A&A, 26, 483
- Roberts (1975) Roberts, Jr., W. W. 1975, Vistas in Astronomy, 19, 91, doi: 10.1016/0083-6656(75)90008-2
- Roberts et al. (1975) Roberts, Jr., W. W., Roberts, M. S., & Shu, F. H. 1975, ApJ, 196, 381, doi: 10.1086/153421
- Rodríguez-Puebla et al. (2017) Rodríguez-Puebla, A., Primack, J. R., Avila-Reese, V., & Faber, S. M. 2017, MNRAS, 470, 651, doi: 10.1093/mnras/stx1172
- Rogstad & Shostak (1972) Rogstad, D. H., & Shostak, G. S. 1972, ApJ, 176, 315, doi: 10.1086/151636
- Romero-Gómez et al. (2007) Romero-Gómez, M., Athanassoula, E., Masdemont, J. J., & García-Gómez, C. 2007, A&A, 472, 63, doi: 10.1051/0004-6361:20077504
- Romero-Gómez et al. (2006) Romero-Gómez, M., Masdemont, J. J., Athanassoula, E., & García-Gómez, C. 2006, A&A, 453, 39, doi: 10.1051/0004-6361:20054653
- Rood (1965) Rood, H. J. 1965, PhD thesis, Univ. Michigan.
- Rubin et al. (1978) Rubin, V. C., Ford, W. K., J., & Thonnard, N. 1978, ApJ, 225, L107, doi: 10.1086/182804
- Rubin et al. (1980) —. 1980, ApJ, 238, 471, doi: 10.1086/158003
- Rubin & Ford (1970) Rubin, V. C., & Ford, Jr., W. K. 1970, ApJ, 159, 379, doi: 10.1086/150317
- Rubin et al. (1977) Rubin, V. C., Thonnard, N., & Ford, W. K., J. 1977, ApJ, 217, L1, doi: 10.1086/182526
- Sabra et al. (2008) Sabra, B. M., Akl, M. A., & Chahine, G. 2008, in IAU Symposium, Vol. 245, Formation and Evolution of Galaxy Bulges, 16-20 July 2007, Oxford, United Kingdom, ed. M. Bureau, E. Athanassoula, & B. Barbuy (Cambridge: CUP), 257–258
- Sabra et al. (2015) Sabra, B. M., Saliba, C., Abi Akl, M., & Chahine, G. 2015, ApJ, 803, 5, doi: 10.1088/0004-637X/803/1/5
- Saha et al. (2018) Saha, K., Graham, A. W., & Rodríguez-Herranz, I. 2018, ApJ, 852, 133, doi: 10.3847/1538-4357/aa9ed8
- Sahu et al. (2019) Sahu, N., Graham, A. W., & Davis, B. L. 2019, ApJ, 876, 155, doi: 10.3847/1538-4357/ab0f32
- Salo & Laurikainen (2017a) Salo, H., & Laurikainen, E. 2017a, ApJ, 835, 252, doi: 10.3847/1538-4357/835/2/252
- Salo & Laurikainen (2017b) Salo, H., & Laurikainen, E. 2017b, in AAS/Division of Dynamical Astronomy Meeting, Vol. 48, 303.02
- Salucci (2019) Salucci, P. 2019, Astronomy and Astrophysics Review, 27, 2, doi: 10.1007/s00159-018-0113-1
- Sanders & Lowinger (1972) Sanders, R. H., & Lowinger, T. 1972, AJ, 77, 292, doi: 10.1086/111281
- Satyapal et al. (2008) Satyapal, S., Vega, D., Dudik, R. P., Abel, N. P., & Heckman, T. 2008, ApJ, 677, 926, doi: 10.1086/529014
- Satyapal et al. (2007) Satyapal, S., Vega, D., Heckman, T., O’Halloran, B., & Dudik, R. 2007, ApJ, 663, L9, doi: 10.1086/519995
- Savchenko & Reshetnikov (2011) Savchenko, S. S., & Reshetnikov, V. P. 2011, Astronomy Letters, 37, 817, doi: 10.1134/S1063773711120097
- Savorgnan et al. (2016) Savorgnan, G. A. D., Graham, A. W., Marconi, A., & Sani, E. 2016, ApJ, 817, 21, doi: 10.3847/0004-637X/817/1/21
- Schawinski et al. (2012) Schawinski, K., Simmons, B. D., Urry, C. M., Treister, E., & Glikman, E. 2012, MNRAS, 425, L61, doi: 10.1111/j.1745-3933.2012.01302.x
- Schawinski et al. (2011) Schawinski, K., Treister, E., Urry, C. M., et al. 2011, ApJ, 727, L31, doi: 10.1088/2041-8205/727/2/L31
- Schwarzschild (1916) Schwarzschild, K. 1916, Sitzungsberichte der Königlich Preußischen Akademie der Wissenschaften (Berlin), 189
- Schwarzschild (1954) Schwarzschild, M. 1954, AJ, 59, 273, doi: 10.1086/107013
- Seiden & Gerola (1979) Seiden, P. E., & Gerola, H. 1979, ApJ, 233, 56, doi: 10.1086/157366
- Seigar (2015) Seigar, M. S. 2015, Dark Matter in the Universe, 2053-2571 (Morgan & Claypool Publishers, 40 Oak Drive, San Rafael, CA, 94903, USA), doi: 10.1088/978-1-6817-4118-5
- Seigar et al. (2004) Seigar, M. S., Block, D. L., & Puerari, I. 2004, in Astrophysics and Space Science Library, Vol. 319, Penetrating Bars Through Masks of Cosmic Dust: the Hubble Tuning Fork Strikes a New Note, Proceedings of a Conference Held at Pilanesburg National Park (South Africa), ed. D. L. Block, I. Puerari, K. C. Freeman, R. Groess, & E. K. Block (Dordrecht: Kluwer Academic Publishers), 155
- Seigar et al. (2005) Seigar, M. S., Block, D. L., Puerari, I., Chorney, N. E., & James, P. A. 2005, MNRAS, 359, 1065, doi: 10.1111/j.1365-2966.2005.08970.x
- Seigar et al. (2006) Seigar, M. S., Bullock, J. S., Barth, A. J., & Ho, L. C. 2006, ApJ, 645, 1012, doi: 10.1086/504463
- Seigar et al. (2003) Seigar, M. S., Chorney, N. E., & James, P. A. 2003, MNRAS, 342, 1, doi: 10.1046/j.1365-8711.2003.06522.x
- Seigar et al. (2014) Seigar, M. S., Davis, B. L., Berrier, J., & Kennefick, D. 2014, ApJ, 795, 90, doi: 10.1088/0004-637X/795/1/90
- Seigar & James (1998a) Seigar, M. S., & James, P. A. 1998a, MNRAS, 299, 672, doi: 10.1046/j.1365-8711.1998.01778.x
- Seigar & James (1998b) —. 1998b, MNRAS, 299, 685, doi: 10.1046/j.1365-8711.1998.01779.x
- Seigar et al. (2008) Seigar, M. S., Kennefick, D., Kennefick, J., & Lacy, C. H. S. 2008, ApJ, 678, L93, doi: 10.1086/588727
- Sellwood (2000) Sellwood, J. A. 2000, Ap&SS, 272, 31, doi: 10.1023/A:1002668818252
- Sellwood (2014) —. 2014, Reviews of Modern Physics, 86, 1, doi: 10.1103/RevModPhys.86.1
- Sellwood & Carlberg (2014) Sellwood, J. A., & Carlberg, R. G. 2014, ApJ, 785, 137, doi: 10.1088/0004-637X/785/2/137
- Sellwood & Evans (2001) Sellwood, J. A., & Evans, N. W. 2001, ApJ, 546, 176, doi: 10.1086/318228
- Sellwood & Wilkinson (1993) Sellwood, J. A., & Wilkinson, A. 1993, Reports on Progress in Physics, 56, 173, doi: 10.1088/0034-4885/56/2/001
- Seo et al. (2019) Seo, W.-Y., Kim, W.-T., Kwak, S., et al. 2019, ApJ, 872, 5, doi: 10.3847/1538-4357/aafc5f
- Serra et al. (2016) Serra, P., Oosterloo, T., Cappellari, M., den Heijer, M., & Józsa, G. I. G. 2016, MNRAS, 460, 1382, doi: 10.1093/mnras/stw1010
- Shaw et al. (1993) Shaw, M. A., Combes, F., Axon, D. J., & Wright, G. S. 1993, A&A, 273, 31
- Sheth et al. (2008) Sheth, K., Elmegreen, D. M., Elmegreen, B. G., et al. 2008, ApJ, 675, 1141, doi: 10.1086/524980
- Shields et al. (2015a) Shields, D. W., Boe, B., Pfountz, C., et al. 2015a, ArXiv e-prints. https://arxiv.org/abs/1511.06365
- Shields et al. (2015b) —. 2015b, Spirality: Spiral Arm Pitch Angle Measurement, Astrophysics Source Code Library. http://ascl.net/1512.015
- Shlosman et al. (1990) Shlosman, I., Begelman, M. C., & Frank, J. 1990, Nature, 345, 679, doi: 10.1038/345679a0
- Shlosman et al. (1989) Shlosman, I., Frank, J., & Begelman, M. C. 1989, Nature, 338, 45, doi: 10.1038/338045a0
- Shu (2016) Shu, F. H. 2016, ARA&A, 54, 667, doi: 10.1146/annurev-astro-081915-023426
- Silk & Rees (1998) Silk, J., & Rees, M. J. 1998, A&A, 331, L1. https://arxiv.org/abs/astro-ph/9801013
- Simmons et al. (2012) Simmons, B. D., Urry, C. M., Schawinski, K., Cardamone, C., & Glikman, E. 2012, ApJ, 761, 75, doi: 10.1088/0004-637X/761/1/75
- Smith (1936) Smith, S. 1936, ApJ, 83, 23, doi: 10.1086/143697
- Spitler & Forbes (2009) Spitler, L. R., & Forbes, D. A. 2009, MNRAS, 392, L1, doi: 10.1111/j.1745-3933.2008.00567.x
- Sun et al. (2013) Sun, A.-L., Greene, J. E., Impellizzeri, C. M. V., et al. 2013, ApJ, 778, 47, doi: 10.1088/0004-637X/778/1/47
- Szalay & Marx (1976) Szalay, A. S., & Marx, G. 1976, A&A, 49, 437
- Takano et al. (2019) Takano, S., Nakajima, T., & Kohno, K. 2019, PASJ, 40, doi: 10.1093/pasj/psz020
- Tan et al. (2016) Tan, A., Xiao, M., Cui, X., et al. 2016, Phys. Rev. Lett., 117, 121303, doi: 10.1103/PhysRevLett.117.121303
- Taylor et al. (2010) Taylor, E. N., Franx, M., Brinchmann, J., van der Wel, A., & van Dokkum, P. G. 2010, ApJ, 722, 1, doi: 10.1088/0004-637X/722/1/1
- Thornley (1996) Thornley, M. D. 1996, ApJ, 469, L45, doi: 10.1086/310250
- Tiley et al. (2019) Tiley, A. L., Bureau, M., Cortese, L., et al. 2019, MNRAS, 482, 2166, doi: 10.1093/mnras/sty2794
- Toomre (1964) Toomre, A. 1964, ApJ, 139, 1217, doi: 10.1086/147861
- Toomre (1977) —. 1977, Annual Review of Astronomy and Astrophysics, 15, 437, doi: 10.1146/annurev.aa.15.090177.002253
- Toomre (1981) Toomre, A. 1981, in Structure and Evolution of Normal Galaxies; Proceedings of the Advanced Study Institute, Cambridge, England, August 3-15, 1980. (A82-11951 02-90), ed. S. M. Fall & D. Lynden-Bell (Cambridge and New York, Cambridge University Press), 111–136
- Toomre & Kalnajs (1991) Toomre, A., & Kalnajs, A. J. 1991, in Dynamics of Disc Galaxies, Proceedings of the Conference Held 25-30 May 1991 at Varberg Castle, Sweden, ed. B. Sundelius (Göteborgs: Göteborgs University and Chalmers University of Technology), 341
- Treister et al. (2012) Treister, E., Schawinski, K., Urry, C. M., & Simmons, B. D. 2012, ApJ, 758, L39, doi: 10.1088/2041-8205/758/2/L39
- Tremaine et al. (2002) Tremaine, S., Gebhardt, K., Bender, R., et al. 2002, ApJ, 574, 740, doi: 10.1086/341002
- Treuthardt et al. (2012) Treuthardt, P., Seigar, M. S., Sierra, A. D., et al. 2012, MNRAS, 423, 3118, doi: 10.1111/j.1365-2966.2012.21118.x
- Tsoutsis et al. (2008) Tsoutsis, P., Efthymiopoulos, C., & Voglis, N. 2008, MNRAS, 387, 1264, doi: 10.1111/j.1365-2966.2008.13331.x
- Tsoutsis et al. (2009) Tsoutsis, P., Kalapotharakos, C., Efthymiopoulos, C., & Contopoulos, G. 2009, A&A, 495, 743, doi: 10.1051/0004-6361:200810149
- Tully & Fisher (1977) Tully, R. B., & Fisher, J. R. 1977, A&A, 500, 105
- Valluri et al. (2016) Valluri, M., Shen, J., Abbott, C., & Debattista, V. P. 2016, ApJ, 818, 141, doi: 10.3847/0004-637X/818/2/141
- van den Bergh (1960a) van den Bergh, S. 1960a, ApJ, 131, 215, doi: 10.1086/146821
- van den Bergh (1960b) —. 1960b, ApJ, 131, 558, doi: 10.1086/146869
- van den Bosch (2000) van den Bosch, F. C. 2000, ApJ, 530, 177, doi: 10.1086/308337
- van Dokkum et al. (2013) van Dokkum, P. G., Leja, J., Nelson, E. J., et al. 2013, ApJ, 771, L35, doi: 10.1088/2041-8205/771/2/L35
- van Uitert et al. (2013) van Uitert, E., Hoekstra, H., Franx, M., et al. 2013, A&A, 549, A7, doi: 10.1051/0004-6361/201220439
- van Wassenhove et al. (2010) van Wassenhove, S., Volonteri, M., Walker, M. G., & Gair, J. R. 2010, MNRAS, 408, 1139, doi: 10.1111/j.1365-2966.2010.17189.x
- Vika et al. (2009) Vika, M., Driver, S. P., Graham, A. W., & Liske, J. 2009, MNRAS, 400, 1451, doi: 10.1111/j.1365-2966.2009.15544.x
- Vogelsberger et al. (2014) Vogelsberger, M., Genel, S., Springel, V., et al. 2014, MNRAS, 444, 1518, doi: 10.1093/mnras/stu1536
- Voglis et al. (2006a) Voglis, N., Stavropoulos, I., & Kalapotharakos, C. 2006a, MNRAS, 372, 901, doi: 10.1111/j.1365-2966.2006.10914.x
- Voglis et al. (2006b) Voglis, N., Tsoutsis, P., & Efthymiopoulos, C. 2006b, MNRAS, 373, 280, doi: 10.1111/j.1365-2966.2006.11021.x
- Volonteri et al. (2011) Volonteri, M., Natarajan, P., & Gültekin, K. 2011, ApJ, 737, 50, doi: 10.1088/0004-637X/737/2/50
- von der Pahlen (1911) von der Pahlen, E. 1911, Astronomische Nachrichten, 188, 249, doi: 10.1002/asna.19111881502
- Walker (1999) Walker, M. A. 1999, MNRAS, 308, 551, doi: 10.1046/j.1365-8711.1999.02814.x
- Wang et al. (2013) Wang, L., Farrah, D., Oliver, S. J., et al. 2013, MNRAS, 431, 648, doi: 10.1093/mnras/stt190
- Watson et al. (1996) Watson, A. M., Gallagher, III, J. S., Holtzman, J. A., et al. 1996, AJ, 112, 534, doi: 10.1086/118032
- Weiner et al. (2006) Weiner, B. J., Willmer, C. N. A., Faber, S. M., et al. 2006, ApJ, 653, 1049, doi: 10.1086/508922
- Whitmore & Kirshner (1981) Whitmore, B. C., & Kirshner, R. P. 1981, ApJ, 250, 43, doi: 10.1086/159346
- Whitmore et al. (1979) Whitmore, B. C., Kirshner, R. P., & Schechter, P. L. 1979, ApJ, 234, 68, doi: 10.1086/157473
- Williams et al. (2009) Williams, M. J., Bureau, M., & Cappellari, M. 2009, in Astronomical Society of the Pacific Conference Series, Vol. 419, Galaxy Evolution: Emerging Insights and Future Challenges, ed. S. Jogee, I. Marinova, L. Hao, & G. A. Blanc, 167
- Xiao et al. (2011) Xiao, T., Barth, A. J., Greene, J. E., et al. 2011, ApJ, 739, 28, doi: 10.1088/0004-637X/739/1/28
- Yang et al. (2012) Yang, X., Mo, H. J., van den Bosch, F. C., Zhang, Y., & Han, J. 2012, ApJ, 752, 41, doi: 10.1088/0004-637X/752/1/41
- Yu & Ho (2019) Yu, S.-Y., & Ho, L. C. 2019, ApJ, 871, 194, doi: 10.3847/1538-4357/aaf895
- Yuan et al. (2017) Yuan, T., Richard, J., Gupta, A., et al. 2017, ApJ, 850, 61, doi: 10.3847/1538-4357/aa951d
- Zahid et al. (2016) Zahid, H. J., Geller, M. J., Fabricant, D. G., & Hwang, H. S. 2016, ApJ, 832, 203, doi: 10.3847/0004-637X/832/2/203
- Zasov et al. (2005) Zasov, A. V., Petrochenko, L. N., & Cherepashchuk, A. M. 2005, Astronomy Reports, 49, 362, doi: 10.1134/1.1923545
- Zhang & Wyse (2000) Zhang, B., & Wyse, R. F. G. 2000, MNRAS, 313, 310, doi: 10.1046/j.1365-8711.2000.03211.x
- Zubovas & King (2019) Zubovas, K., & King, A. 2019, MNRAS, 484, 1829, doi: 10.1093/mnras/stz105
- Zwicky (1933) Zwicky, F. 1933, Helvetica Physica Acta, 6, 110
- Zwicky (1937) —. 1937, ApJ, 86, 217, doi: 10.1086/143864