The nature of sub-millimeter and highly star-forming galaxies in the eagle simulation
Abstract
We exploit eagle, a cosmological hydrodynamical simulation, to reproduce the selection of the observed sub-millimeter (submm) galaxy population by selecting the model galaxies at with mock submm fluxes mJy (computed in post processing using radiative transfer techniques). There is a reasonable agreement between the galaxies within this sample and the properties of the observed submm population, such as their star formation rates (SFRs) at , redshift distribution and many integrated galaxy properties. We find that the bulk of the mJy model population is at , and that they are massive galaxies ( M⊙) with high dust masses ( M⊙), gas fractions (%) and SFRs ( M⊙ yr-1). They have major and minor merger fractions similar to the general population, suggesting that mergers are not the primary driver of the model submm galaxies. Instead, the mJy model galaxies yield high SFRs primarily because they maintain a significant gas reservoir as a result of hosting an undermassive black hole. In addition, we find that not all ‘highly star-forming’ ( M⊙ yr-1) eagle galaxies have submm fluxes mJy. Thus, we investigate the nature of highly star-forming ‘Submm-Faint’ galaxies (i.e., M⊙ yr-1 but mJy). We find they are similar to the model submm galaxies; being gas rich and hosting undermassive black holes, however they are typically lower mass ( M⊙) and are at higher redshifts (). These typically higher-redshift galaxies show stronger evidence for having been triggered by major mergers, and critically, they are likely missed by current submm surveys due to their higher dust temperatures. This suggests a potentially even larger contribution to the SFR density at from dust-obscured systems than implied by current observations.
keywords:
galaxies: active, galaxies: evolution, galaxies: formation, galaxies: high-redshift, galaxies: starburst1 Introduction
Sub-millimeter (submm) galaxies (SMGs) are a population of high-redshift galaxies (–5) which are inferred to have high star-formation rates (SFRs, 100 M⊙ yr-1) and significant dust masses ( M⊙). The luminous submm emission arises from the reprocessing of the ultraviolet (UV) light from young stars by obscuring dust (see Casey et al., 2014 for a review). SMGs are relatively rare, with a number density of cMpc-3 at 2–3 (e.g., Chapman et al., 2005; Simpson et al., 2014). However, this population is particularly interesting due to the apparently high levels of star formation and the many open questions that remain to be answered about their formation and evolution. For example: What triggers such extreme SFRs, mergers or secular disk instabilities? How long can these galaxies form stars at such apparently high rates, and what terminates it? How do they evolve following the starburst episode? What are their descendants at ? Many of these questions cannot be answered directly by the observations, however, by combining the observational data with advanced numerical simulations, they can begin to be addressed.
Previous comparisons of models with observations of this galaxy population have highlighted an apparent problem with current theories of galaxy formation (e.g., Baugh et al., 2005; Swinbank et al., 2008; Davé et al., 2010; Hayward et al., 2013). These models generally have difficulty in matching the observed SFRs or submm number counts of SMGs while maintaining agreement with other observations of the wider galaxy population. A number of solutions have been proposed for this discrepancy; including a top-heavy initial mass function (IMF), the unaccounted for blending of multiple galaxies into a single submm source in the observations, or the inability of hydrodynamical simulations to adequately resolve intense starbursts (leading to an underestimate in the SFR). However, recently the necessity of a radical solution to the discrepancy has perhaps weakened since higher resolution observational data has become available (e.g., Karim et al., 2013; Simpson et al., 2015; Cowie et al., 2018), which now resolves the blending of multiple SMGs into a single source (e.g., Cowley et al., 2015).
In this study we investigate the prevalence of submm and highly star-forming galaxies in the largest simulation of the eagle project (Crain et al., 2015; Schaye et al., 2015; McAlpine et al., 2016). This simulation was calibrated to reproduce the observed galaxy stellar mass function, the sizes of galaxies and the black hole–stellar mass relation at . Many other observed galaxy trends have also shown broad agreement with observations, both locally (e.g., Schaye et al., 2015; Trayford et al., 2015; Lagos et al., 2015; Bahé et al., 2016) and at higher redshift (e.g., Furlong et al., 2015; Rahmati et al., 2015; Furlong et al., 2017; McAlpine et al., 2017). Predictions from the simulation for the full model galaxy population are reasonably representative of the observed Universe. As a result, this simulation presents an interesting testbed for more extreme populations, such as those galaxies with the highest SFRs and the SMG population. Observationally it is claimed that these two populations strongly overlap. We can test this in our model, by selecting the samples independently.
This paper is organised as follows: In §2 we provide a brief overview of the eagle simulation and discuss the sample selections. In §3.1 we compare our sample of submm-selected model galaxies to the observed submm population. We then examine the nature and triggering of the highly star-forming/submm model galaxies in §3.2 and their descendants at in §3.3. Finally, in §4 we present a summary and our concluding remarks.
2 The eagle simulation
eagle (“Evolution and Assembly of GaLaxies and their Environment”, Schaye et al., 2015; Crain et al., 2015) 111www.eaglesim.org,222The galaxy and halo catalogues of the simulation suite, as well as the particle data, are publicly available at http://www.eaglesim.org/database.php (McAlpine et al., 2016; The EAGLE team, 2017). is a suite of cosmological smoothed particle hydrodynamics (SPH) simulations that cover a range of periodic volumes, numerical resolutions and physical models. To incorporate the processes that operate below the simulation resolution a series of ‘subgrid’ prescriptions are implemented, namely: radiative cooling and photo-ionisation heating (Wiersma et al., 2009a); star formation (Schaye & Dalla Vecchia, 2008), stellar mass loss (Wiersma et al., 2009b) and stellar feedback (Dalla Vecchia & Schaye, 2012); black hole growth via accretion and mergers, and black hole feedback (Springel et al., 2005; Schaye et al., 2015; Rosas-Guevara et al., 2016). The free parameters of these models are calibrated to reproduce the observed galaxy stellar mass function, galaxy sizes and black hole mass–bulge mass relation at . A full description of the simulation and the calibration strategy can be found in Schaye et al. (2015) and Crain et al. (2015), respectively.
For this study we are interested in the most strongly star-forming ( M⊙ yr-1) and submm luminous (i.e., those with mock fluxes mJy) galaxies, and therefore restrict our study to the largest simulation, Ref-L0100N1504, which contains the greatest number of these objects. This simulation is a cubic periodic volume 100 comoving megaparsecs (cMpc) on each side, sampled by dark matter particles of mass M⊙ and an equal number of baryonic particles with an initial mass of M⊙. The subgrid parameters are those of the eagle reference model, described fully by Schaye et al. (2015). The simulation adopts a flat CDM cosmogony with parameters inferred from analysis of Planck data (Planck Collaboration et al., 2014): 0.693, 0.307, 0.048, 0.8288, 0.9611 and 67.77 km s-1 Mpc-1. A Chabrier (2003) stellar initial mass function (IMF) is adopted. Unless otherwise stated, error estimates are from a bootstrap analysis.
2.1 Simulation output
The complete state of the simulation is stored at 29 intervals between redshifts and , which we refer to as ‘snapshots’. In order to produce a halo and galaxy catalogue from these, the dark matter structure finding algorithm “Friends of Friends” and the substructure finding algorithm subfind (Springel et al., 2001; Dolag et al., 2009) are performed.
Halo mass, , is defined as the total mass enclosed within , the radius at which the mean enclosed density is 200 times the critical density of the Universe. Galaxy mass, , is defined as the total stellar content bound to a subhalo within a spherical aperture with radius 30 proper kiloparsecs (pkpc), as per Schaye et al. (2015). The sizes of galaxies are quoted in physical units, unless stated otherwise.
2.1.1 Merger trees
Galaxies are tracked from their creation to the present day using a merger tree. Due to the hierarchical build-up, each galaxy today has many progenitors, therefore the history of each galaxy is considered from the reference frame of their ‘main progenitor’, the branch of the galaxy’s full merger tree that contains the greatest total mass (see Qu et al., 2017 for full details).
Using these merger trees, the merger history of a galaxy can be established. We define the completion time of a galaxy merger with the main-progenitor galaxy to be the cosmic time at the first simulation output where the two galaxies are now identified as a single bound object by the subfind algorithm. Mergers are classified by their stellar mass ratio, , where is the mass of the most massive member of the binary. They are considered major if , minor if and either major or minor if . To account for the stellar stripping that occurs during the later stages of the interaction, the stellar mass ratio is computed when the in-falling galaxy had its maximum mass (e.g., Rodriguez-Gomez et al., 2015; Qu et al., 2017). Additionally, mergers are only considered ‘resolved’ when M⊙ ( stellar particles), but this doesn’t effect the results here, where we focus on much more massive galaxies.
2.1.2 Obtaining accurate star-formation histories of eagle galaxies
The reported ‘instantaneous’ SFR of an eagle galaxy is computed from the current state of the galaxy’s associated gas particles. However, it is also possible to reverse engineer the SFR of a galaxy at a given time from the galaxy’s associated stellar particles at 333Note that only the stellar particles born within the main-progenitor (see Section 2.1.1) galaxy are considered, as to avoid combining the SFR histories of multiple progenitors.. By collectively binning the stellar particles in the galaxy at by their birth time, weighting by their initial mass and dividing by the bin width, a robust SFR history is obtained, which is only limited in resolution by the total number of stellar particles sampled (i.e., the galaxy stellar mass at ). For galaxies more massive than M⊙ this can adequately resolve the SFR history down to intervals of Myr, which achieves orders of magnitude better sampling than from the snapshot output. This method can be used to accurately study the SFR histories of individual galaxies (for example Figure 1 from McAlpine et al., 2017), or simply as a method to obtain the maximum SFR ever achieved by a galaxy throughout its lifetime.
2.1.3 Absolute calibration of SFRs
When comparing to the observed cosmic SFR density, Furlong et al. (2015) found an almost constant 0.2 dex offset for redshifts . There is, however, continued uncertainty as to the absolute calibration of SFR indicators on which these observations rely. For example, Chang et al. (2015) find upon revisiting this calibration with the addition of WISE photometry to the full SDSS spectroscopic galaxy sample that the SFRs of typical local galaxies are systematically lower than previously estimated by dex, yielding better agreement with the eagle prediction (see Figure 5 of Schaller et al., 2015).
As the observational datasets compared to in Section 3.1 utilise an earlier calibration, we reduce all observed SFRs by 0.2 dex. This serves to remove the known global systematic offset, making it simpler to focus on the trends with the observed submm population that are the topic of this paper.
2.1.4 Mock observables
The light emitted within a galaxy is subject to attenuation by dust in the interstellar medium (ISM). To accurately produce the observable properties of the model galaxies, we solve the three-dimensional radiative transfer problem in post-processing using information from the galaxy’s star-forming regions, stellar sources, and diffuse dust distribution using the radiative transfer code skirt (Baes et al., 2011; Camps & Baes, 2015), as is detailed by Camps et al. (2018). This process infers the mock observables from the UV to the submm wavebands444The rest-frame magnitudes and observer-frame fluxes for all eagle galaxies with stellar masses greater than M⊙ are publicly available (Camps et al., 2018).. The free parameters in the radiative transfer model555Notably for the dust distribution: , the fraction of the metallic gas locked up in dust (assumed to be ); and , the highest temperature at which gas contains dust (assumed to be 8000K, see Camps et al., 2016). have been calibrated to reproduce far-infrared observables from the Herschel Reference Survey (Boselli et al., 2010) in the local Universe. Given the weaker observational constraints for these parameters at higher redshifts, the values obtained locally are applied to the galaxies at all redshifts, however this is likely to be an oversimplification (see Camps et al., 2016; Trayford et al., 2017 for more details).
2.2 Sample selection
The primary motivation for this study is to infer the nature of the observed SMG population using analogues from the simulation. With the advent of ALMA the properties of the observed submm population are becoming better constrained, with the bulk of the population found at higher redshifts (, e.g., Simpson et al., 2014); as are the majority of highly star-forming sources found through other multi-wavelength selection techniques ( M⊙ yr-1, e.g., Madau & Dickinson, 2014). For simplicity, in this study we therefore concentrate our analysis on the submm and highly star-forming model galaxies from the simulation above , where the vast majority of the observational constraints on these populations exist. We will return to the submm properties of low-redshift () galaxies in a future study.
2.2.1 Sample 1: mJy galaxies
We select galaxies with mock submm fluxes greater than 1 mJy ( mJy). This cut broadly reflects the definitions in the literature for highly star-forming sources derived from the recent ALMA studies (e.g., Simpson et al., 2014; Cowie et al., 2018), and produces a selection of 62 mJy model galaxies in eagle at .
2.2.2 Sample 2: highly star-forming Submm-Faint galaxies
The observed submm population is synonymous with high SFRs ( M⊙ yr-1), which is also true for the model galaxies in the mJy sample (see Section 3.1.1). Yet it is interesting to ask if the reverse also holds, that is, are all ‘highly star-forming’ sources bright in the submm? To test this, we select the most highly star-forming galaxies in the simulation at , adopting a space density which is representative of the limits on highly star-forming populations derived from a variety of observational techniques. There is, however, considerable uncertainly in this quantity observationally. For example, surveys which select sources on the basis of their mid- or far-infrared luminosity (as a proxy for their SFR) have reported space densities of to cMpc-3 for galaxies with far-infrared luminosities of L⊙ and inferred SFRs of M⊙ yr-1 at 1.5–2.5 (e.g., Chapman et al., 2005; Magnelli et al., 2011; Casey et al., 2012; Gruppioni et al., 2013; Swinbank et al., 2014; Koprowski et al., 2017). However, these studies suffer from a combination of AGN contamination of the derived luminosities (a particular problem in the mid-infrared, e.g., Kirkpatrick et al., 2012, 2015; Del Moro et al., 2013), or blending and misidentification of the correct galaxy counterparts in low-resolution far-infrared and sub-millimeter surveys (e.g., Hodge et al., 2013; Simpson et al., 2014).
Given the range and uncertainties in the various estimates of the space density for highly star-forming galaxies from the observations, we have chosen to select an equivalent SFR limit which roughly corresponds to the space densities derived from the observations ( to cMpc-3) and which allows us to isolate a sufficiently large sample ( galaxies) of highly star-forming galaxies to allow for a statistical analysis. Our adopted SFR limit is M⊙ yr-1, which corresponds to a space density of star-forming galaxies in eagle of cMpc-3 at , and returns a sample of 84 galaxies.
We find, perhaps surprisingly, that only 32% of the galaxies at with a SFR M⊙ yr-1 have mock submm fluxes mJy, implying that a large number of highly star-forming galaxies in the Universe may not be detected by the current submm surveys. For this reason, we additionally investigate the nature of highly star-forming galaxies ( M⊙ yr-1) that are ‘Submm-Faint’ ( mJy), to see how, if at all, these galaxies differ from the mJy population. This will also reveal what subset of highly star-forming galaxies is selected by the submm surveys.
We note, that we have repeated the analysis of this study for highly star-forming mJy galaxies (i.e., adding the additional M⊙ yr-1 criterion to define the mJy sample), however the results were almost identical to those found for the mJy only sample (as the majority of these galaxies are naturally above M⊙ yr-1). We remain with the pure submm-selected sample for this study as it most closely reflects that of the observations.
3 Results
3.1 A comparison of simulated and observed SMGs
We begin with a comparison between the model galaxies in the mJy sample and the results from a variety of submm observations. Here, our aim is to establish if a submm selection applied to eagle serves to extract a population similar to that seen in the real Universe.
In the following, we will compare to the observed SMG population focusing on the first large ALMA-selected sample from the ALESS survey (Hodge et al., 2013). Subsequent analysis and study of the SMGs in this survey have provided a variety of empirical constraints on their natures, which we can compare to our model predictions (e.g., Simpson et al., 2014; da Cunha et al., 2015). We also make use of the earlier survey of Chapman et al. (2005) when discussing certain aspects, such as gas or black hole properties (e.g., Alexander et al., 2008; Bothwell et al., 2013).
3.1.1 Star-formation rates
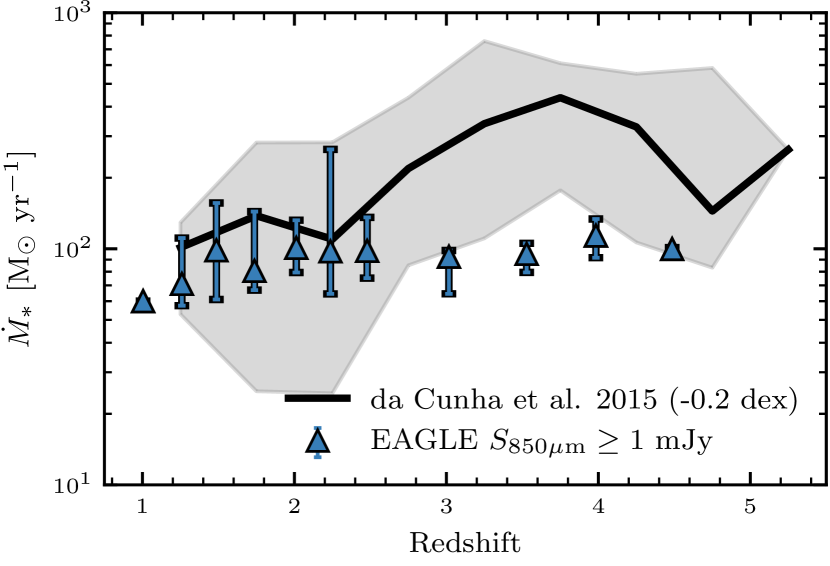
The SFRs inferred for the observed submm population are high ( M⊙ yr-1), which provides a good initial test for our model population. Figure 1 shows the median SFR () as a function of redshift for both the model galaxies in the mJy sample and the observed SMGs from Hodge et al. (2013) as analysed by da Cunha et al. (2015).
Overall, the SFRs of the mJy model galaxies are high ( M⊙ yr-1), yielding a relatively constant median value between 70–100 M⊙ yr-1 for all redshifts, and a maximum SFR of 294 M⊙ yr-1 produced by a galaxy at . This confirms that a purely submm-selected sample of model galaxies does only return high SFR sources. When compared to the SFRs inferred from the observations, there is good agreement at where the bulk of the model and observed population lie, however, a discrepancy appears above , where the SFRs of the mJy model galaxies are a factor of lower than those inferred from observations. It is important to stress, however, that most of the observed and simulated submm galaxies exist below (%, see next section), where there is good agreement between the SFRs from the two populations.
3.1.2 Redshift distribution
The spectroscopic redshifts for large surveys of observed SMGs suggest that this population is most abundant at redshift –3 (e.g., Chapman et al., 2005; Danielson et al., 2017). However these are incomplete, and so here we compare the redshift distribution of the model galaxies in the mJy sample against the statistically corrected sample of observed SMGs using photometric estimates from Simpson et al. (2014).
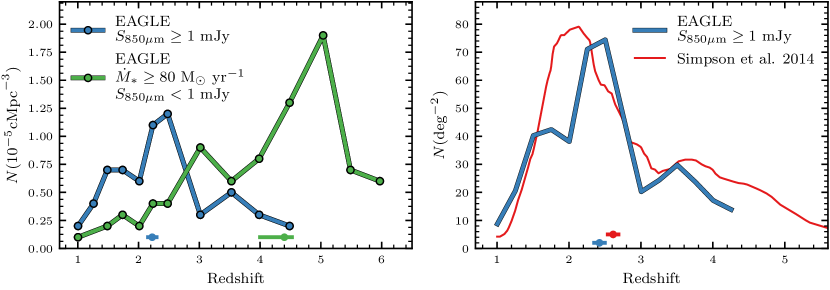
Figure 2 shows the volume number density of the model mJy galaxies at each simulation snapshot. It indicates that this population is most abundant at (with a number density of cMpc-3), and is rarer towards both lower and higher redshift (cMpc-3 at redshifts of and ). To provide a measurement that is more easily comparable to the observations, Figure 2 also shows the area number density (or counts) of the model mJy galaxies. To compare, we over-plot the redshift distribution of observed SMGs from Simpson et al. (2014). Encouragingly, the model mJy galaxies yield a similar shape and median value ( compared to ) as the observations. Yet, whilst the overall behaviour between the two samples appears consistent (a peaked distribution that decays towards lower and higher redshift), the location of the peak for the model mJy galaxies is slightly higher than is seen by the observations ( compared to )
3.1.3 Galaxy and halo properties
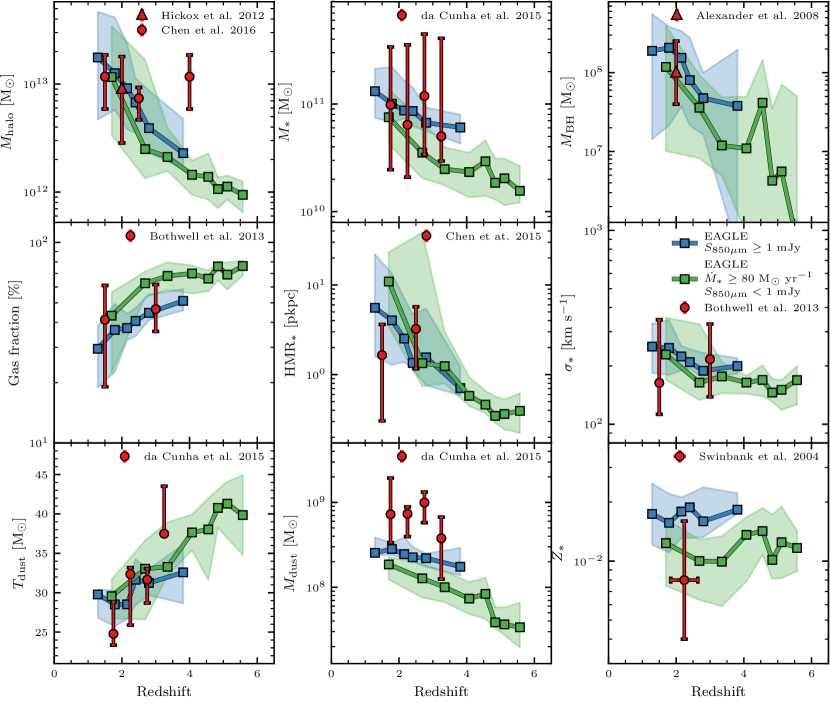
Next, in Figure 3 we compare a variety of properties of the model galaxies in the mJy sample against a the observed population. Each property is plotted as a function of redshift, and shows: the halo mass (), the stellar mass (), the central supermassive black hole mass (), the total gas fraction (), the stellar half-mass radius (HMR∗), the stellar velocity dispersion666The one dimensional velocity dispersion of the stars, see Table B.1 from McAlpine et al. (2017). (), the dust mass (), the dust temperature () and the stellar metallicity (). The values and associated errors for the properties of the model galaxies quoted below are the median and the 1 uncertainties on the median, respectively (these values are tabulated in Table 1).
The model mJy galaxies reside in halos of mass M⊙, have stellar masses of ( M⊙ and host black holes of mass M⊙ at redshift . These values agree well with the observed clustering halo mass estimates from Hickox et al. (2012) and Chen et al. (2016), the stellar mass estimates from da Cunha et al. (2015) and the black hole mass estimates from Alexander et al. (2008), respectively. The total gas fractions (% at ), stellar sizes ( pkpc at ) and velocity dispersions ( km s-1 at ) yield reasonable agreements for a range of redshifts to the observations from Bothwell et al. (2013), Chen et al. (2015) and Bothwell et al. (2013), respectively. The dust temperatures ( K at ) match well to the observations from da Cunha et al. (2015) for a range of redshifts, however there is a systematic discrepancy at all redshifts between the dust masses (again from da Cunha et al., 2015) predicted by the model (( M⊙ at ) and the observations, with the observed submm galaxies containing 3–4 times more dust than the model galaxies. Finally, the metallicities ( at ) are potentially up to a factor of higher than those estimated by Swinbank et al. (2004), but are consistent to within the errorbars.
Although the observational uncertainties are typically large (often larger than the predicted scatter from the model), the model galaxies within the mJy sample are in reasonable agreement with a variety of measurements from a variety of observations of submm-selected galaxies.
3.2 The nature of mJy galaxies and highly star-forming Submm-Faint galaxies
Given the broad agreement in the comparisons to the observed submm population above, we are encouraged to exploit the sample of mJy model galaxies in an attempt to answer the questions that the observations cannot easily address; such as the origin, evolution and eventual fate of the submm population. In a parallel analysis, we investigate the nature of the highly star-forming galaxies that do not make it into the mJy sample (i.e., M⊙ yr-1 but mJy), to better understand what subset of high-SFR galaxies a submm selection extracts.
It is important to remind the reader for this section, that the model galaxies in the mJy sample are substantially more abundant than the model galaxies in the highly star-forming Submm-Faint sample at intermediate redshift (), whereas the galaxies in the highly star-forming Submm-Faint sample are substantially more abundant than the galaxies in the mJy sample at higher redshift (, see Figure 2). Therefore, whilst we can compare the properties of the two model populations at a given redshift, the relative number density of galaxies between the two populations at the given redshift may be considerably different.
3.2.1 Comparison to the general population
We first investigate how the properties of the model galaxies in our two samples compare to the general model population. That is, what unique features do the mJy and highly star-forming Submm-Faint galaxies exhibit that distinguish them from ‘typical’ model galaxies of their mass?
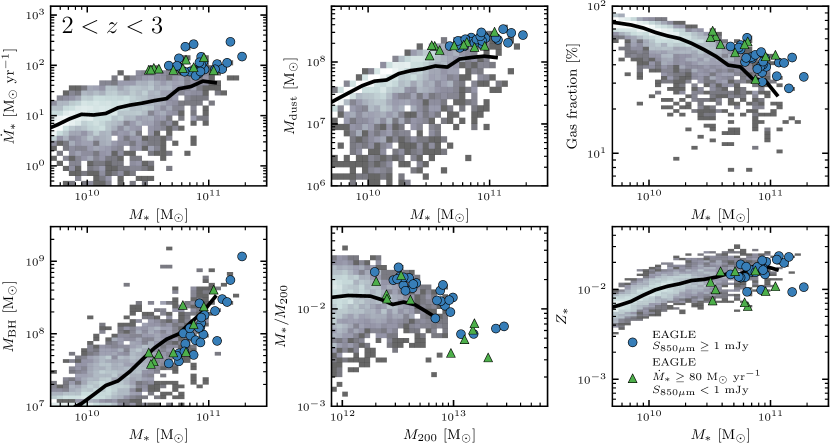
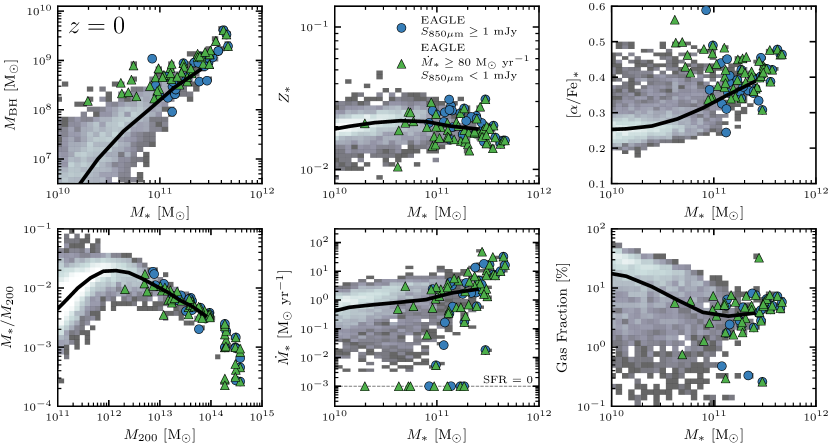
Figure 4 shows the SFR, dust mass, total gas fraction, central supermassive black hole mass, stellar mass to halo mass ratio () and the stellar metallicity of the galaxies in the mJy and highly star-forming Submm-Faint samples, each plotted as a function of either the stellar or halo mass. For clarity, we only show the model galaxies in the redshift range –3, as these epochs contain the greatest number of sources between our two samples (see Figure 2). We note, that only the integrated properties of central galaxies are shown in this figure (the galaxies contained within both the mJy and highly star-forming Submm-Faint samples are almost exclusively centrals at these times).
Upon first inspection, it is clear that the galaxies across both samples are among the most massive in the model universe, yet, as was indicated previously in Figure 3, there is a preference for the mJy galaxies to be more massive (a median stellar mass of M⊙ for the mJy sample compared to M⊙ for the highly star-forming Submm-Faint sample). By construction, each sample is probing the galaxies with the highest SFRs for their stellar mass, all lying well above the median trend, which is inextricably linked to their high dust masses and gas fractions. The two model populations also show evidence of hosting black holes that are undermassive for galaxies of their stellar masses, and the mJy model galaxies are high in their stellar masses for their halo masses. Finally, the stellar metallicities of the model galaxies within each sample appear consistent with the median trend of the general population, although there is a hint that the galaxies from the highly star-forming Submm-Faint sample have metallicities lower than expected for their stellar mass.
Therefore the model galaxies in both the mJy and highly star-forming Submm-Faint samples do not appear as ‘typical’ star-forming galaxies in the simulation; they are massive, unusually gas and dust rich galaxies that host undermassive black holes. A simple explanation is that the two model populations comprise the most massive galaxies who, for one reason or another, host an undermassive black hole. This is consistent with the results presented by Matthee & Schaye (2018), who find that the relative efficiently of black hole growth contributes to the scatter in the high-mass end of the star-forming sequence in the eagle simulation. Such an undermassive black hole would allow the model galaxies to retain a greater amount of gas in their centres due to a decreased cumulative amount of AGN feedback. In addition, having stellar masses which are high for their halo masses suggests that the mJy model galaxies are undergoing a somewhat prolonged period of high SFRs, whereas the highly star-forming Submm-Faint population have potentially initiated their starburst much more recently. This would be consistent with the highly star-forming Submm-Faint galaxies having lower stellar metallicities.
3.2.2 The evolution in the integrated properties for the mJy and highly star-forming Submm-Faint galaxies
Relative to the the median trend of the general population, the mJy and highly star-forming Submm-Faint galaxies always have high SFRs, dust masses and gas fractions for their stellar masses (see Figure 4). However, the typical values of the integrated properties for the mJy and highly star-forming Submm-Faint galaxies do evolve as a function of redshift, as was shown in Figure 3.
In general, the mJy galaxies at higher redshift are less massive, have higher gas fractions, are more compact and have higher dust temperatures relative to their lower-redshift counterparts. These trends also broadly represent the evolution of the properties of the galaxies in the highly star-forming Submm-Faint sample. Yet, although the trends are similar, the median values of the two populations are commonly offset from one another at a given redshift. For example; the halo, stellar and black hole masses of the highly star-forming Submm-Faint galaxies are a factor of 2–4 times lower than the mJy galaxies (see Figure 3), they are additionally more gas rich and more metal poor (both by up to a factor of ), their dust temperatures are a few degrees higher, and their dust masses are a factor of lower.
It appears, therefore, that the model galaxies that make up the two populations are different in several aspects, potentially suggesting two alternate formation processes. The galaxies from the highly star-forming Submm-Faint subset are, on average; lower mass, more gas rich, more metal poor, contain less and slightly warmer dust, host lower mass black holes and preferentially exist at higher redshifts (see Figure 2) than the galaxies from the mJy subset. Regardless of their classification, however, the galaxies from both samples are always the most gas rich and typically the most massive at their respective redshifts.
3.2.3 Merger fractions
Galaxy–galaxy mergers and interactions provide one potential triggering mechanism for starbursting galaxies: the induced tidal field disturbs any regular orbits of the gas, funnels material inward towards the galaxy centre, and triggers star formation (e.g., Barnes & Hernquist, 1991; Mihos & Hernquist, 1996). It is reasonable to assume, therefore, that such interactions may be responsible for creating the observed submm and highly star-forming galaxy populations, which we test here.
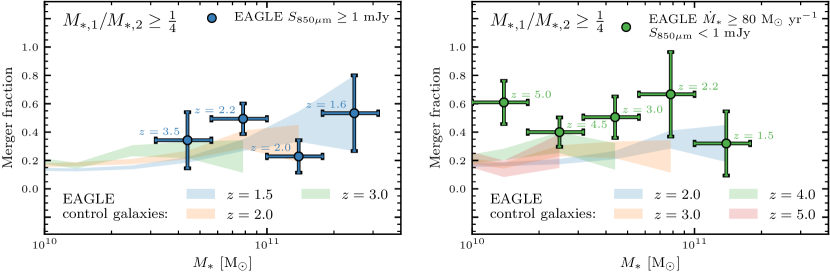
In Figure 5 we investigate the major merger fraction, defined as the fraction of galaxies that have completed or will complete a major merger ( ) within the previous/next dynamical time777Equivalent to from eq. 1 in McAlpine et al. (2018), where is the number of dynamical times to the nearest galaxy–galaxy merger with a stellar mass ratio . The dynamical time, , is defined as the free fall time of the dark matter halo ( 1.6 Gyr at , 0.5 Gyr at and 0.2 Gyr at ), see Section 2.3 from McAlpine et al. (2018)., as a function of the stellar mass. The major merger fractions are shown separately for the model mJy galaxies and the model highly star-forming Submm-Faint galaxies, with the merger fractions for all model galaxies in the simulation at a given redshift shown as shaded regions, acting as our control. Due to their limited size, we only divide the two samples into bins of stellar mass and not also by redshift, realising that the merger fraction of galaxies for a fixed stellar mass increases with increasing redshift (e.g., Rodriguez-Gomez et al., 2015; Qu et al., 2017). However, this effect is accounted for in part by expressing the merger fraction using a set number of dynamical times instead of using a fixed time interval. In addition, separating the galaxies by their stellar masses also acts to separate them by their redshift, as is indicated by the highlighted median redshift of the galaxies in each stellar mass bin (see also Figure 3). Yet, there could remain a further dependence on the importance of mergers in creating the mJy/highly star-forming Submm-Faint populations with redshift (potentially similar to the discovered redshift dependence on mergers for triggering the rapid growth phase of black hole growth in the eagle simulation, see McAlpine et al., 2018).
We find no strong trend in the major merger fraction with stellar mass for either the mJy or highly star-forming Submm-Faint samples. The major merger fractions of the mJy galaxies are consistent with those of the general model population, suggesting that major mergers are not a required triggering mechanism for the model SMGs. What appears to be more important, therefore, is that they have a large gas reservoir and host an undermassive black hole (see Section 3.2.1). By contrast, the major merger fractions of the highly star-forming Submm-Faint galaxies are typically higher than those of the general population (particularly at the lowest stellar masses, M⊙, where the enhancement is a factor of ), suggesting that major mergers are important in triggering this galaxy subset.
We note, that whilst the merger fractions universally increase in the case of minor mergers ( ) and either major or minor mergers ( ), the merger fractions of the mJy galaxies are always similar to those of the general population. An enhancement in the merger fraction above the control galaxies for the highly star-forming Submm-Faint population exists for all merger classifications, however the enhancement is greatest in the case of major mergers.
3.3 The descendants of mJy galaxies and highly star-forming Submm-Faint galaxies at
We conclude our analyses by investigating the descendants of the galaxies in both samples at . Here we are asking the following: What fraction of today’s galaxies have undergone a mJy or highly star-forming Submm-Faint phase in their past? Do the galaxies in either of the two samples retain any signatures that could allow them to be identified in today’s parameter space? What fraction of the total in situ mass formed within the galaxies from the two samples was formed during high SFR events?
Figure 6 shows the central supermassive black hole mass, stellar metallicity, alpha-enhancement ([/Fe]∗888We define alpha-enhancement following eq. 1 from Segers et al. (2016), where we use [O/Fe]∗ as a proxy for [/Fe]∗.), stellar mass to halo mass ratio, SFR and total gas fraction, each plotted as a function of either the stellar or halo mass. The general population of model galaxies is shown as a two-dimensional histogram and the descendants of the mJy and highly star-forming Submm-Faint model galaxies are highlighted individually.
3.3.1 The fraction of today’s galaxies that were once highly star forming
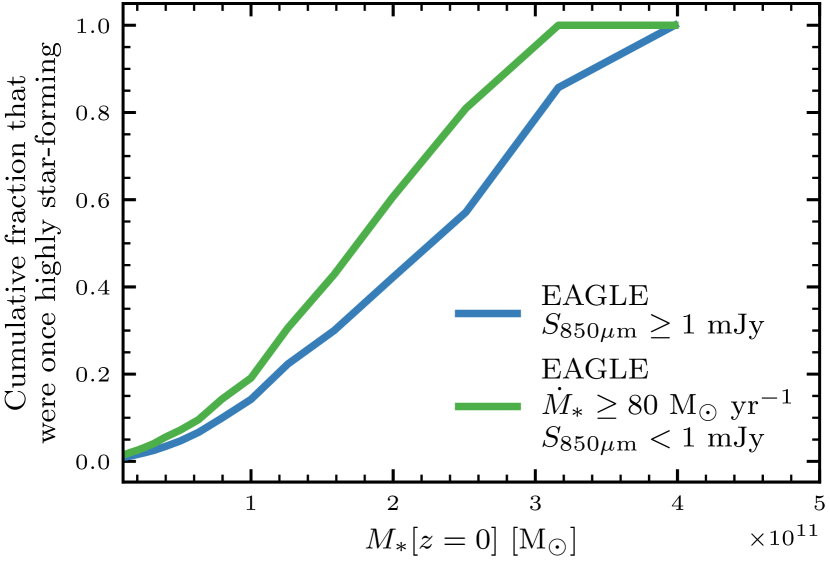
The clearest distinguishing feature seen in the descendants from Figure 6, which was also true at the times when they were selected (see Figure 4), is that they are typically massive (with median masses of M⊙ and M⊙ and M⊙ and M⊙ for the mJy and highly star-forming Submm-Faint samples, respectively). Yet, not all massive galaxies today were once highly star forming. To quantify this more clearly, we introduce Figure 7, which shows the cumulative fraction of the galaxies at , as a function of the stellar mass, that were ever either mJy or highly star-forming and Submm-Faint in their past (i.e., the cumulative fraction of today’s population that are the descendants of the galaxies within either sample). We see a rapid decline in the cumulative fraction for both classifications as the stellar mass decreases; from 100% of galaxies above M⊙ to just % of the galaxies above M⊙ 999We note that a given galaxy at could have been both mJy and highly star-forming and Submm-Faint at different points in its history. Thus the sum of the cumulative fractions between the two samples can exceed 1.. We note that these fractions serve as a lower limit, as it is unlikely that all instances of galaxies in a high SFR phase can be captured by the temporal spacing’s of the simulation snapshots. However, by considering the galaxies today that were ever once highly star-forming (i.e., if they were ever above M⊙ yr-1 in their past, obtained by examining accurate SFR histories, see Section 2.1.2), we find the temporal spacing of the snapshots is sufficient to capture % of high SFRs events, making for an almost complete sample.
Therefore, with the exception of the galaxies with the highest stellar masses (– M⊙), it is rare for a given galaxy today to of been either mJy or highly star-forming and Submm-Faint in its past, particularly at lower stellar masses ( M⊙).
3.3.2 The descendants in today’s parameter space
Now we ask what characteristics (at a fixed mass) may be imprinted upon the descendants of the mJy and highly star-forming submm faint galaxies that could potentially distinguish them from the general population of galaxies at .
For many of the integrated properties shown in Figure 6, and for the majority of the integrated properties we have explored, we do not find that the descendants of the galaxies in the mJy and highly star-forming Submm-Faint samples are distinguishable from the general population at (that is, they lie on or around the median trend for galaxies of their stellar/halo masses). For example, they have the expected stellar masses for their halo masses, and the expected sizes, SFRs and total gas fractions for their stellar masses. In fact, for the mJy population, no property appears obviously offset away from the median trends of the general population at a given stellar/halo mass. However, some properties do begin to isolate the descendants of the highly star-forming Submm-Faint sample. They typically host black holes overmassive for their stellar masses, with the most extreme examples occurring at lower stellar masses ( M⊙), suggesting a strong link between high-redshift starbursting galaxies and black hole growth. In addition, their descendants are typically metal poor and alpha-enhanced, the combination of which would suggest they have undergone a rapid stellar mass build up followed by a rapid quenching of continued star formation in their past, which again likely points towards a period of rapid black hole growth (and its associated AGN feedback, see also Segers et al., 2016).
Whilst only a minority of the galaxies in the two samples were classified as satellites at the times that they were highly star-forming (10% of the mJy galaxies and 3% of the highly star-forming Submm-Faint galaxies), 35% of the mJy galaxies and 32% of the highly star-forming Submm-Faint galaxies evolve to become satellites by . This would suggest a link between the galaxies within the two samples and their environment. In fact, many of the descendants (particularly from the highly star-forming Submm-Faint sample) reside as satellites in today’s most massive haloes. For example, in the three most massive haloes from the simulation at , 25 of their galaxies were either mJy or highly star-forming and Submm-Faint in their past. The act of galaxies in-falling into these massive haloes is the cause for a number of the descendants to have ‘low’ stellar masses (due to stellar stripping), zero SFRs (due to ram-pressure-stripping) and excessively overmassive black holes for their stellar mass (again as a result of the stellar stripping, see Barber et al., 2016 for a study of these sources).
3.3.3 The contribution to the in situ stellar mass budget from high SFR events
For a galaxy to be in one of the two samples it must achieve an intrinsically high SFR or submm flux (which also indicates a high SFR, see Figure 1). We are therefore capturing galaxies at a moment in time when they are among the most highly star-forming objects at their respective redshifts. However, without knowledge of the typical duration of the highly star-forming phase, it is unclear how much this star forming episode will contribute to the total in situ stellar mass budget of the galaxy. That is, is such a phase typically rapid and short lived, and so may contribute relatively little to the total in situ stellar mass budget, or does a significant fraction of the total stellar mass that is grown within the galaxy form during this phase?
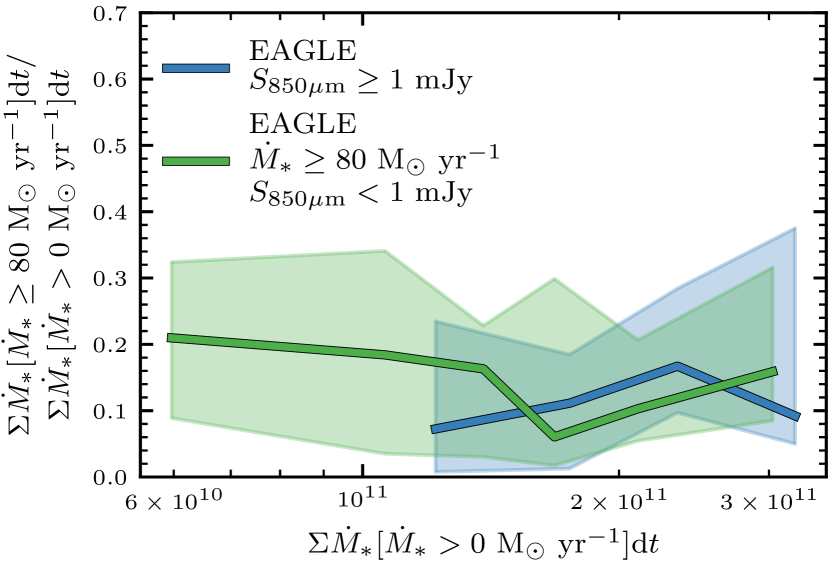
Figure 8 shows, for the descendants of both the mJy and highly star-forming Submm-Faint galaxies at , the fraction of the total initial stellar mass that was formed in situ within the galaxy at a rate above M⊙ yr-1, as a function of the total initial stellar mass that was formed in situ within the galaxy (both of these values are computed by integrating the galaxy’s entire star formation history, see Section 2.1.2). For both samples, periods of high SFRs are never the main contributor to the production of stars within these galaxies, typically contributing an average of 10–20% to the total in situ initial stellar mass. To put this into context, for an average galaxy that has formed M⊙ worth of in situ stars by , % of these were formed during periods of high SFRs, implying a typical duration of Myr for the high SFR phase(s) (combined between one or multiple events). Therefore the majority of the in situ stellar mass formed within the descendants of the mJy and highly star-forming Submm-Faint galaxies occurred at lower SFRs, and over longer periods of time.
3.4 The hidden population of highly star-forming galaxies with faint submm fluxes
There is increasing empirical evidence that SMGs at higher redshifts () have higher dust temperatures than their lower-redshift () counterparts (Cooke et al., 2018; Schreiber et al., 2018). An increasing dust temperature with increasing redshift is also seen in the model galaxies from the mJy sample ( K at to K at , see Figure 3). This could be linked to physical differences in their galaxy properties, such as their SFR surface densities, which would be consistent with the trend of an approximately constant SFR (see Figure 1) combined with a decreasing galaxy size with increasing redshift (see Figure 3), as found for the mJy model galaxies. However, the model galaxies from the highly star-forming Submm-Faint sample have dust temperatures that are systematically higher than those from the mJy sample at all redshifts ( K at to K at , see Figure 3), which suggests that this may be the reason that they do not make it into the mJy sample and would potentially exclude them from current submm surveys.
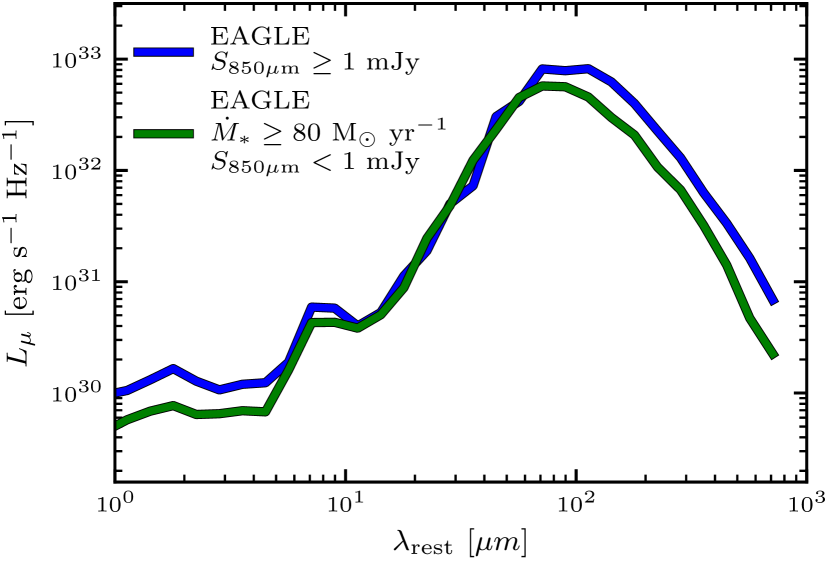
The reason an increased dust temperature may exclude the highly star-forming submm galaxies from the mJy sample becomes clear when looking at the spectral energy distributions (SEDs) of the galaxies. Figure 9 shows the composite broadband SED for the two populations of model galaxies, which clearly reveals a shift to higher temperatures in the dust emission peak for the highly star-forming Submm-Faint galaxies relative to the mJy galaxies, confirming the hotter dust component, and a corresponding reduction in the the submm brightness.
The existence of a population of ‘hot’, dusty ultraluminous galaxies at high redshift has been suggested previously in the literature (e.g., Chapman et al., 2004; Blain et al., 2004; Casey et al., 2009). These galaxies exhibit similar radio and optical characteristics to the high-redshift submm-selected population, however, they are faint in the submm, suggesting a hidden population with higher characteristic dust temperatures than the detected submm population. However, conclusive evidence of a high-redshift population of strongly star-forming submm faint galaxies, as found by eagle, has so far remained elusive.
4 Summary & Conclusions
In this study, we have investigated the nature of the model galaxies in the eagle simulation with the highest SFRs throughout cosmic time. We did this using two model galaxy samples. The first sample comprised the simulated galaxies that yielded the highest mock submm fluxes ( mJy), which acted as an analogue to the observed submm population. The second sample contained the simulated galaxies that were defined as highly star-forming ( M⊙ yr-1), but did not make it into the mJy sample (i.e., they are also mJy, or ‘Submm-Faint’). This second sample revealed what subset of the model galaxies with high SFRs the mJy sample is (or more importantly is not) selecting.
In Section 3.1 we began with a comparison to the observed submm population, finding some encouraging similarities when compared against the mJy model galaxy sample. First, a purely submm-based selection returned the simulated galaxies with the highest SFRs (–300 M⊙ yr-1, with a median SFR of 94 M⊙ yr-1), agreeing well with the inferred SFRs of observed submm sources at . However, the model mJy galaxies in the tail-end of the redshift distribution () had SFRs that were a factor of lower than those inferred by the observations, yet, we note that less than a fifth of the mJy model galaxies lie at these redshifts. Additionally, the redshift distribution of the galaxies in the mJy sample reasonably reproduced the shape and median value of the observed distribution. Finally, many of the integrated properties for the mJy model galaxies broadly agreed with the observed values of submm sources. In combination, these results give us the confidence to use the mJy sample in an attempt to answer the questions relating to the origin, evolution and eventual fate of the observed submm population.
The mJy galaxies were found to be typically massive ( M⊙), star-forming ( M⊙ yr-1) galaxies at –3 with considerable dust masses ( M⊙) and gas fractions (%) that host black holes that are undermassive for galaxies of their stellar masses. The descendants of the mJy galaxies were again massive ( M⊙), with all of the galaxies at with stellar masses above M⊙ having had a mJy phase in their past. However, at a given stellar mass, the mJy galaxies were not obviously distinguishable from the general population of model galaxies. As the black holes of the once mJy galaxies do not remain undermassive by , and come to lie on or around the median value for their stellar mass by the present day, they must of experienced a vigorous period of black hole growth (delayed after the starbursting phase) which grew the black hole and lowered the gas and dust content via AGN feedback. The typical life cycle of model SMGs, and their connection to black hole growth, will be the subject of future work.
The galaxies from the mJy sample had major merger ( ) fractions similar to those of the general population, suggesting that major mergers are not the primary driver of the model submm population. This result would conflict with the findings of many observational studies that have suggested 100% major merger fractions for submm galaxies (e.g., Ivison et al., 2007; Tacconi et al., 2008; Engel et al., 2010; Alaghband-Zadeh et al., 2012; Chen et al., 2015). However, the concept of galaxies ‘in the state of a merger’ is poorly defined; observations must deduce this state from a galaxy’s asymmetry/disturbance or relative distance to a close companion, whereas we define it as being within a fixed number of dynamical times from coalescence. Furthermore, major mergers may play a greater role in triggering the most extreme ( mJy) SMGs, which are those primarily studied observationally (however our current simulation volume is too small to fully explore this regime). Regardless of the definition, a mass/redshift matched control sample is essential to begin to infer the ‘importance’ of mergers as triggering mechanisms, yet, given the natural abundance of mergers within a hierarchical formation of structure, even then disentangling their true importance can remain challenging. As the merger fractions of the mJy galaxies were so similar to the merger fractions of the general population, we would argue that mergers and interactions may be sufficient, but not necessary, to create a submm starburst. Instead, the factor which appears essential is a significant gas reservoir due to an undermassive black hole.
The duration of the ‘submm phase’ for the mJy galaxies was found to be relatively brief (100–400 Myr) and contributed an average of –20% towards the total in situ stellar mass production of the model galaxies. The importance of the submm phase for building up the stellar mass within a galaxy is an interesting question that is often raised when discussing the nature of submm sources. Given the levels of star formation that are inferred for the observed submm population (100s to 1000s of M⊙ yr-1), the stellar mass of a massive galaxy ( M⊙) could be formed in its totality in just a few hundred million years. This has spawned the suggestion that submm galaxies are the progenitors of today’s most massive spheroidal galaxies (e.g., Lilly et al., 1999; Swinbank et al., 2006; Fu et al., 2013; Simpson et al., 2014). Indeed, Swinbank et al. (2006) demonstrated that by adopting a submm-burst lifetime of 300 Myr, coupled with the observed properties of SMGs at , the stellar populations of submm galaxies could evolve onto the scaling relations of the most massive elliptical galaxies in the local Universe (see also Simpson et al., 2014). The alternate extreme has also been suggested, whereby the submm phase makes no significant contribution (%) to the eventual stellar mass of the SMG descendants at (González et al., 2011). However, our results suggest the correct answer lies somewhere between these two extremes.
In contrast to the mJy galaxies, the highly star-forming Submm-Faint galaxies were found to be a set of lower-mass ( M⊙) higher-redshift () galaxies (again with high dust masses, high gas fractions and undermassive black holes) that show stronger evidence of being driven primarily by major mergers. A similar fraction of the in situ stellar mass budget is built within the starbursting phase compared with the mJy galaxies (–20%). Their descendants at , whilst also massive ( M⊙), were typically metal-poor, alpha-enhanced and hosted overmassive black holes for galaxies of their stellar masses, potentially making them identifiable in today’s parameter space.
To summarise, whilst collectively the galaxies in the two samples have the highest SFRs in the simulation and are the progenitors of the most massive galaxies at ( M⊙), they each preferentially select galaxies in two different regimes. The mJy galaxies are massive, dust and gas rich star-forming galaxies at –3 with undermassive black holes, whereas the highly star-forming Submm-Faint galaxies are high redshift, lower-mass, gas and dust rich starbursting galaxies which are more frequently triggered via a major merger. These high-redshift galaxies are likely missed by the current submm surveys due to their higher dust temperatures.
We have used the eagle cosmological hydrodynamical simulation of galaxy formation to investigate the nature of the model galaxies with the highest mock submm fluxes ( mJy). In addition, we investigated the nature of the ‘highly star-forming’ model galaxies which were also ‘Submm-Faint’ (i.e., M⊙ yr-1 but mJy). Here we report our main conclusions:
4.1 mJy galaxies
-
•
The mJy model galaxies broadly reproduce the properties of the observed submm population. They have high SFRs (–300 M⊙ yr-1, see Figure 1), broadly reproduce the shape and median value of the observed redshift distribution (see Figure 2), and reproduce a variety of integrated galaxy and halo properties from the current observations of the submm population (see Figure 3).
-
•
The integrated properties of the mJy galaxies evolve with redshift. At a given redshift, the mJy model population comprises of massive ( M⊙), gas (%) and dust-rich ( M⊙) starbursting galaxies ( M⊙ yr-1) that host undermassive black holes (see Figure 4). With decreasing redshift, the mJy population have higher halo, stellar and black hole masses, they become increasingly gas poor, their sizes, velocity dispersions and dust masses increase, their metallicities remain approximately constant, and their dust temperatures decrease (see Figure 3).
-
•
mJy galaxies have major merger ( ) fractions similar to the general population. This would suggest that major mergers are not the primary trigger of the eagle submm population (see Figure 5). Instead, what is critical is that there is an adequate gas reservoir present.
-
•
The majority of star production in mJy galaxies occurs outside the high SFR event(s). On average, 10–20% of the stars that are born within the mJy model galaxies do so at high SFRs ( M⊙ yr-1), which implies a typical starbursting duration of –400 Myr (combined between one or more events). Therefore, the majority of the stellar mass build-up in mJy galaxies occurs at lower SFRs, over longer periods of time (see Figure 8).
-
•
The descendants of the mJy population at are massive ( M⊙). However, not all massive galaxies today were once mJy (see Figure 7). At a given stellar mass, the descendants of mJy galaxies have gas fractions, dust masses, black hole masses, metallicities and alpha-enhancements (and all other integrated properties that we have explored) that are similar to the median trend for all galaxies (see Figure 6). This suggests that it would be difficult to identify the descendants mJy galaxies in today’s parameter space. A moderate fraction of the once mJy galaxies evolve to become satellites by the present day (35%, up from 10% at the time they were selected) suggesting the environment may play a role in their formation.
4.2 Highly star-forming Submm-Faint galaxies (i.e., M⊙ yr-1 but mJy)
-
•
Highly star-forming Submm-Faint galaxies predominantly exist at higher redshift (, see Figure 2). Similar to the mJy population, highly star-forming Submm-Faint galaxies have high SFRs, dusts masses and gas fractions, and host undermassive black holes (see Figure 4). The integrated properties of the highly star-forming Submm-Faint galaxies evolve with redshift in a similar manner to the mJy galaxy population (see Figure 3).
-
•
Highly star-forming Submm-Faint galaxies galaxies have major merger ( ) fractions typically greater than the general population. This would suggest that major mergers are more important for triggering this galaxy subset, particularly at lower stellar masses ( M⊙), where the enhancement in the major merger fraction is a factor of greater than those of the general population (see Figure 5).
-
•
The descendants of highly star-forming Submm-Faint galaxies at have overmassive black holes, are metal-poor, and are alpha-enhanced for their stellar masses, relative to the median trends of the general population (see Figure 6). In addition, many of the once highly star-forming Submm-Faint galaxies evolve to become satellites of the most massive haloes within the simulation by the present day (32% of the descendants evolved to become satellites, up from 3% at the time they were highly star-forming) suggesting the environment may play a role in their formation.
-
•
Highly star-forming Submm-Faint galaxies are faint in the submm wavebands due to their higher dust temperatures. This means that a large fraction of the highly star-forming galaxies within the Universe could be potentially missed by the current submm surveys (see Figures 3 and 9), and also suggests that current observational works may be underestimating the total contribution to the cosmic SFR density above (as they would be missed in both the UV and submm bands).
Acknowledgements
SM thanks Michelle Furlong and Jonathan Davies for their many contributions to this work.
This work was supported by the Science and Technology Facilities Council (grant number ST/P000541/1) and the Academy of Finland (grant number 314238). RAC is a Royal Society University Research Fellow. IRS acknowledges support from the ERC Advanced Grant DUSTYGAL (321334).
This work used the DiRAC Data Centric system at Durham University, operated by the Institute for Computational Cosmology on behalf of the STFC DiRAC HPC Facility (www.dirac.ac.uk). This equipment was funded by BIS National E-infrastructure capital grant ST/K00042X/1, STFC capital grant ST/H008519/1, and STFC DiRAC Operations grant ST/K003267/1 and Durham University. DiRAC is part of the National E-Infrastructure.
References
- Alaghband-Zadeh et al. (2012) Alaghband-Zadeh S., et al., 2012, MNRAS, 424, 2232
- Alexander et al. (2008) Alexander D. M., et al., 2008, AJ, 135, 1968
- Baes et al. (2011) Baes M., Verstappen J., De Looze I., Fritz J., Saftly W., Vidal Pérez E., Stalevski M., Valcke S., 2011, ApJS, 196, 22
- Bahé et al. (2016) Bahé Y. M., et al., 2016, MNRAS, 456, 1115
- Barber et al. (2016) Barber C., Schaye J., Bower R. G., Crain R. A., Schaller M., Theuns T., 2016, MNRAS, 460, 1147
- Barnes & Hernquist (1991) Barnes J. E., Hernquist L. E., 1991, ApJ, 370, L65
- Baugh et al. (2005) Baugh C. M., Lacey C. G., Frenk C. S., Granato G. L., Silva L., Bressan A., Benson A. J., Cole S., 2005, MNRAS, 356, 1191
- Blain et al. (2004) Blain A. W., Chapman S. C., Smail I., Ivison R., 2004, ApJ, 611, 52
- Boselli et al. (2010) Boselli A., et al., 2010, PASP, 122, 261
- Bothwell et al. (2013) Bothwell M. S., et al., 2013, MNRAS, 429, 3047
- Camps & Baes (2015) Camps P., Baes M., 2015, Astronomy and Computing, 9, 20
- Camps et al. (2016) Camps P., Trayford J. W., Baes M., Theuns T., Schaller M., Schaye J., 2016, MNRAS, 462, 1057
- Camps et al. (2018) Camps P., et al., 2018, ApJS, 234, 20
- Casey et al. (2009) Casey C. M., et al., 2009, MNRAS, 399, 121
- Casey et al. (2012) Casey C. M., et al., 2012, ApJ, 761, 140
- Casey et al. (2014) Casey C. M., Narayanan D., Cooray A., 2014, Phys. Rep., 541, 45
- Chabrier (2003) Chabrier G., 2003, PASP, 115, 763
- Chang et al. (2015) Chang Y.-Y., van der Wel A., da Cunha E., Rix H.-W., 2015, ApJS, 219, 8
- Chapman et al. (2004) Chapman S. C., Smail I., Blain A. W., Ivison R. J., 2004, ApJ, 614, 671
- Chapman et al. (2005) Chapman S. C., Blain A. W., Smail I., Ivison R. J., 2005, ApJ, 622, 772
- Chen et al. (2015) Chen C.-C., et al., 2015, ApJ, 799, 194
- Chen et al. (2016) Chen C.-C., et al., 2016, ApJ, 831, 91
- Cooke et al. (2018) Cooke E. A., et al., 2018, ApJ, 861, 100
- Cowie et al. (2018) Cowie L. L., Gonzalez-Lopez J., Barger A. J., Bauer F. E., Hsu L.-Y., Wang W.-H., 2018, preprint, (arXiv:1805.09424)
- Cowley et al. (2015) Cowley W. I., Lacey C. G., Baugh C. M., Cole S., 2015, MNRAS, 446, 1784
- Crain et al. (2015) Crain R. A., et al., 2015, MNRAS, 450, 1937
- Dalla Vecchia & Schaye (2012) Dalla Vecchia C., Schaye J., 2012, MNRAS, 426, 140
- Danielson et al. (2017) Danielson A. L. R., et al., 2017, ApJ, 840, 78
- Davé et al. (2010) Davé R., Finlator K., Oppenheimer B. D., Fardal M., Katz N., Kereš D., Weinberg D. H., 2010, MNRAS, 404, 1355
- Del Moro et al. (2013) Del Moro A., et al., 2013, A&A, 549, A59
- Dolag et al. (2009) Dolag K., Borgani S., Murante G., Springel V., 2009, MNRAS, 399, 497
- Engel et al. (2010) Engel H., et al., 2010, ApJ, 724, 233
- Fu et al. (2013) Fu H., et al., 2013, Nature, 498, 338
- Furlong et al. (2015) Furlong M., et al., 2015, MNRAS, 450, 4486
- Furlong et al. (2017) Furlong M., et al., 2017, MNRAS, 465, 722
- González et al. (2011) González J. E., Lacey C. G., Baugh C. M., Frenk C. S., 2011, MNRAS, 413, 749
- Gruppioni et al. (2013) Gruppioni C., et al., 2013, MNRAS, 432, 23
- Hayward et al. (2013) Hayward C. C., Narayanan D., Kereš D., Jonsson P., Hopkins P. F., Cox T. J., Hernquist L., 2013, MNRAS, 428, 2529
- Hickox et al. (2012) Hickox R. C., et al., 2012, MNRAS, 421, 284
- Hodge et al. (2013) Hodge J. A., et al., 2013, ApJ, 768, 91
- Ivison et al. (2007) Ivison R. J., et al., 2007, MNRAS, 380, 199
- Karim et al. (2013) Karim A., et al., 2013, MNRAS, 432, 2
- Kirkpatrick et al. (2012) Kirkpatrick A., et al., 2012, ApJ, 759, 139
- Kirkpatrick et al. (2015) Kirkpatrick A., Pope A., Sajina A., Roebuck E., Yan L., Armus L., Díaz-Santos T., Stierwalt S., 2015, ApJ, 814, 9
- Koprowski et al. (2017) Koprowski M. P., Dunlop J. S., Michałowski M. J., Coppin K. E. K., Geach J. E., McLure R. J., Scott D., van der Werf P. P., 2017, MNRAS, 471, 4155
- Lagos et al. (2015) Lagos C. d. P., et al., 2015, MNRAS, 452, 3815
- Lilly et al. (1999) Lilly S. J., Eales S. A., Gear W. K. P., Hammer F., Le Fèvre O., Crampton D., Bond J. R., Dunne L., 1999, ApJ, 518, 641
- Madau & Dickinson (2014) Madau P., Dickinson M., 2014, Annual Review of Astron and Astrophys, 52, 415
- Magnelli et al. (2011) Magnelli B., Elbaz D., Chary R. R., Dickinson M., Le Borgne D., Frayer D. T., Willmer C. N. A., 2011, A&A, 528, A35
- Matthee & Schaye (2018) Matthee J., Schaye J., 2018, preprint, (arXiv:1805.05956)
- McAlpine et al. (2016) McAlpine S., et al., 2016, Astronomy and Computing, 15, 72
- McAlpine et al. (2017) McAlpine S., Bower R. G., Harrison C. M., Crain R. A., Schaller M., Schaye J., Theuns T., 2017, MNRAS, 468, 3395
- McAlpine et al. (2018) McAlpine S., Bower R. G., Rosario D. J., Crain R. A., Schaye J., Theuns T., 2018, MNRAS, 481, 3118
- Mihos & Hernquist (1996) Mihos J. C., Hernquist L., 1996, ApJ, 464, 641
- Planck Collaboration et al. (2014) Planck Collaboration et al., 2014, Astronomy and Astrophysics, 571, A1
- Qu et al. (2017) Qu Y., et al., 2017, MNRAS, 464, 1659
- Rahmati et al. (2015) Rahmati A., Schaye J., Bower R. G., Crain R. A., Furlong M., Schaller M., Theuns T., 2015, MNRAS, 452, 2034
- Rodriguez-Gomez et al. (2015) Rodriguez-Gomez V., et al., 2015, MNRAS, 449, 49
- Rosas-Guevara et al. (2016) Rosas-Guevara Y., Bower R. G., Schaye J., McAlpine S., Dalla Vecchia C., Frenk C. S., Schaller M., Theuns T., 2016, MNRAS, 462, 190
- Schaller et al. (2015) Schaller M., et al., 2015, MNRAS, 451, 1247
- Schaye & Dalla Vecchia (2008) Schaye J., Dalla Vecchia C., 2008, MNRAS, 383, 1210
- Schaye et al. (2015) Schaye J., et al., 2015, MNRAS, 446, 521
- Schreiber et al. (2018) Schreiber C., Elbaz D., Pannella M., Ciesla L., Wang T., Franco M., 2018, A&A, 609, A30
- Segers et al. (2016) Segers M. C., Crain R. A., Schaye J., Bower R. G., Furlong M., Schaller M., Theuns T., 2016, MNRAS, 456, 1235
- Simpson et al. (2014) Simpson J. M., et al., 2014, ApJ, 788, 125
- Simpson et al. (2015) Simpson J. M., et al., 2015, ApJ, 807, 128
- Springel et al. (2001) Springel V., White S. D. M., Tormen G., Kauffmann G., 2001, MNRAS, 328, 726
- Springel et al. (2005) Springel V., Di Matteo T., Hernquist L., 2005, MNRAS, 361, 776
- Swinbank et al. (2004) Swinbank A. M., Smail I., Chapman S. C., Blain A. W., Ivison R. J., Keel W. C., 2004, ApJ, 617, 64
- Swinbank et al. (2006) Swinbank A. M., Chapman S. C., Smail I., Lindner C., Borys C., Blain A. W., Ivison R. J., Lewis G. F., 2006, MNRAS, 371, 465
- Swinbank et al. (2008) Swinbank A. M., et al., 2008, MNRAS, 391, 420
- Swinbank et al. (2014) Swinbank A. M., et al., 2014, MNRAS, 438, 1267
- Tacconi et al. (2008) Tacconi L. J., et al., 2008, ApJ, 680, 246
- The EAGLE team (2017) The EAGLE team 2017, preprint, (arXiv:1706.09899)
- Trayford et al. (2015) Trayford J. W., et al., 2015, MNRAS, 452, 2879
- Trayford et al. (2017) Trayford J. W., et al., 2017, MNRAS, 470, 771
- Wiersma et al. (2009a) Wiersma R. P. C., Schaye J., Smith B. D., 2009a, MNRAS, 393, 99
- Wiersma et al. (2009b) Wiersma R. P. C., Schaye J., Theuns T., Dalla Vecchia C., Tornatore L., 2009b, MNRAS, 399, 574
- da Cunha et al. (2015) da Cunha E., et al., 2015, ApJ, 806, 110
| HMR∗ | |||||||||
|---|---|---|---|---|---|---|---|---|---|
| [M⊙] | [M⊙] | [M⊙] | [%] | [pkpc] | [km s-1] | [K] | [M⊙] | [] | |
| HMR∗ | |||||||||
|---|---|---|---|---|---|---|---|---|---|
| [M⊙] | [M⊙] | [M⊙] | [%] | [pkpc] | [km s-1] | [K] | [M⊙] | [] | |