Polarimetric and photometric investigation of a dark globule LDN 1225: distance, extinction law, and magnetic fields
Abstract
We present the results based on the optical -band polarization observations of 280 stars distributed towards the dark globule LDN 1225. Gaia data release 2 parallaxes along with the polarization data of 200 stars have been used to (a) constrain the distance of LDN 1225 as 83083 pc, (b) determine the contribution of interstellar polarization (ISP), and (c) characterize the dust properties and delineate the magnetic field (B-field) morphology of LDN 1225. We find that B-fields are more organized and exhibit a small dispersion of 12. Using the 12CO molecular line data from the Purple Mountain Observatory (PMO), along with the column density, dispersion in B-fields, we estimate B-field strength to be 56 10 G, magnetic to turbulence pressure to be 3 2, and the mass-to-magnetic flux ratio (in units of critical value) to be 1. These results indicate the dominant role of B-fields in comparison to turbulence and gravity in rendering the cloud support. B-fields are aligned parallel to the low-density parts (traced by 12CO map) of the cloud, in contrast they are neither parallel nor perpendicular to the high-density core structures (traced by 13CO and C18O maps). LDN 1225 hosts two 70 m sources which seem to be of low-mass Class 0 sources. The total-to-selective extinction derived using optical and near-infrared photometric data is found to be anomalous ( 3.4), suggesting dust grain growth in LDN 1225. Polarization efficiency of dust grains follows a power-law index of 0.7 inferring that optical polarimetry traces B-fields in the outer parts of the cloud.
1 Introduction
The small, compact, and isolated dark globules known as “Bok globules" (Bok & Reilly, 1947), are the potential precursors to the protostars. Initially, Barnard (1927) had prepared a list of such dark regions in the sky and later Lynds (1962) published a catalogue with a larger number of such dark objects. Furthermore, Clemens & Barvainis (1988) have compiled a list of 248 small (mean size ) and nearby (distance 1 kpc) molecular clouds. Subsequent studies have shown that these clouds exhibit signs of star formation such as collimated molecular outflows, compact infrared sources, and very low luminous objects (VELLOs) (Reipurth, 1983; Frerking & Langer, 1982; Neckel et al, 1985; Vrba et al, 1986; Neckel et al, 1990; Richer et al, 2000; Stecklum et al, 2007; Reipurth, 2008). The characteristics of new born stars will depend on the physical conditions of the molecular cloud core prior to the onset of gravitational collapse.
Turbulence in the dark globules is sub-or trans-Alfvénic (Heyer et al, 2008; Franco et al, 2010) and the cores embedded in them are characterized with subsonic turbulence (Myers et al, 1983; Goodman et al, 1998) such that their effect is inadequate to counteract the gravitational collapse. Therefore, magnetic fields (B-fields) are proposed to play a crucial role in regulating isolated low-mass star formation by controlling the stability and contraction of the cores in these clouds (Mouschovias, 1976; Shu, 1977; Shu et al, 1987). Moreover, it has been shown that B-fields are indeed important in regulating shape of the cloud fragments, guiding accretion flows, directing the outflows, and collimating the jets of the protostars (Vallée, 2002; Sugitani et al, 2010; Girart et al, 2006; Pudritz et al, 2007; McKee et al, 2007; Galli et al, 2009). Here we study the morphological correlations between the cloud and B-fields, and investigate the relative importance of B-fields to turbulence and gravity in LDN 1225 (eg., Myers et al, 1991; Ward-Thompson et al, 2000; Eswaraiah et al, 2013; Bertrang et al, 2014; Kandori et al, 2017; Jorquera et al, 2018).
The dark globule LDN 1225 (or CB242 or H699 P16) with central coordinates of RA (J2000) 23h11m58s and Dec (2000) 613900 (or 11141, 0102) is located towards the Cepheus OB3 cloud complex (hereafter CepOB3). Based on the derived extinction and distance values of the stars projected toward the cloud, Maheswar & Bhatt (2006) have bracketed the distance of LDN 1225 as 40080 pc. Nonetheless, our study suggests that, being kinematically associated with CepOB3, LDN 1225 is located at 83083 pc. A catalog of dust clouds in the Galaxy by Dutra et al (2002) indicates that the spatial extent of LDN 1225 is , opacity class as 4 (1 being more lightest and 6 being more darkest; Lynds 1962), and the local standard of rest velocity (VLSR) based on CO data as 10.9 km s-1 (Clemens & Barvainis, 1988). Opacity class 4 (Lynds, 1962) is similar to the density class B (A being the most dense and C being the least dense; Hartley et al 1986). Therefore, according to the above opacity classes, LDN 1225 is an intermediate dense dark globule.
In this work, our goal is to investigate whether B-fields support, relative to turbulence and gravity, is important to the formation and evolution of the dark globule LDN 1225. For this purpose, the B-field strength and its pressure, turbulent pressure, ratio of ordered to turbulent component of B-fields, the mass-to-magnetic flux ratio in units of critical value, etc, have been estimated using -band polarization and CO molecular lines data. Polarimetric data have been used in combination with Gaia data release 2 (Gaia Collaboration et al, 2018) parallaxes to find the cloud distance, to estimate foreground polarization contribution, and to determine the dust properties and B-fields in LDN 1225. Based on the distances, kinematic information, and the coherent B-fields at small and large scales, the membership of LDN 1225 to the CepOB3 is discussed. The possible correlation between multiple components of polarizations and those of CO gas is discussed. We discuss the properties of two 70 m sources and their association with LDN 1225. Optical photometric data have been used to characterize the extinction law in the foreground and cloud mediums. Furthermore, dust polarization efficiency of the dust grains in the dark globule LDN 1225 is studied.
Outline of this paper is as follows. Section 2 describes the observation and data reduction of various observed data along with the archival data sets. Analyses and results are presented in section 3. Discussion based on our results is given in section 4. Summary and conclusions of this work are mentioned in section 5.
2 Observations, data reduction, and archival data sets
2.1 Polarimetric observations of LDN 1225
Polarimetric observations were carried out on five nights (2010 November 12 and 13, 2010 December 14, and 2013 November 01 and 02), using the ARIES Imaging Polarimeter (AIMPOL; Rautela et al, 2004) mounted at the Cassegrain focus of the 104-cm Sampurnanand telescope of the Aryabhatta Research Institute of observational sciencES (ARIES), Nainital, India. The observations were carried out in the (=0.670m) photometric band using a small area (370370 pixel2) of the TK 1024 1024 pixel2 CCD camera. Field of view (FOV) of AIMPOL is 8 arcmin diameter on the sky. During the observations the FWHMs of the stellar images vary between 3 – 5. The read-out noise and gain of the CCD are 7.0 and 11.98 /ADU respectively. Since AIMPOL does not have the grid, we manually checked for any overlap of ordinary and extraordinary images of the sources. Fluxes of ordinary () and extra-ordinary () beams for all the observed sources with good signal-to-noise ratio were extracted by standard aperture photometry after bias subtraction using the IRAF111IRAF is distributed by National Optical Astronomical Observatories, USA. package. More details on the instrument and the detailed procedures used to estimate the polarization measurements are mentioned in Eswaraiah et al (2011, and references therein).
All the measurements are corrected for both the instrumental polarization and offset polarization angle by observing unpolarized and polarized standard stars, respectively, from Schmidt et al (1992). As given in the Table 1, our results on the polarized standard stars are in good agreement, within the observational errors, with those from Schmidt et al (1992). Measurements of one unpolarized standard star, HD 21447, as listed in the Table 1, show that the instrumental polarization in -band is 0.1. This is consistent with the fact that the instrumental polarization of AIMPOL has been monitored since 2004 on various observing nights as a part of various projects and found to be less than 0.1% in different bands (Rautela et al, 2004; Medhi et al., 2008; Eswaraiah et al, 2011, 2012; Pandey et al, 2013; Eswaraiah et al, 2013; Kumar et al., 2014b, 2016; Lee et al, 2018).
We have obtained the -band polarizations (degree of polarization, (%), and polarization angle, ()) of 280 stars and are listed in Table 2. This table also contains the stellar coordinates and 2MASS photometric data.
Figure 1(a) displays the polarization vector map towards LDN 1225 using and of 280 stars, which depicts that B-field geometry is not uniform. Of 280, 33 stars are distributed within the 8 diameter field containing the star forming region NGC 7538 which is situated within the Perseus spiral arm of our Galaxy at a distance of 2.65 kpc (Moscadelli et al, 2009; Puga et al, 2010; Sharma et al, 2017). Since these stars are not physically associated with LDN 1225 (located at 800 pc), we exclude them from further analyses. We also omitted 9 stars with NIR-excess (; see e.g., Eswaraiah et al 2013, 2017) as their polarizations might be consisting of intrinsic components due to asymmetric distribution of material in their circumstellar disks. Remaining 238 stars are used in the further analyses.
2.2 Polarimetric observations of several fields covering parts of CepOB3
To understand whether the large scale B-fields of CepOB3 are preserved and have any effect on the small scales of LDN 1225, we also observed 19 additional fields covering different parts of CepOB3 using various polarimeters. Three fields with FOV of 8 diameter were observed in -band with AIMPOL on 2016 October 29 and the data are reduced by adopting similar procedures mentioned in the above section 2.1. Eight fields with FOV of 4 diameter were observed in -band on five nights (2014 November 19, 20, 25, 26, and 27) using the 2-m telescope of the Inter University Center for Astronomy and Astrophysics (IUCAA), Girawali Observatory, India. The instrument used was the IUCAA Faint Object Spectrograph and Camera (IFOSC) in the polarimetric mode (Sen et al, 1994; Ramaprakash et al, 1998). Eight fields with FOV of are observed on 2015 October 13 with Triple Range Imager and Polarimeter (TRIPOL) mounted on Lulin One-meter Telescope (LOT) at Lulin observatory, Taiwan (Sato et al. in prep.). TRIPOL acquired simultaneous observations in SDSS -, -, and -bands, but we use only the -band data. The measurements from IMPOL and TRIPOL are corrected for both instrumental polarization and offset polarization angles.
Apart from our own observations, we use catalogued -band polarization (Heiles, 2000) of 16 stars located within the field containing CepOB3. We make sure that this sample does not include the stars with possible intrinsic polarization (e.g., Be stars, other emission type stars, young stellar objects, super-giant, red/blue supergiant, Wolf-rayet stars, etc.) with the help of SIMBAD database.
2.3 Distances from GAIA DR2
The ESA GAIA mission (Gaia Collaboration et al, 2016a, b) data release 2 (Gaia Collaboration et al, 2018, hereafter GAIA DR2), provides distance information for stars up to 21 mag. Of the 238 stars which have been used in the present study, 197 have GAIA DR2 parallaxes passing 10 criterion (i.e., parallaxes to their uncertainties, , 10). The search area of 1 radius around each of the star was used while matching the coordinates of our stars with those of GAIA DR2. Distances of all 197 stars are derived using the relation (1000/) pc (where is the parallax in milli-arcsecond) and the distance error is estimated by propagating the distance-parallax relation. Based on the asteroseismic data of well-characterized red giant branch (RGB) stars in the Kepler field, (Zinn et al, 2018, and references therein) have independently confirmed the offset in the parallaxes, 52.8 as (micro-arcsecond), of GAIA DR2. However, we have not applied the offset in this study as our main concern is to find the distance of the cloud rather than deriving the distances of individual stars. The distances of the stars are given in the column 9 of Table 2.
2.4 Photometric observations towards LDN 1225
Optical photometric observations were performed on 2013 September 6 and 7 using Himalaya Faint Object Spectrograph and Camera (HFOSC) of the 2-m Himalayan Chandra Telescope (HCT) of Indian Astronomical Observatory (IAO), Hanle, operated by Indian Institute of Astrophysics (IIA), India. The central 20482048 pixel2 area of the 2K4K CCD was used for data acquisition. The FOV of the instrument is area with a pixel size of 15 m and image plate scale of 0.293 pixel-1. Photometric observations in -bands were performed towards four fields around LDN 1225. We obtained multiple frames in each filters and the total integration time in ,, , and -filters was 300, 200, 90, and 90 sec, respectively, in each field. Typical seeing during the observations was 15. The total area coverage of our optical photometric observations are of 17 around LDN 1225, which is shown with a white box in Figure 1(a). In order to apply atmospheric extinction correction as well as for instrument calibration, we observed the standard star field PG0231 (Landolt, 1992) during the nights. PG0231 was observed at various air masses and the nights were photometric. Bias and flat frames were also acquired during the nights.
After bias and flat correction, we stacked all the images of individual fields in each filter. We performed point spread function (PSF) photometry using the DAOPHOT package in IRAF to derive the instrumental magnitudes. Extinction and instrument coefficients were measured using the instrumental magnitudes and standard star magnitudes of PG0231 field (Landolt, 1992). These coefficients were applied to the instrumental magnitudes of LDN 1225 and thus we obtained the final, calibrated photometry. The individual catalogs of four fields were then merged to obtain the final catalog. Typical uncertainty in the photometric calibration is 0.05, 0.03, 0.02, and 0.02 mag for the , , and filters.
2.5 12CO (1 – 0), 13CO (1 – 0), and C18O (1 – 0) data from PMO MWISP survey
In order to study the gas kinematics of the cloud LDN 1225, we used the 12CO(1 – 0), 13CO (1 – 0), and C18O (1 – 0) molecular line data from the Milky Way Imaging Scroll Painting (MWISP) project111http://www.radioast.nsdc.cn/mwisp.php using the Purple Mountain Observatory (PMO) Delingha 13.7 m telescope located at Qinghai observing station (see Su et al, 2016). LDN 1225 has been observed in November 2015. The MWISP project is a new large-scale survey aiming to perform molecular line observations at the = 1 – 0 transition of CO isotopes 12CO, 13CO, and C18O simultaneously. This survey has been specially intended to observe the northern Galactic plane within the Galactic coordinates of 10 25 25025 and 525 +525, and several other regions of interests. One of the main goals of the MWISP project is to investigate the physical properties of molecular clouds along the northern Galactic plane. The beam sizes are about and at 115.3 GHz and 110 GHz, respectively. The nominal sensitivities (rms level) in the brightness temperature are 0.47 K in 12CO at the velocity resolution of 0.159 km s-1 and 0.26 K in 13CO and C18O at the velocity resolution of 0.167 km s-1. The resultant data cubes have a FOV of 30 and a beam size of 53. Our target LDN 1225 is located within the MWISP survey area data of CepOB3. More details on the instrument, data reduction, and analysis procedures can be found at Gong et al (2016) and Su et al (2017).
3 Analyses and Results
3.1 Distribution of polarization measurements
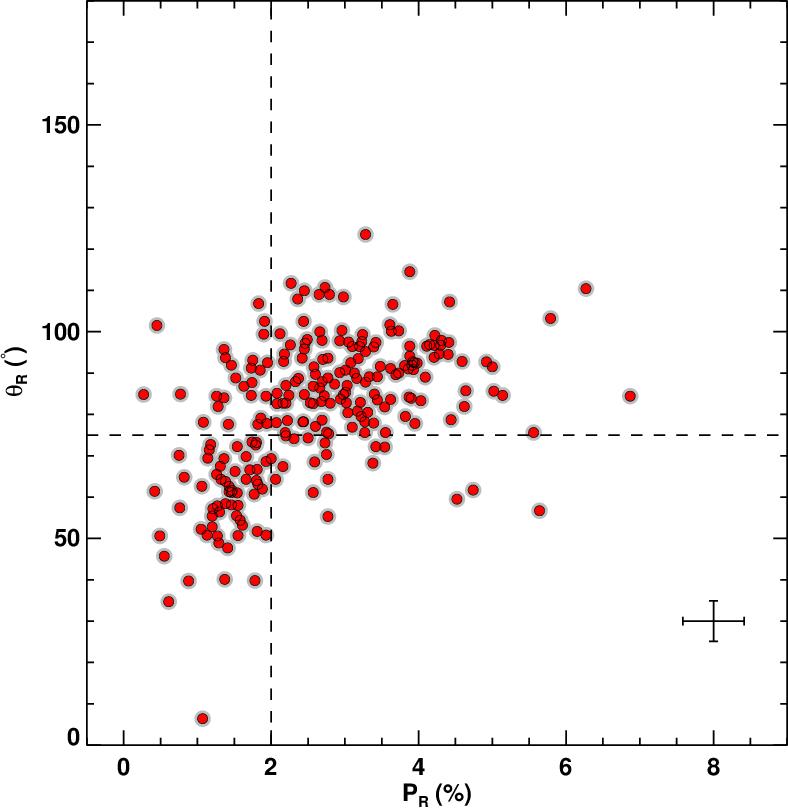
Figure 2 plots the versus for 238 stars. The values increase from 50 to 75 as a function of increase in from 1% to 2%. Beyond which, increases up to 5% while the values are distributed between 75 and 110. To probe the B-field orientation of LDN 1225 we require background (hereafter BG) stars. For this, we need to identify and exclude the FG stars and stars that are not physically associated with the local arm in which LDN 1225 is located. Though, there exist two clear distributions in versus diagram (separated at 2% and 75 shown with dashed lines in Figure 2, also see Figure 1(a)), identification of stars belonging to each distribution will be difficult. This can be overcome by knowing the stellar distances, cloud distance, and by classifying the entire sample into FG and BG stars based on their polarizations and distances.
3.2 Distance versus polarization plots and distance estimation of LDN 1225
Nearly 93% (197 out of 238) of the stars with polarization data have distance information satisfying the criterion (cf. section 2.3). This information is highly useful to estimate the accurate distance of the cloud. The basis for the distance determination is the occurrence of an abrupt jump in the level of polarization at the cloud distance. The degree of polarization as a function of distance, in the presence of uniform distribution of material along the line-of-sight and according to the canonical extinction to distance relation of 1.8 mag kpc-1 (Whittet, 2003)222This relation is applicable only as a general average for lines of sight close to the plane of the Milky Way and for distances up to a few kiloparsecs from the Sun., should exhibit a monotonically increasing trend. However, the presence of a cloud (hence increase in the number density of aligned dust grains of the cloud) along the line-of-sight through which background stellar light passes by would cause an enhanced level of polarization at the cloud distance. As a result, a sudden jump in the level of polarization would prevail at the cloud distance. Any change in the orientation of B-fields can also be witnessed in the distance versus polarization angle plot if the B-fields of the cloud are different from those of the FG medium.
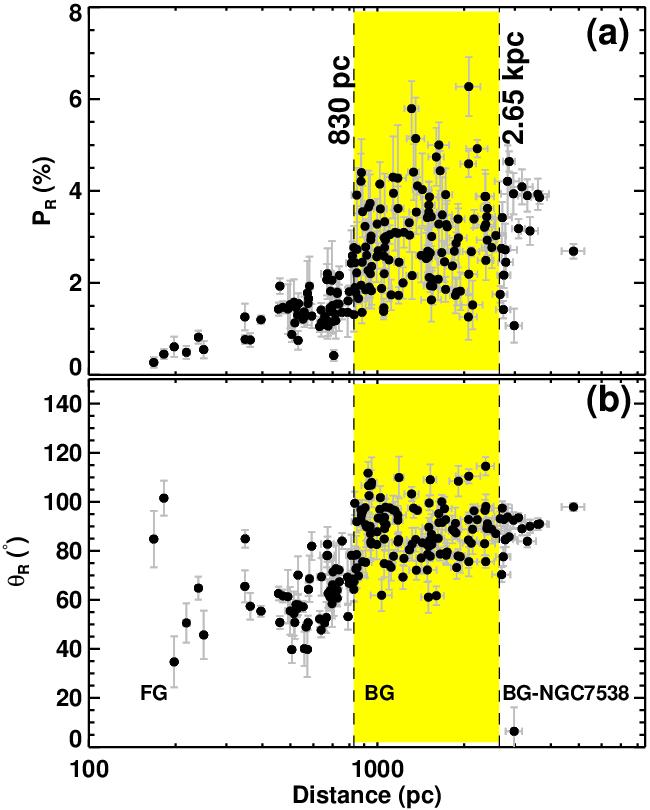
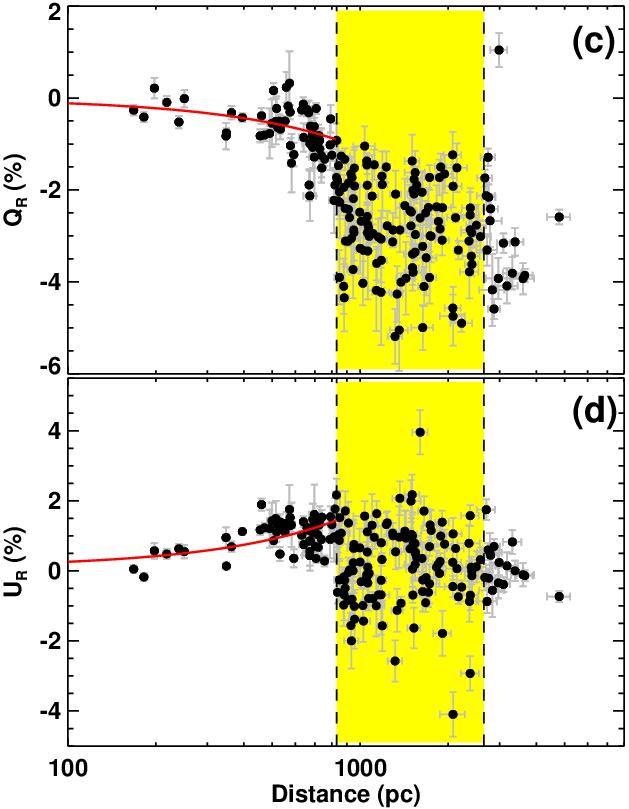
Figures 3(a) and (b), respectively, show the distance versus and of 197 stars. Both and seem to increase as a function of distance up to 830 pc. In contrast, beyond 830 pc a sudden jump followed by a scattered distribution in and a constant trend in can be witnessed. Similarly, Stokes parameters ( and ) also exhibit linearly decreasing or increasing trends up to 830 pc and beyond which they exhibit scattered distributions (Figures 3(c) and (d)). These abrupt change in , , , and at 830 pc is attributed to the presence of LDN 1225 at this distance.
Since we have used stars with 10 GAIA DR2 distances in our analyses, the expected measurement uncertainty at 830 pc would be 83 pc (10% of 830 pc). Therefore, we ascertain the distance of LDN 1225 as 83083 pc. This value supports the distance estimation of 730 120 pc by other studies (Brunt et al, 2003, see also Blaauw et al 1959; Crawford et al 1970; Sargent 1977; Ladd et al 1997; Hartigan et al 2000; Kun et al 2008).
In order to elucidate more on the above distance determination, we plot the differential polarization (), polarization angle (), and Stokes ( and ) versus distance () parameters as shown in Figure 4. The subscript i varies from 1 to 196 in the increasing order of distances. Since the number of stars is 197, the total differential measurements would be 196. This plot offers a crucial information on the changes in the patterns of polarization measurements of any star relative to those of an immediate foreground. However, in order to see the clear variations of the parameters at the cloud’s distance, we limit the data samples up to 2 kpc and plotted distance in linear scale.
Evidently all the differential parameters exhibit a clear transition from negative to positive (or vice versa) at 830 pc as denoted with a green arrow. Region I is dominated by the FG stars, while regions III and IV are with BG stars. Stars with 747 (830 83) pc 830 pc (blue circles) are lying in the region I only, in contrast those with 830 pc 913 (830 83) pc (red circles) are clearly distributed in both regions III and IV. This observed feature suggests an evidence for the clear changes in the polarization properties of the stars at 830 pc. These changes we attribute to the presence of cloud LDN 1225 at 830 pc.
3.3 Identification of foreground and background stars, and their polarization characteristics
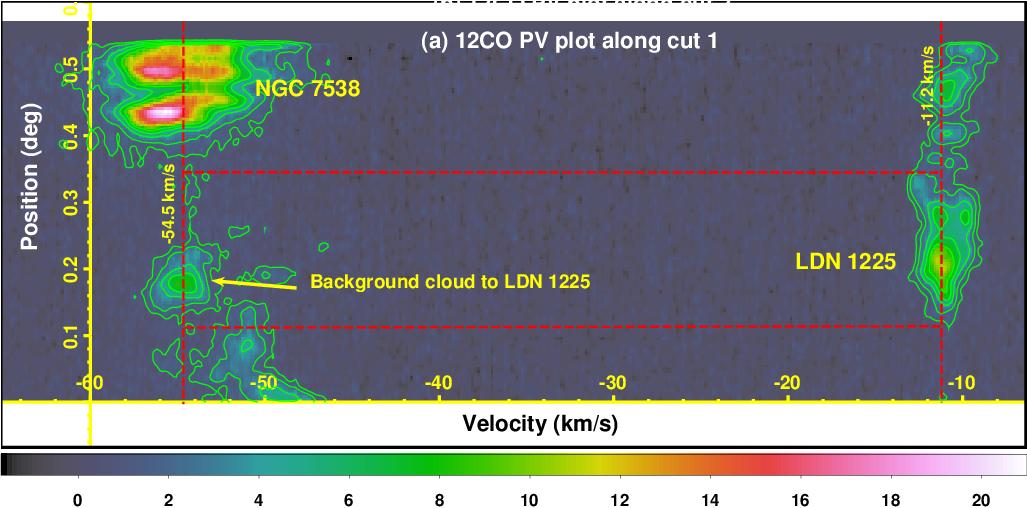
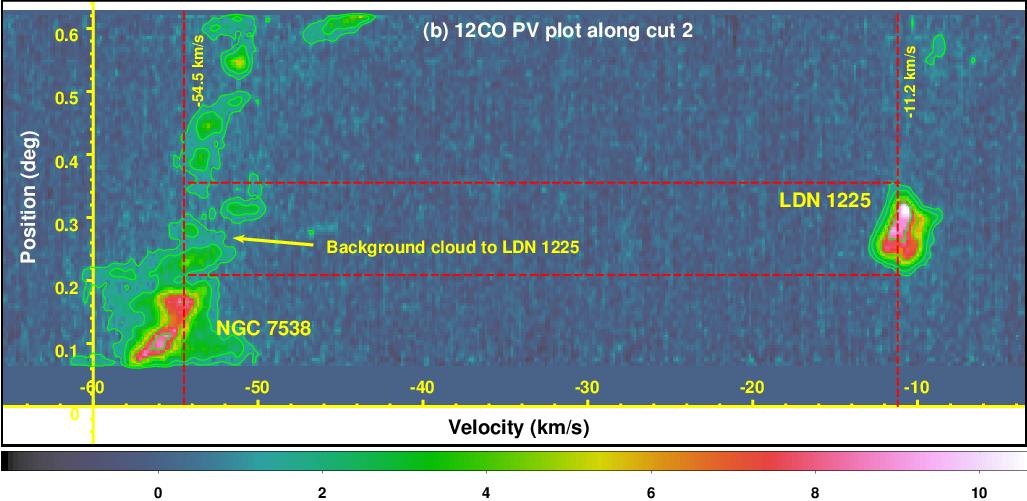
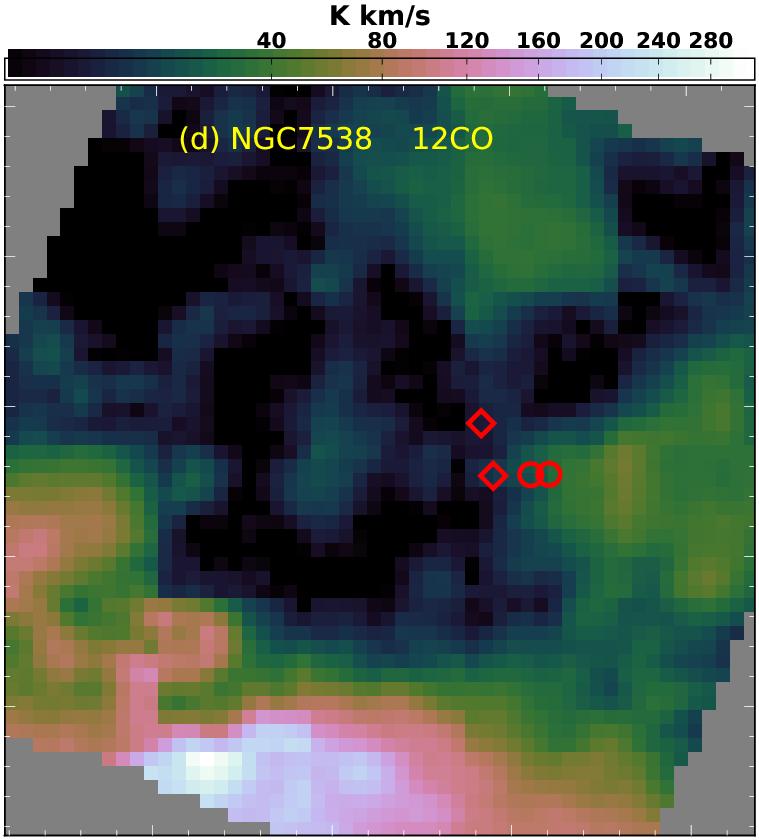
Since the distance of LDN 1225 is constrained as 83083 pc (above section), we consider 61 stars with distances 830 pc as foreground stars (hereafter FG) and are mentioned as “FG" in column 10 of Table 2, whereas the 136 stars with distances 830 pc as background stars. However, there exist a star forming region NGC 7538 (situated within the Perseus arm at 2.65 kpc; Moscadelli et al 2009; Puga et al 2010; Sharma et al 2017) lying background to LDN 1225 but projected close (15) to it. In addition, we note below that there exist a background cloud component at the same location of LDN 1225, which is termed as background cloud of LDN 1225. In order to examine the physical connection of this component with NGC 7538, we have constructed the position-velocity (PV) plots along the two cuts (cf., Figure 1(b)) using 12CO data as shown in Figures 5(a) and (b). Evidently, the emissions from LDN 1225 and its background cloud are concentrated, respectively, at 11.2 km s-1 and 54.5 km s-1. These two components are located at the same position of the sky (distributed between two horizontal dashed lines) but at different distances (correspond to two dashed vertical lines). Interestingly, the 12CO emission from NGC 7538 has been widely distributed between 40.6 km s-1 and 60 km s-1 with a prominent peak emission at 56 km s-1, which is close to the 54.5 km s-1 component from the background cloud. Moreover, the existence of faint 12CO emission (green contours around 54.5 km s-1 in Figures 5(a) and (b)) between background cloud and NGC 7538 suggests a physical connection between them. Therefore, hereafter we consider background cloud of LDN 1225 is nothing but the region of NGC 7538 lying at 2.65 kpc.
Based on the above paragraph, we consider 18 stars with distances 2.65 kpc as the background stars of NGC 7538 and are mentioned as “BG-NGC 7538" in the column 10 of Table 2. These stars are excluded from the further analysis, because their polarizations might have comprised of the dust properties and B-field orientations of both clouds NGC 7538 and LDN 1225. The remaining 118 stars having distances between 830 pc – 2.65 kpc, as highlighted within the yellow background in Figure 3, were considered as the true background stars representing the dust properties and B-field orientation of the cloud LN 1225. These stars are mentioned as “BG" in column 10 of Table 2.
Gaussian fits are performed to the polarization distributions of 61 FG and 118 BG stars as shown in the Figure 6. Resultant mean and standard deviation of and for FG stars are 1.4 0.4% and 61 11 and of and for the BG stars are 2.8 1.0% and 87 11, respectively.
3.4 Foreground interstellar polarization (ISP)
As shown in Figures 3(c) and (d), the Stokes parameters of 61 FG stars follow a monotonically increasing trend by following a straight line. We took the advantage of this clean set of data to evaluate the foreground interstellar polarization (ISP) component. We performed weighted linear fits (red thick lines) to the distance versus and parameters. The resultant parameters at 830 pc are 0.9 0.1% and 1.40.1% and the corresponding and values are 1.70.1% and 612. These values are considered as the ISP contribution. Similar methodology has been adopted to estimate the ISP contribution and retrieve the intrinsic polarizations of nearby clouds (eg., Eswaraiah et al, 2013; Neha et al, 2018), B[e] stars (eg., Lee et al, 2018), and Supernova (Kumar, B., et al. under review).
3.5 Foreground polarization correction to infer B-field structure in LDN 1225
In order to retrieve the true polarization contributions from the cloud LDN 1225, we subtract ISP Stokes parameters ( 0.90.1%, 1.40.1%) vectorially from those ( and ) of 118 BG stars and obtained intrinsic Stokes parameters ( and ) of the cloud using the following relations.
| (1) | |||
| (2) |
We then estimate
| (3) | |||
| (4) |
Here, the subscript ‘C’ stands for the cloud, LDN 1225, component. The values lie between 0.3% – 6.8%, with a Gaussian mean and dispersion of 2.41.0%. The values lie between 63 – 128, with a Gaussian mean and dispersion of 10611. This small dispersion in polarization angles implies an uniform B-field orientations within the parts of the cloud. The Gaussian fits to the and are shown in Figures 7(a) and (b).
In order to test if ISP has any significant impact on the cloud polarization components, we have constructed the histograms of and = as shown in Figures 7(c) and (d). The Gaussian fit resultant mean and dispersion of are 0.5% and 0.6% and similarly the mean and dispersion of are 14 and 4, respectively. This implies that the FG medium has a depolarization effect by on the cloud’s polarization and a systematic rotation effect by on the cloud’s B-field component.
Figure 1(b) displays the B-field morphology of the LDN 1225 region based on the polarization measurements ( and ) of 118 BG stars as depicted with yellow vectors. It should be noted here that these measurements are corrected for ISP contribution. Based on the 12CO data, the position angle of the major axis of LDN 1225 is found to be 102 (depicted with a white dashed ellipse in Figure 1; see Section 4.5 and Table 5) and the mean B-field orientation inferred by optical polarimetry () of the globule is 10611. This implies that the cloud structure (major axis of the globule) is nearly aligned parallel to the B-fields. This morphological correlation between the cloud structure and B-fields manifests an important role of B-fields in the formation of the globule, detailed discussion on which will be given in Section 4.5.
The B-field orientation of LDN 1225, inferred from mean 106 11, is offset by 38 from the position angle, , of the Galactic plane (GP) at 1.22 (white line in Figures 1(a) and (b) and dashed vertical line in Figure 6(b)). Nonetheless, within the error, the foreground component (mean 60 11) is parallel to the GP component suggesting that the dust grains of the FG medium are aligned by the local B-fields that are parallel to the GP.
3.6 Polarizations of FG and cloud mediums of CepOB3 based on optical polarimetry
By adopting the same distance criteria as of LDN 1225, we identify FG and BG stars in 19 fields of CepOB3 (Section 2.2). Furthermore, assuming that LDN 1225 and CepOB3 share a common ISP contribution (cf. Section 3.5), we correct for it from the polarizations of BG stars and then derive the cloud polarizations of 19 fields of CepOB3. The resultant weighted mean polarizations of foreground and cloud mediums of these 19 fields and their central coordinates, number of stars in each field, and the instrument (or) source used are given in Table 4.
Similarly, -band polarizations of 15 stars, distributed within the area of CepOB3, are extracted from (Heiles, 2000) catalog. Of these, 9 are FG and 6 are BG stars according to their distances from GAIA DR2 as well as our analyses concerning the identification of FG and BG stars (eg., Section 3.3). Their coordinates, HD numbers, and polarizations are given in Table 4.
A detailed discussion on the B-field morphologies of FG and cloud mediums of CepOB3 are given in Section 4.1.
3.7 Gas velocity dispersion and number density in LDN 1225 using PMO CO data
In order to evaluate the relative importance of B-field to turbulence and gravity, we need to estimate the B-field strength and its pressure. For this, we extract gas velocity dispersion () and number density () from the 12CO(1 – 0) molecular line data from the PMO MWISP project.
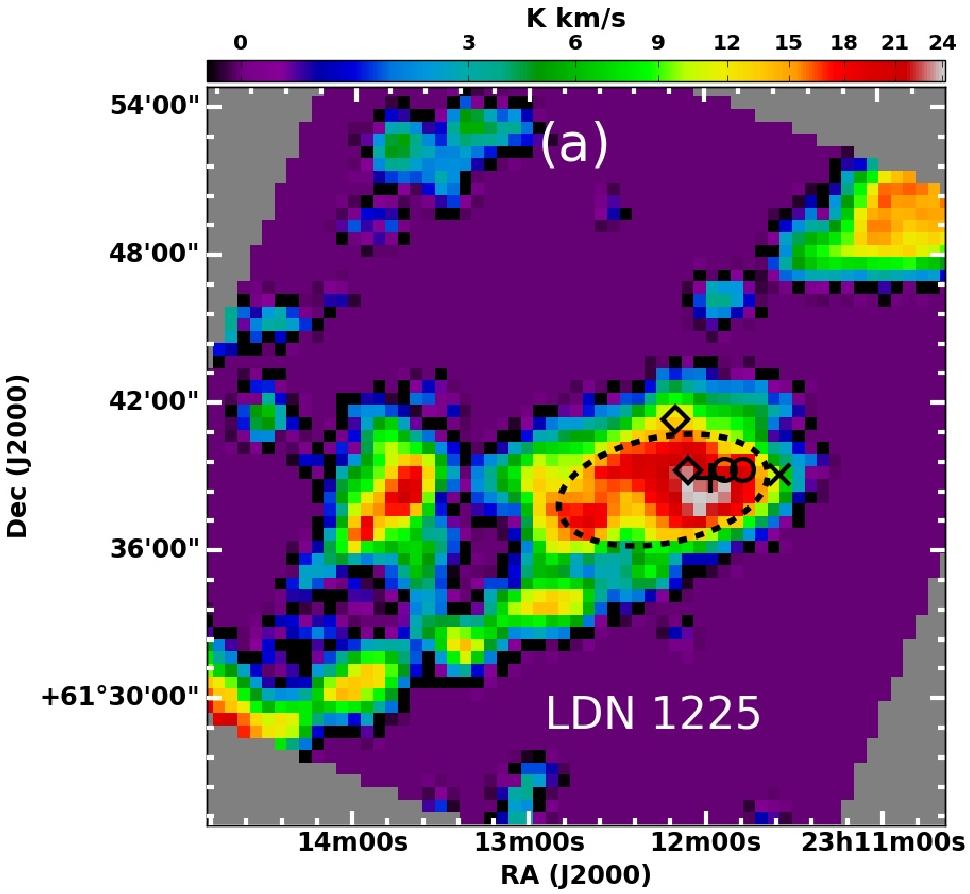
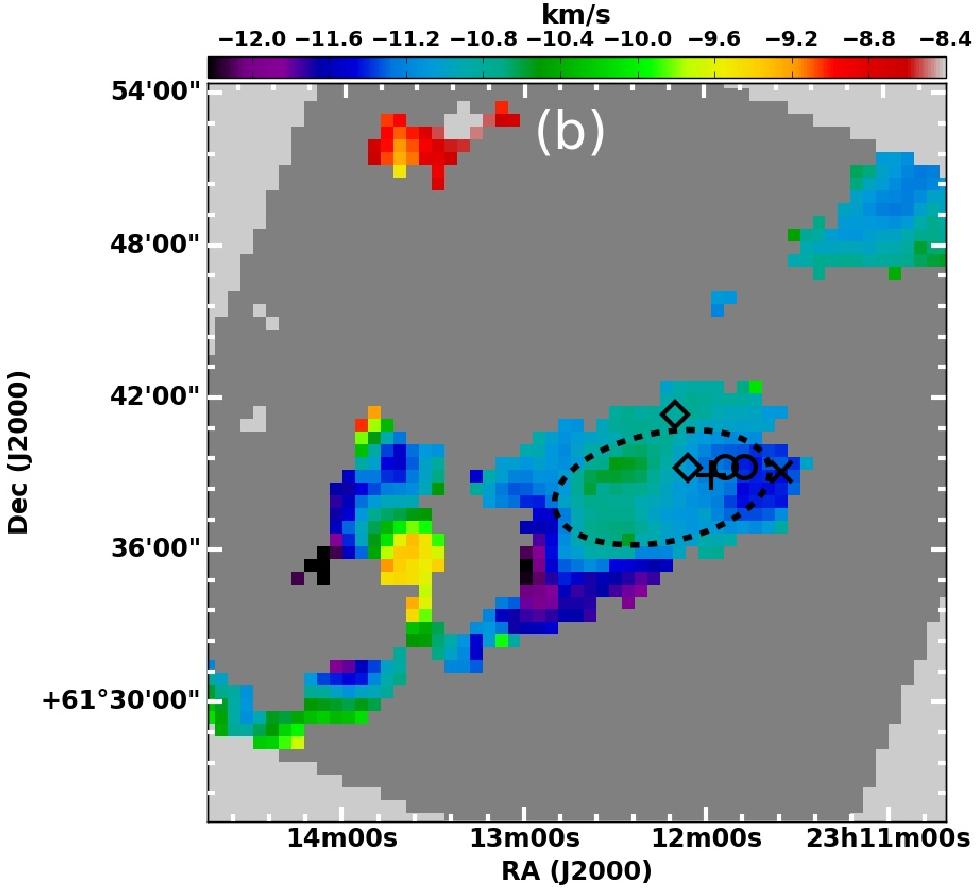
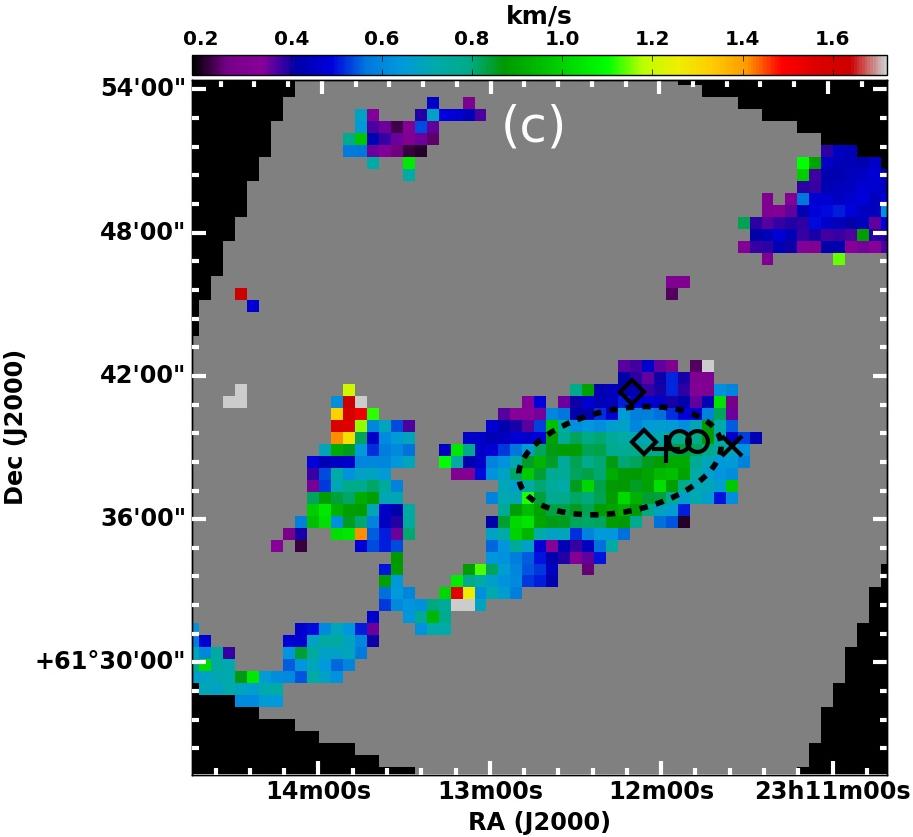
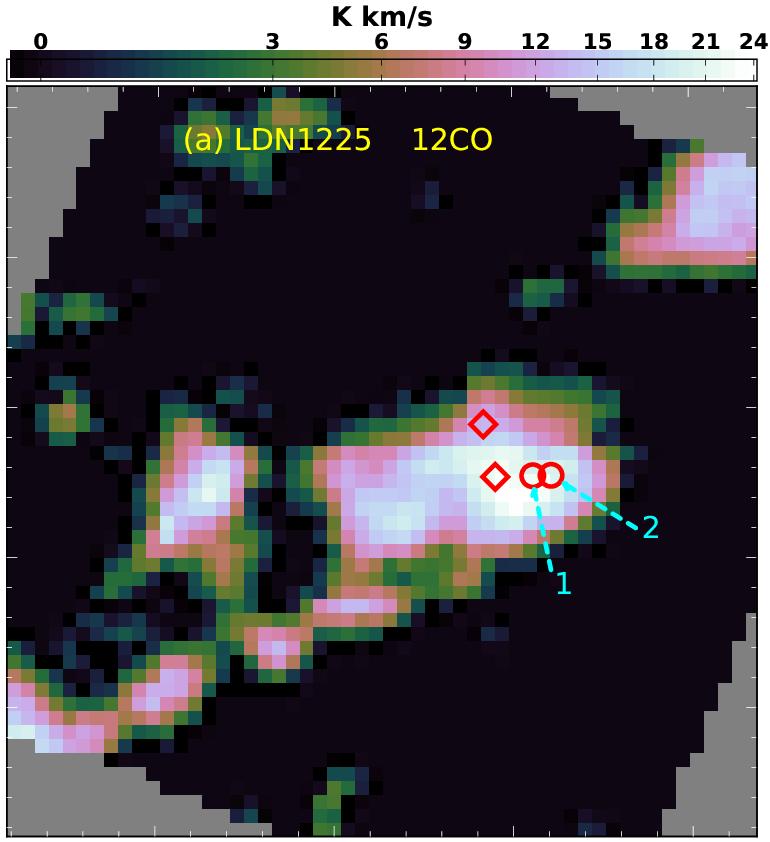
Figure 8 show the 12CO(1 – 0) total integrated intensity, velocity, and velocity dispersion maps. These maps were constructed using the velocity channels ranging from 13 km s-1 to 3 km s-1, and having the brightness temperature () above 3 times of the rms noise. This selection criterion on the range of velocity channels excludes CO emission from the background cloud NGC 7538 (at 54.5 km s-1; cf., Figures 5(a) and (b)).
Using CASA software, a two-dimensional Gaussian is fitted to the CO velocity integrated intensity map of LDN 1225 and the resultant spatial extents of major and minor axes, and the position angle of the major axis are 86 02, 43 01, and 102 1, respectively, and are represented with a black dashed ellipse in Figure 8. These values are consistent with those (84, 42, and 102) derived from FCRAO CO data as given in the vizier catalog333Available at http://cdsarc.u-strasbg.fr/viz-bin/Cat?J/ApJS/144/47.
The mean integrated intensity (W(CO)) distributed within the extent of LDN 1225 (black ellipse, Figure 8) is 17 4 K km s-1. Using the CO-to-H2 conversion factor, (2.0 0.6)1020 cm-2 (K km s-1)-1 (Bolatto et al, 2013, see also Dame et al 2001 and Sofue et al 2016), the mean column density is estimated as (3.4 1.3)1021 cm-2. Assuming the diameter of minor axis, 4301 (equivalent to 1.04 0.02 pc at 830 pc), as the thickness of LDN 1225, the mean number density, , is (1.1 0.4)103 cm-3.
Gaussian fit to the 12CO mean versus spectrum over an entire region of LDN 1225 resulted a gas velocity dispersion 0.88 0.01 km s-1. In addition, the fitted values of and are 11.08 0.01 km s-1 and 4.96 0.04 K, respectively.
3.8 B-field strength in LDN 1225
Using the dispersion in the B-fields 11.4 0.3 (cf. Section 3.5), gas velocity dispersion 0.88 0.01 km s-1 (cf. Section 3.7), and the mean number density (1.1 0.4)103 cm-3 (cf. Section 3.7) for LDN 1225, we estimate B-field strength using the Davis-Chandrasekhar-Fermi method (more commonly referred to as the Chandrasekhar-Fermi (CF) method; Davis, 1951; Chandrasekhar & Fermi, 1953):
| (5) |
The mass density , where is the hydrogen volume density, is the mass of the hydrogen atom, and is the mean molecular weight per hydrogen molecule which includes the contribution from helium. The correction factor 0.5 is included based on the studies using synthetic polarization maps generated from numerically simulated clouds (Ostriker et al, 2001) which suggest that for 25, B-field strength is uncertain by a factor of two. The estimated B-field strength is 56 10 G. Implications based on the relative importance of B-field to turbulent pressure in the formation and evolution of the globule LDN 1225 is discussed in Section 4.2.
4 Discussion
4.1 Association of LDN 1225 with CepOB3
Based on a detailed comparisons of , distance, and B-fields of LDN 1225 with those of CepOB3, we discuss whether LDN 1225 is associated with CepOB3. According to the 12CO and 13CO data (from PMO MWISP) of LDN 1225, the mean values are 11.08 0.01 and 11.12 0.02 km s-1, respectively. These values are consistent with the mean of 11.2 km s-1 of a number of dark globules, namely, LDN 1210, LDN 1216, LDN 1218, LDN 1220, LDN 1227, LDN 1232, etc (Yonekura et al, 1997), which are part of CepOB3. Similarly, several dense clumps of CepOB3 such as LDN 1211, Cep A, Cep B, Cep C, Cep E, and Cep F are also found to have values with in a range of 8 to 12 km s-1 (Sargent, 1977; Yu et al, 1996). These inferences suggest that LDN 1225 is kinematically associated with the CepOB3.
As per our present work, LDN 1225 is located at the distance of 83083 pc (c.f., section 3.2), which is consistent with the distance 700 pc assigned to LDN 1225 assuming its association with CepOB3 (Sargent, 1977; Dame et al, 1987; Launhardt et al, 1997). The calibrated distance of CepOB3 via principal component analysis (under the assumption of an universal relationship between velocity dispersion and spatial scale within the clouds) on the Five College Radio Astronomy Observatory (FCRAO) Outer Galaxy Survey (OGS) CO data is 730 120 pc (Brunt et al, 2003). Using the methanol maser parallaxes, the distance of Cep A is ascertained to be 700 40 pc (Moscadelli et al, 2009). This distance value is consistent with those quoted in other studies (Blaauw et al, 1959; Crawford et al, 1970; Sargent, 1977; Ladd et al, 1997; Hartigan et al, 2000; Kun et al, 2008). Therefore, LDN 1225, located at 83083 pc, is spatially and kinematically associated with the CepOB3.
Furthermore, using the polarization observations of 19 fields (Figure 9(a)), we compare the B-fields in the FG and cloud mediums of CepOB3 with those of LDN 1225 to test if the large scales B-fields are preserved at smaller scales. B-field orientations of FG and cloud mediums of CepOB3, using our observations as well as Heiles (2000) data (cf., Section 3.6), are shown in Figures 9(b) and (c). The weighted mean B-field orientation for the FG medium of CepOB3 is 67 with a standard deviation of 26 (Figure 9(b)), while for LDN 1225 derived as 61 with a standard deviation of 11 (cf., Section 3.3). This implies that the B-fields in the FG mediums of both LDN 1225 and CepOB3 are nearly similar, and are dominated by the GP component of 68. Similarly, the weighted mean B-field orientation in CepOB3 is 113 with a standard deviation of 29 (as shown in Figure 9(c)), while that for LDN 1225 is with a standard deviation of 11 (cf. Section 3.5). This result again suggests that, within the uncertainty, the mean B-fields in CepOB3 and LDN 1225 are similar implying that B-fields at the small scales of LDN 1225 are inherited from those at large scales of CepOB3. Hence, these large scale B-fields of CepOB3 could be important in governing the formation and evolution of LDN 1225.
Therefore, in conclusion, LDN 1225 is spatially, kinematically, and magnetically has similar characteristics as those for CepOB3, thereby confirming its association with CepOB3.
4.2 Cloud stability
To understand the importance of B-fields with respect to turbulence, we estimate the magnetic pressure and turbulent pressure using the relations and (where ) as (12 5)10-11 dyn cm-2 and (4 1)10-11 dyn cm-2, respectively. The mean / is estimated to be 3 2, suggesting that dominant role of B-fields over turbulence.
To infer the importance of B-fields with respect to gravity, we estimate the mass-to-magnetic flux ratio in units of critical value using the following relation (Crutcher et al, 2004; Chapman et al, 2011),
| (6) |
where N∥(H2) is the column density, in units of 1021 cm2, along the magnetic flux tube and is the total B-field strength in G. Critical mass-to-flux ratio, ()crit 1/ (Nakano et al, 1978), corresponds to the stability criterion for an isothermal gaseous layer threaded by the perpendicular B-fields. The cloud region with i.e., 1 will collapse under its own gravity and cloud is considered to be supercritical. The cloud with 1 will be in a subcritical state because of the major support rendered by B-fields. Because of the projection effects between (H2)/ and the actual measured (H2)/ (where is the plane-of-the-sky B-field strength), B-fields parallel to the cloud structure, and assuming random orientation of B-fields with respect to the line of sight, the actual value of becomes (3/4) (PlanckCollaborationetal, 2016, see their Appendix D.4444In order to correct for the projection effects on the estimated mass-to-flux ratio (in critical units), a factor 1/2 is valid for a spheroid cloud, 1/3 for an oblate spheroid flattened perpendicular to the B-fields, and 3/4 for a prolate spheroid elongated along the B-fields (similar to our case).). Therefore, equation (6) can be re-written as 5.7 . Using the (H2) (3.4 1.3)1021 cm-2 (cf. Section 3.7) and 56 10 G (cf. Section 3.8) for LDN 1225, is estimated to be 0.35 0.15. This value suggests that LDN 1225 is magnetically subcritical implying strong support by the B-fields, at least, for the outer low-density parts where optical polarimetry is reliable. However, the situation at relatively high dense regions may be different because of the dominance of gravity.
Based on the NH3 observations of LDN 1225 by Scappini et al (1996), the peak emission occurs at 11.5 0.1 km s-1, with a line width 0.8 0.1 km s-1. They consider LDN 1225 as an inactive globule. However, as per the IRAS Serendipitous Survey Catalog (Kleinmann et al, 1986), within the 8 diameter, LDN 1225 hosts IRAS source IRAS 23094+6122 (see also Maheswar et al, 2006). Additionally, in this study, based on mid-infrared (MIR) and far-infrared (FIR) images, we find that LDN 1225 hosts two bright MIR YSOs and two Herschel/PACS 70 m sources (cf., Section 4.6). These sources are located in the dense parts of LDN 1225, suggesting LDN 1225 is not a quiescent cloud but on the verge of collapse and forming stars.
4.3 Structure function analysis and the ratio of turbulent-to-order B-field strength
Structure function analysis (or angular dispersion function) has been used to derive the ratio of turbulent-to-order B-field strength (). To separate the turbulent components from those of non-turbulence, we plotted (Falceta-Gonçalves et al, 2008; Franco et al, 2010; Poidevin et al, 2010; Santos et al, 2012; Eswaraiah et al, 2013; Franco & Alves, 2015; Santos et al, 2016), the square root of the second-order structure function or angular dispersion function (ADF)555The angular dispersion function (ADF) is defined as the square root to the average of the squared difference between the polarization angles measured for all pairs of points () separated by a distance ., as a function of distance () as shown in Figure 10. We used the polarization angles () of 118 BG stars to compute , which depicts how the dispersion of the polarization angles changes as a function of the length scale in LDN 1225.
The square of the dispersion function can be approximated as follows (Hildebrand et al, 2009):
| (7) |
where is the dispersion function computed from the data. The quantity is the measurement uncertainties, which is simply the average of the variances on in each bin. The quantity is the intercept of a straight line fit to the data (after subtracting ). Hildebrand et al (2009) have derived the equation for to find the ratio of turbulent to the large-scale magnetic field strength:
| (8) |
In Figure 10, we show the ADF versus displacement using of 118 BG stars for LDN 1225 region. The errors in each bin are similar to the size of the symbols. Each bin denotes i.e., the ADF corrected for the measurement uncertainties. Bin widths are in logarithmic scale. Only the first five data points were used in the linear fit to ensure that the length scale () in the fit (0.003 to 0.5 pc) is greater than the turbulent length scale () (which is of the order of 1 milli-parsec (mpc) or 0.001 pc; eg., Li et al 2008) and much shorter than the cloud length scale ( pc) i.e., , to the data (equation (7)) versus distance squared. The fitted function is denoted with a thick dotted line. Since our optical polarimetric observations have a low resolution due to the available limited number of point sources, the minimum length we probed is 31 mpc. The turbulent contribution to the total ADF is determined by the zero intercept of the fit to the data at 0. The net turbulent component, , is estimated as 10 2 (or 0.17 0.04 rad). This dispersion value (10 2) estimated using structure function analysis is nearly similar to the dispersion in obtained using Gaussian fit ( = 11; Section 3.5). The ratio of the turbulent to large-scale magnetic field strength () is computed using equation (8) as 0.12 0.03. This suggests that the turbulent component of the field is very small compared with the non-turbulent ordered B-field component, i.e., . This suggests that large scale ordered B-fields are dominant over the turbulent component in the LDN 1225.
4.4 Correlations among the observed multiple components in CO gas and B-fields
The CO mapping with 1.2 m telescope of the Center of Astrophysics, was carried out towards the Perseus arm covering the CepOB3, Cas A and NGC 7538 (Ungerechts et al, 2000). Their survey revealed that of the local arm lie between and km s-1, which is clearly separated kinematically from the distant Perseus arm whose lie between and 80 km s-1 with a mean 54.5 km s-1. It is worth stating here that there exist an emission free irregular band between 45 km s-1 and 20 km s-1 in the PV diagram (Ungerechts et al, 2000, see their Figures 2a and 2b), suggesting a dearth of material within the inner arm. This is also true from PV cuts on 12CO data towards a small area containing LDN 1225 as shown in Figure 5. This result would also suggest the absence of an additional cloud component with a significantly different B-field orientation within the inner arm. Therefore, it is worth to claim that values lying between 70 – 100 (Figure 3(b)) and having distances between 830 pc – 2.65 kpc may correspond to the B-fields of LDN 1225, and hence the dispersion in the values is due to the turbulence with in the cloud. However, a larger dispersion in the corresponding values spanning a range of 1.5 – 5% (Figure 3(a)) is owing to different optical depths, causing different amounts of polarization values as traced by the background stars lying at different parts of the cloud.
Furthermore, the local arm possesses three gas components centered around 5, 5, and 10 km s-1. The 10 km s-1 component with a relatively dense gas is attributed to the CepOB3 located at 800 pc, whereas the other two components with less dense gas may correspond to the diffuse foreground dust layers located between our Sun and CepOB3. It is interesting to state that distribution of gas with the components 5 km s-1 and 10 km s-1 exhibits a continuous spread implying the presence of uniformly distributed tenuous medium up to the CepOB3. This is further corroborated from a continuous increase in the level of polarization as a function of distance (cf., Figure 3) as well as from a smooth variation of with (cf., Figure 2).
Presence of two components can be witnessed in the and distributions of FG and BG stars (Figure 6, sections 3.3 and 3.5). B-field component of the FG medium is oriented along the Northeast–Southwest (with a mean 61 11), while that of the cloud medium is along East–West (with a mean 106 11). These two components, with different mean polarization values, are separated at 2% and 75 (Section 3.1). In summary, our polarization observations revealing two distributions in both degrees of polarization and polarization angles are consistent with two CO cloud components centered around 5 km s-1 and 10 km s-1.
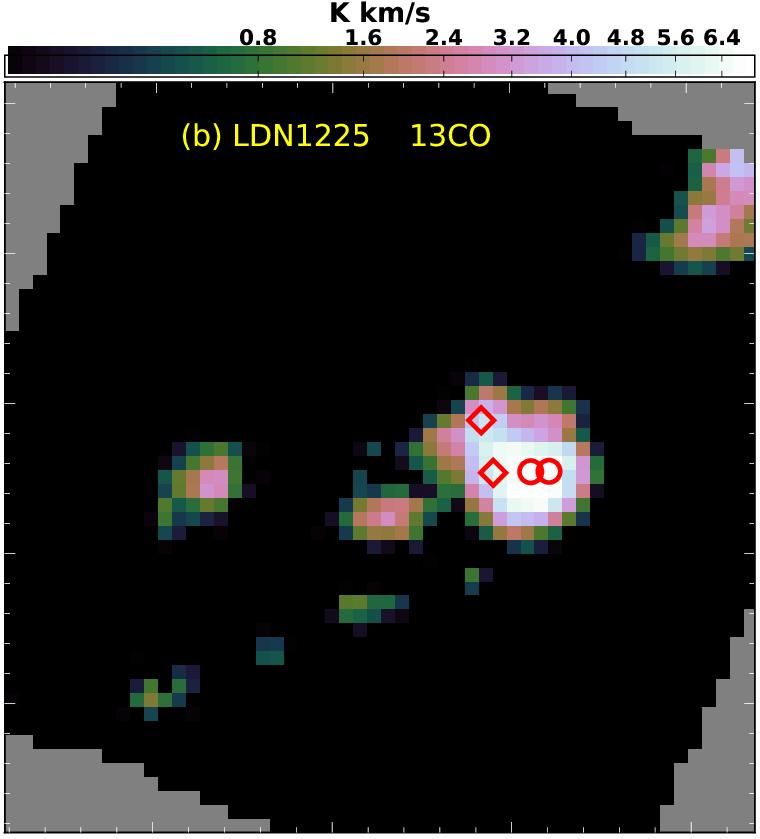
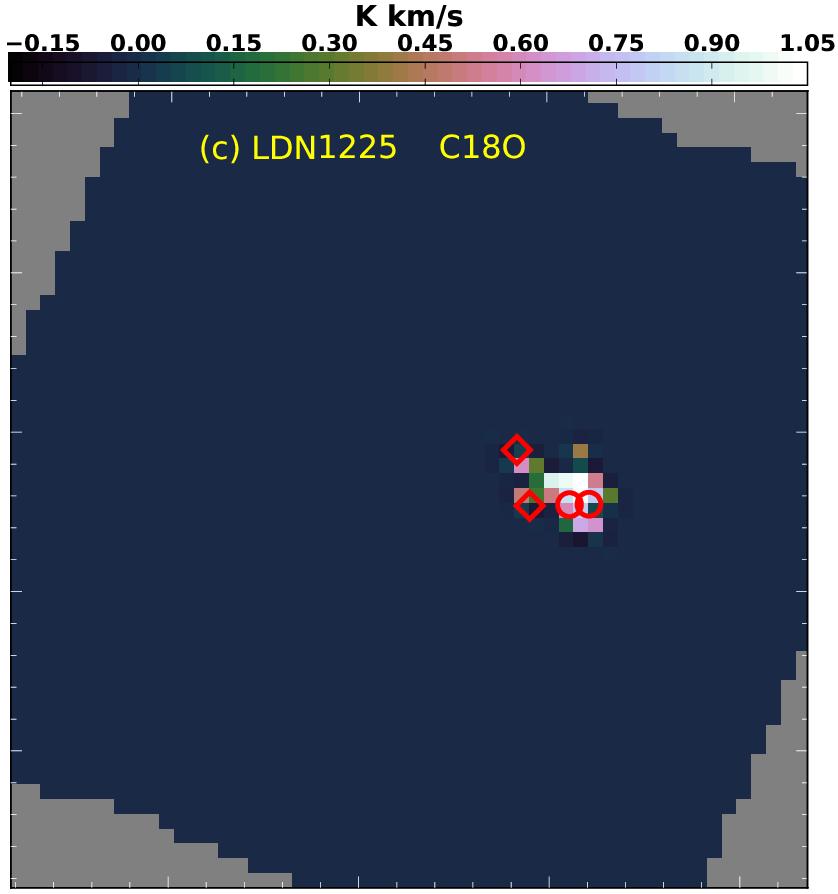
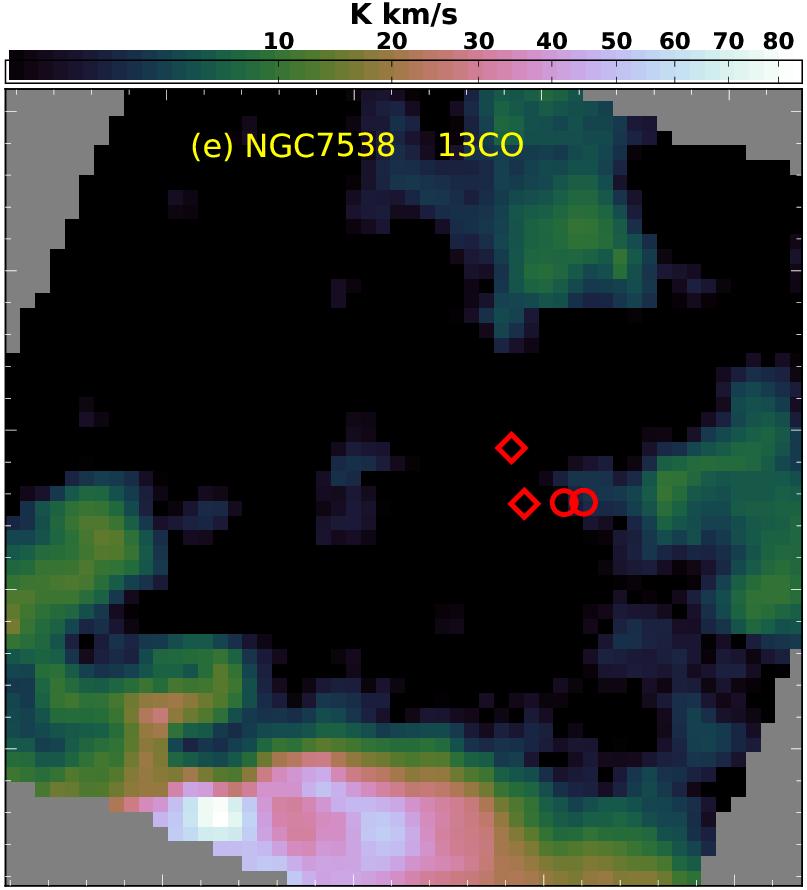
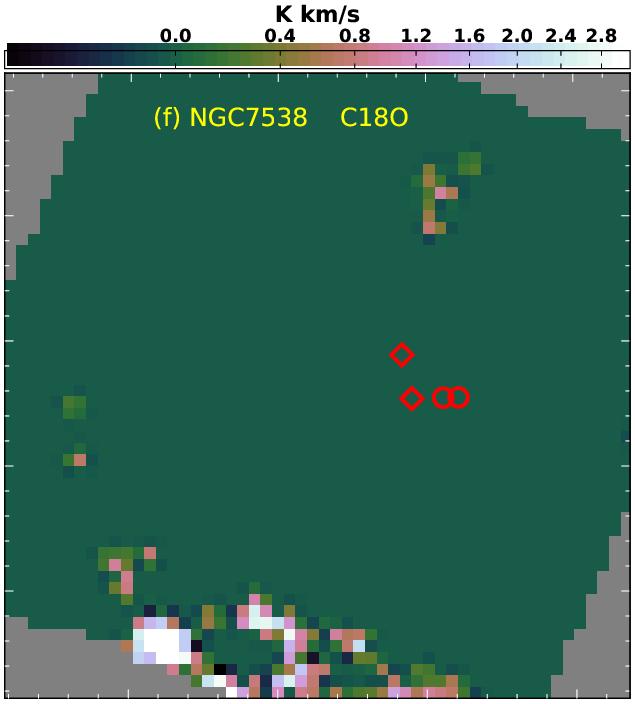
4.5 Geometry of LDN 1225 in 12CO, 13CO, and C18O molecular lines
Generally the 12CO emission comes from the tenuous gas distributed in low density parts of the cloud, whereas the 13CO and C18O emissions come from the inner, denser gas. Since LDN 1225 has been observed simultaneously at these three molecular lines, we compare the ambient mean B-fields orientation with the orientations of major axes of LDN 1225 at different length scales and depths. These comparisons would reveal how the B-fields, turbulence, and gravity interact with the cloud material and govern its structure, stability, and contraction at different scales and depths (Eswaraiah et al, 2013). The advantage in using molecular lines to determine the cloud structure is that the foreground cloud component will be well separated from that of the background in velocity space.
We have employed CASA 2D Gaussian fitting function on the moment 0 maps of 12CO, 13CO, and C18O, respectively shown with red, green, and magenta contours in Figure 11, and extracted the spatial extents and position angles of the cloud elongations. The corresponding fitted central coordinates, FWHMs of major and minor axes, and position angles are given in Table 5. Last column gives the offset () between the cloud position angles () traced by three CO lines and mean B-field orientation (, Section 3.5) of LDN 1225.
The from 12CO is 411, implying low density outer parts of the cloud are nearly aligned parallel with the ambient B-fields, suggesting importance of B-fields in governing the cloud structure. However, values from 13CO and C18O to be 54 11 and 52 14; indicating that, within the error, the PAs of the denser parts of the cloud are neither parallel nor perpendicular to B-fields. This suggests that B-fields of the low-density outer parts may not equally be important in governing the cloud structure at high-density inner parts; in other words turbulence and gravity might be crucial at these denser parts. In order to shed more light on these, we need to probe the B-fields in the denser parts, using NIR and sub-mm polarimetry.
4.6 Association of MIR and 70 m point sources with LDN 1225
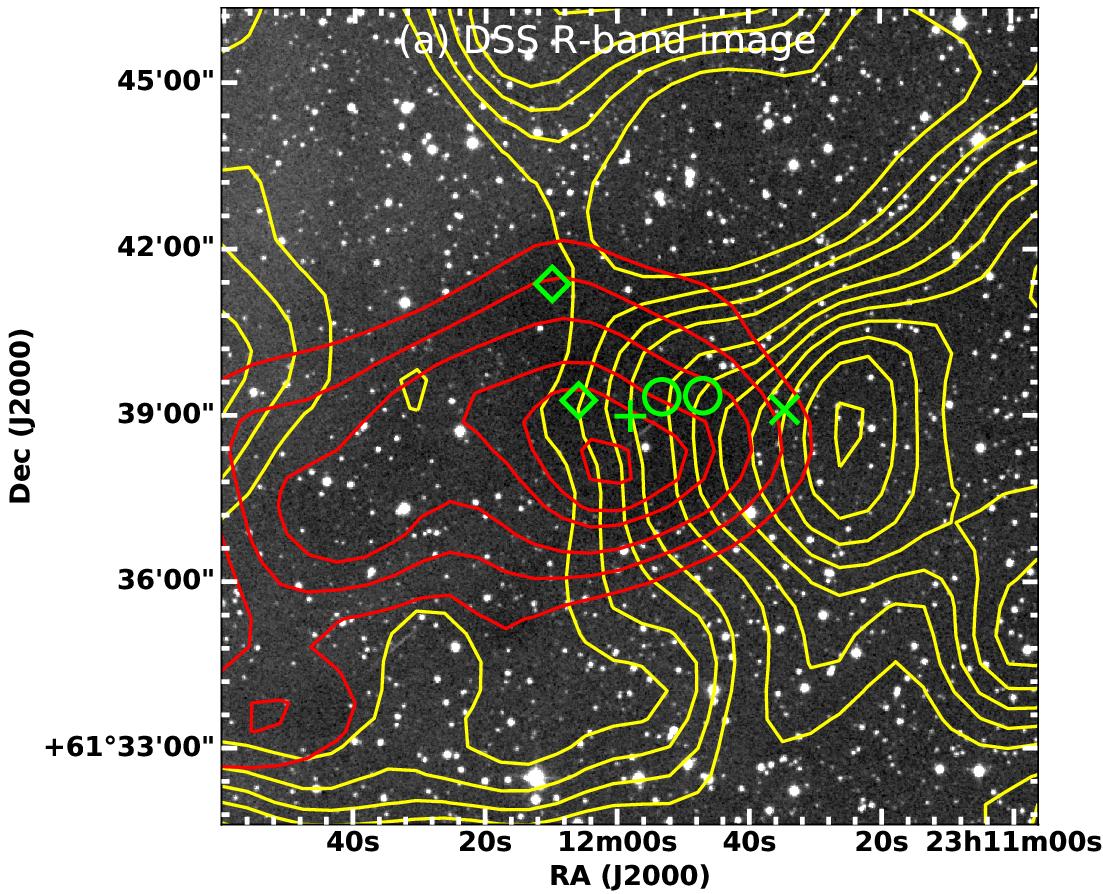
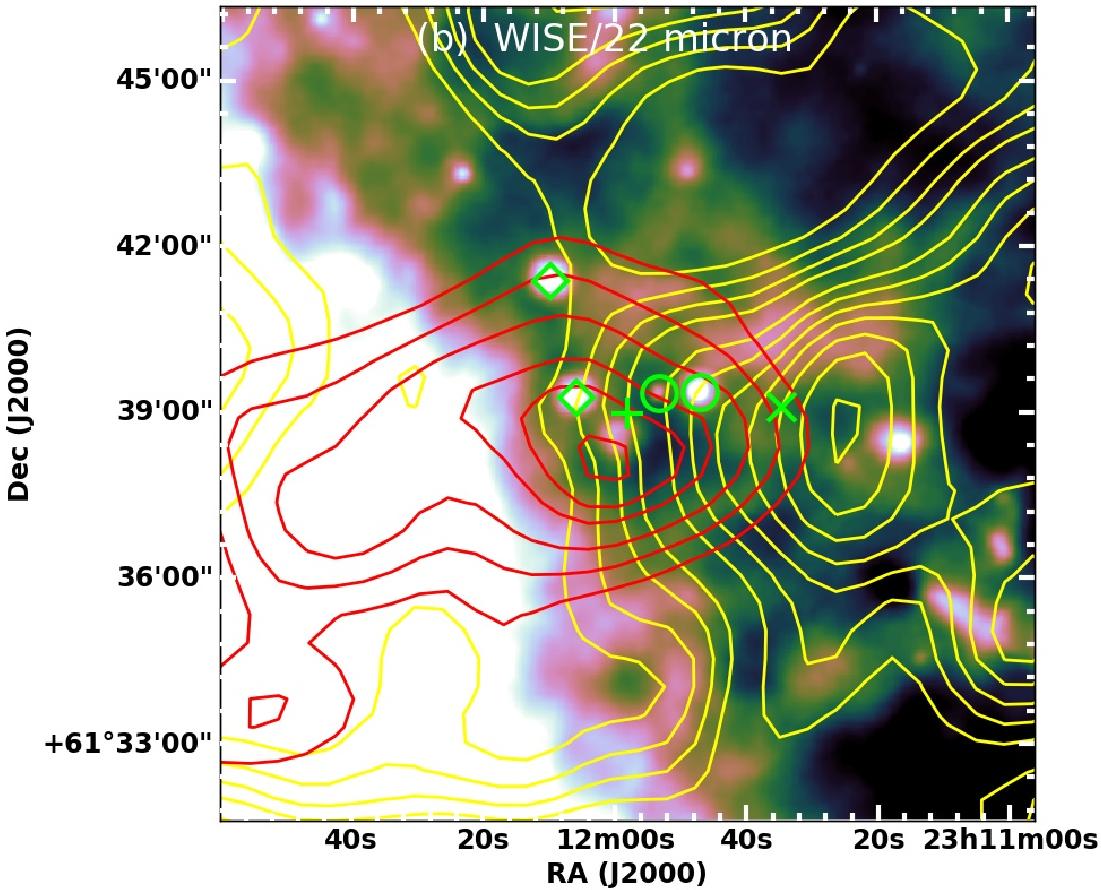
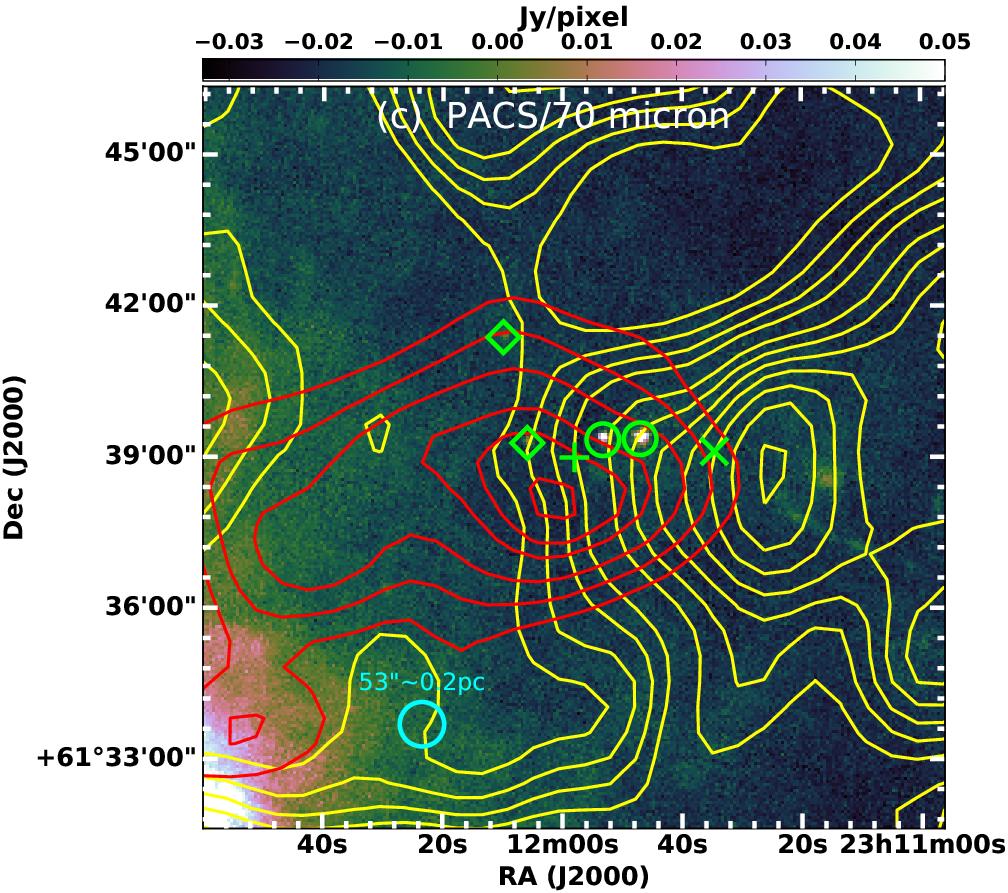
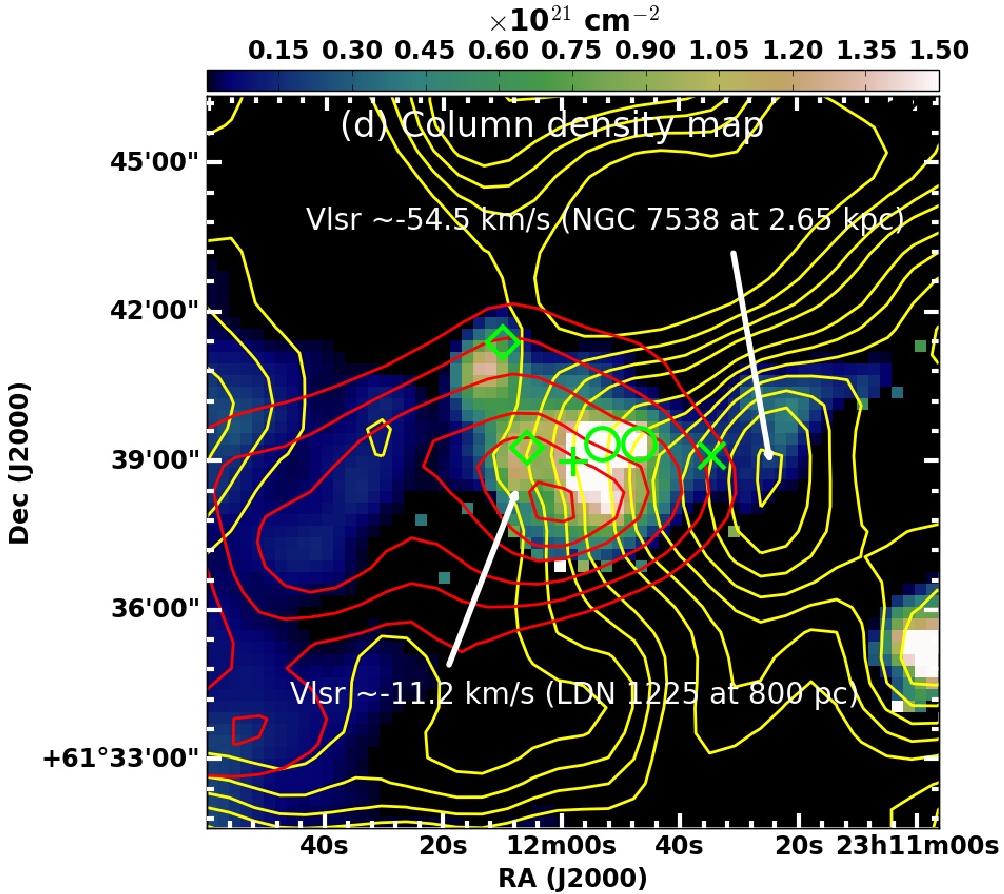
In order to confirm if LDN 1225 is a starless or star forming cloud, we search for the YSOs by examining the multi-wavelengths images of LDN 1225 as shown in the Figure 12. We have identified two MIR (diamonds) and two 70 m (circles) sources, respectively, in the images of WISE 22 m (Figure 12(b)) and Herschel/PACS 70 m (Figure 12(c)). These sources appear to be part of LDN 1225, because as they are located within the extent and center of the cloud as seen in optical absorption (Figure 12(a)) and dust emission inferred from the column density map666Column density map has been constructed by fitting the modified blackbody function on the Herschel PACS and SPIRE fluxes as described in Appendix D of Eswaraiah et al (2017, and references therein). Data have been take from Herschel Infrared Galactic Plane Survey (Hi-GAL; Molinari et al, 2010). (Figure 12(d)). Nonetheless, CO data cubes reveal two overlapping cloud components towards LDN 1225 – one at 11.2 km s-1 (red contours) and the another at 54.5 km s-1 (yellow contours) as shown in Figures 12(a) – (d) (see also PV cuts in Figures 5(a) and (b)). Because of this, a confusion prevails on whether YSOs are originally belong to the LDN 1225 or to the background cloud NGC 7538.
To elucidate more on the association of YSOs, we have searched for the 12CO, 13CO, and C18O emissions from LDN 1225 (top panels) and NGC 7538 (bottom panels), especially, at the locations of the YSOs as shown in Figure 13. Evidently, all YSOs are distributed, not only within the emissions from low-density tracers (12CO/13CO) but also that from dense gas tracer (C18O) of LDN 1225. Moreover, despite of a small amount of 12CO/13CO emission, a complete devoid of C18O emission from NGC 7538 is witnessed at the sites of YSOs. This implies that LDN 1225 comprises of denser gas than background cloud. These results reinforce the fact that LDN 1225 is indeed a star forming dark globule, hosting MIR and 70 m sources in its denser parts.
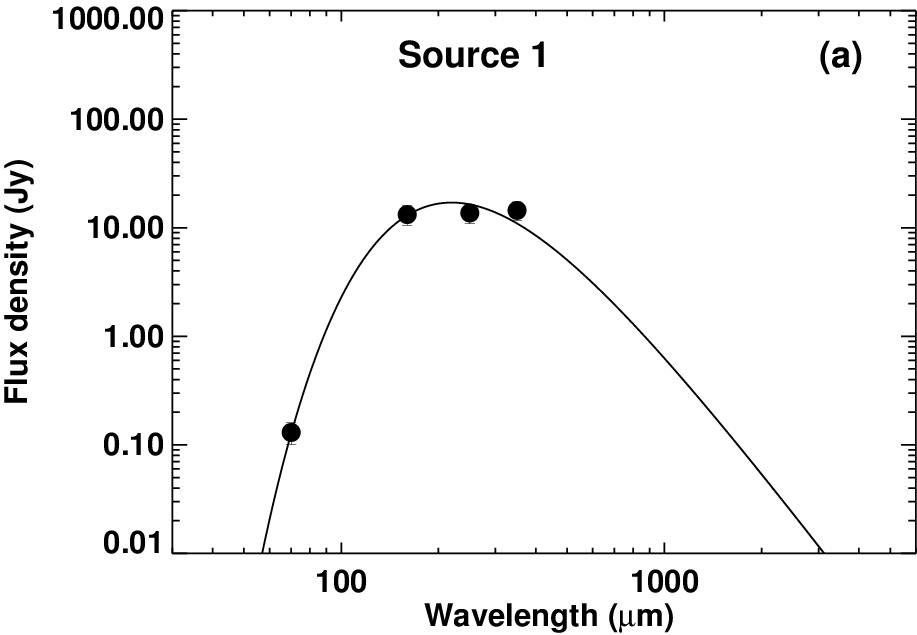
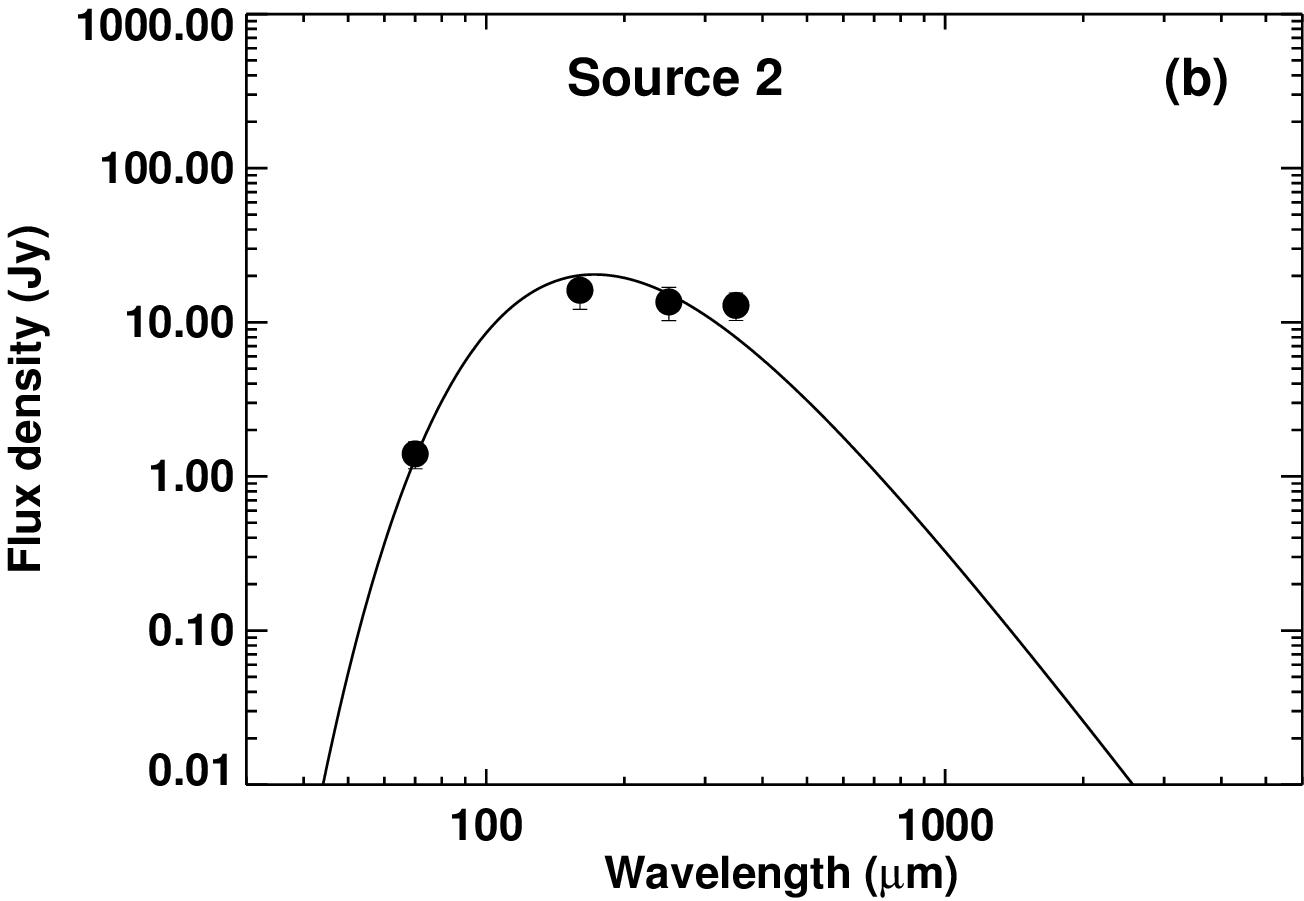
4.7 Properties of 70 m sources
Since 70 m sources are brighter in FIR and fainter in NIR and MIR wavelengths (cf., Figure 12), their disks may have negligible contribution to the shape of spectral energy distribution (SED) at 100 m (eg., Whitney et al, 2005). The main contributor to the SED of 70 m sources could be from their envelopes. In order to study the nature of these 70 m sources (cf., Section 4.6 and Figure 13), we have performed aperture photometry on the Herschel images as documented in Balog et al (2014) and modified blackbody fitting was performed on the fluxes at 70, 160, 250, and 350 m777Fluxes at 500 m have been excluded, owing to the low-resolution of the 500 m beam. This is done in order to avoid the baisness in the fitting procedure due to overestimation of fluxes at 500 m because of source confusion and inclusion of excess background emission. as shown in Figure 14(a) and (b).
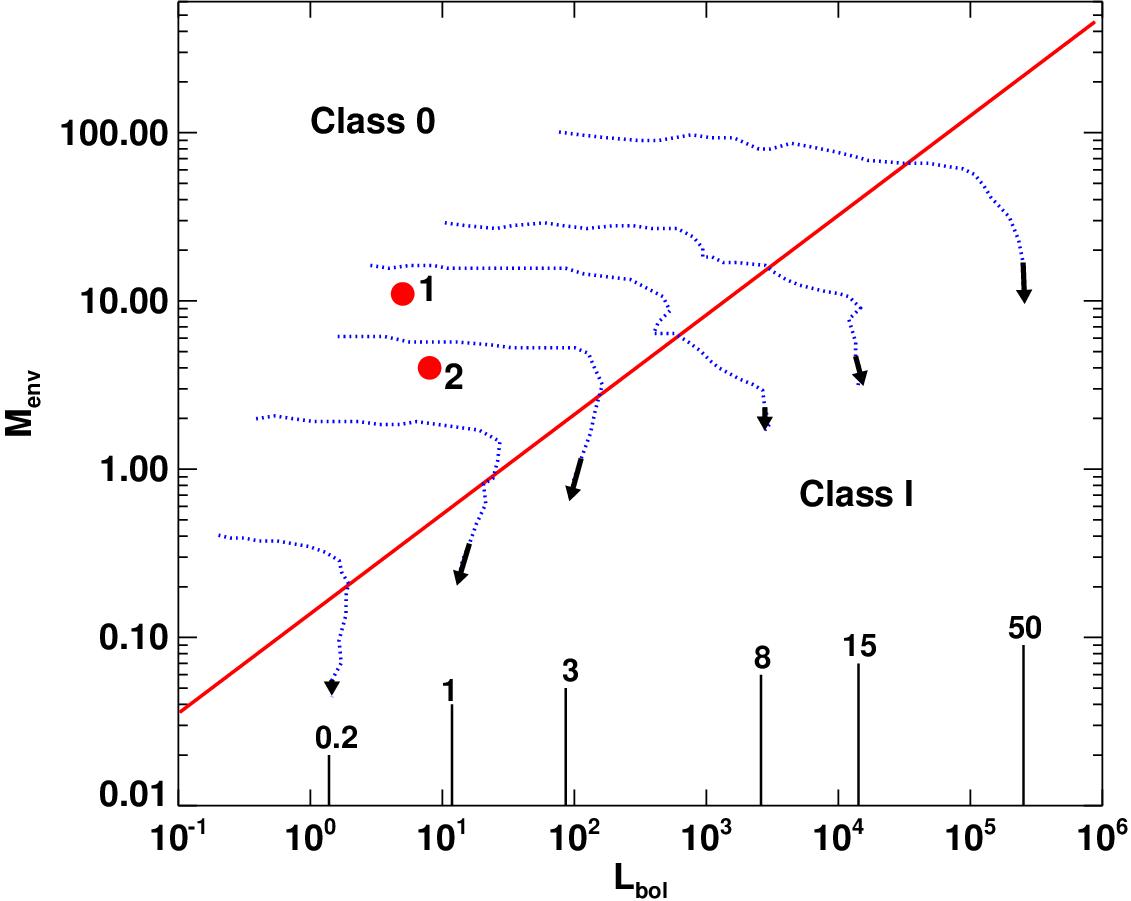
The computed envelope masses (), bolometric luminosities (), and dust temperatures () are 11 M☉ & 4 M☉, 5 L☉ & 8 L☉, and 13 K & 17 K, respectively, for sources 1 & 2. SED fits suggest that the envelopes of the two 70 m sources are of low-mass and low-luminous Class 0 protostars.
Furthermore, we have used the above physical parameters of these sources to infer their final evolutionary status based on the – diagram (Figure 15). The location of the two 70 m sources in comparison to the evolutionary tracks of protostars with different envelope masses and luminosities (André et al, 2008, and references therein), suggest that they may evolve into stars with their final masses span over 1 M☉ to 5 M☉ at the end phases of accretion (see the tip of the arrows in Figure 15).
4.8 Are the B-fields important to the Star formation in LDN 1225?
If B-fields are important in a cloud to form the cores via ambipolar diffusion process or strong B-field model (Mouschovias, 1976; Shu, 1977; Shu et al, 1987; Mouschovias, 1991; Mouschovias et al, 1999) then (i) the B-field structure in the low density subcritical envelope should be aligned with the cloud structure, (ii) high-density core’s major axis should be perpendicular to the envelope B-fields, and (iii) B-fields within the core should follow an hour-glass shape if the core is in a supercritical state and collapsing.
The first condition is true in LDN 1225 because the mass-to-magnetic flux ratio in units of the critical value, , is 1 suggesting that envelope is in a subcritical state (section 4.2) and hence the low-density envelope is strongly supported by B-fields. In addition, being parallel to the low-density parts (section 3.5), B-fields aid the cloud contraction producing elongated core structures perpendicular to them. However, since the core long axis is neither parallel nor perpendicular to the ambient B-fields (section 4.5), the second condition may not be true in LDN 1225.
High density cores are in a super-critical state as they are collapsing to form stars (Section 4.6). Since we have not probed the B-fields at the core scale and have not derived various parameters (B-field strength, B-field pressure, turbulent pressure, mass-to-flux ratio in terms of critical value, etc), the examination of the strong B-field model (third condition) is beyond the scope of this work. Therefore, to shed more light on whether or not the B-fields are important at core scales, we need to probe the B-fields using NIR/sub-mm polarimetry.
4.9 Extinction law
Dust grain mean size distribution can be evaluated by using the parameter , the total-to-selective extinction which is also termed as extinction law (Cardelli et al, 1989; Olofsson et al, 2010). Though, the mean for the Milky Way Galaxy is 3.1, it varies from one line of sight to the other. To characterize the extinction law towards LDN 1225, we have used two-color diagrams (TCDs) of the form versus , where is the one of the magnitude in broad-band filters, , , , , , or . These diagrams are usually employed to characterize the extinction law in the foreground and cloud (or stellar cluster) mediums (eg., Pandey et al, 2000, 2003; Samal et al, 2007; Eswaraiah et al, 2013; Pandey et al, 2013; Kumar et al, 2014a). Since the distance of LDN 1225 and the number of FG/BG stars are known, as illustrated in Appendix A, we derive the values for the foreground and cloud mediums. For this purpose we have used the optical and NIR photometric data from Table 3.
Based on the two-color diagrams (Figures 16 and 17) and estimated weighted mean values (see Appendix A for more details on the Figures and Table), the following points can be made: (a) FG and BG stars of groups I (stars with photometry) and II (stars with photometry plus polarimetry) exhibit conspicuously two different distributions represented by different amount of slopes and values, (b) within the error, values of FG (BG) stars belong to the two groups are nearly same and consistent with each other, (c) the extinction law in the foreground medium is normal i.e., 3.1 characterized with mean dust grain sizes, and (d) the extinction law in the cloud medium is abnormal i.e., 3.4 characterized with relatively bigger dust grain sizes in the regions of LDN 1225 that we probed with photometry and polarimetry.
Different dust size is found towards different Galactic line of sights. For example, toward the high-latitude translucent molecular cloud direction of HD 210121 (Welty et al, 1992; Larson et al, 1996), is 2.1, whereas toward the HD 36982, molecular cloud direction in the Orion nebula, the values lie between 5.6 – 5.8 (Cardelli et al, 1989; Fitzpatrick, 1999; Draine, 2003). In our work, an abnormal extinction law (with 3.4) in LDN 1225 might have produced by the bigger dust grains resulted via dust grain growth by means of dust coagulation or dust accretion processes. These processes could take place in the molecular clouds because of the prevailing different physical conditions such as low temperatures and high density.
4.10 Extinction versus polarization and polarization efficiency
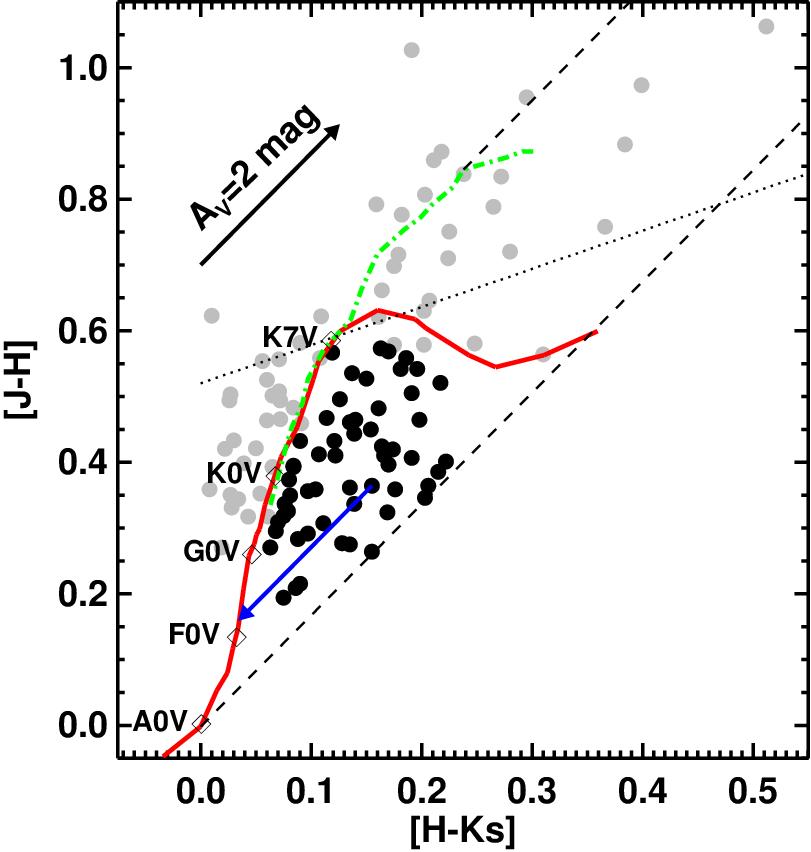
To understand the polarization efficiency of the dust grains of LDN 1225, as illustrated in Appendix B, we estimate the visual extinctions () of the field stars (mainly normal main-sequence stars and giants) of LDN 1225 by dereddenining their NIR colors (Table 3) shown in Figure 18. Figure 19(a) shows the versus plot of 27 stars (of these 3 FG and 24 BG stars). Polarization values of all the stars (except 2 BG stars) distributed below the observed upper limit polarization relation 3% mag-1 (Serkowski et al, 1975) and exhibit a linear trend as a function of extinction.
The polarization efficiency () of the dust grains of LDN 1225 tends to follow a systematically declining trend as a function of extinction (), similar to the other works (e.g., Goodman et al, 1995; Gerakines et al, 1995; Whittet et al, 2008; Eswaraiah et al, 2013; Wang et al, 2017), by following a power-law of the form shown in Figure 19(b). Weighted power-law fit to the data points of 22 BG stars (3 FG and 2 BG stars are excluded from the fit; see figure caption for more details) satisfies the relation . Within the error, the power-law index 0.7 0.5 is consistent with the index 0.7 0.1 for the entire molecular cloud complex IC 5146 using band data (Wang et al, 2017), 0.8 0.1 for Pipe-109 using -band data (Alves et al, 2014), and 0.7 0.1 for L2014 using -band data (Cashman & Clemens, 2014). These reported indices are generally found for the low-density parts of the cloud observed in optical wavelengths, having values of 1 – 4 mag. However, softer indices (0.3 to 0.5) are found towards the dense parts of the clouds with high extinction regions ( 5 mag) observed in NIR wavelengths (Whittet et al, 2008; Jones et al, 2015; Wang et al, 2017).
The negative index 0.7 0.5 implies that dust grains at the low-density outer parts result higher polarization efficiency, while those at relatively high-density inner parts result lower polarization efficiency. This is due to the variation of several factors as a function of extinction (Jones, 1989; Jones et al, 1992; Gerakines et al, 1995; Whittet, 2005; Whittet et al, 2008): (a) the dust grains themselves (size, shape, composition, presence or absence of surface coatings), (b) B-field direction weighted according to the distribution of dust grains along the line of sight, (c) the dust grain alignment efficiency, and (d) the physical conditions of the environment in which dust exist. Since our optical polarimetry is confined to the low-density outer parts of LDN 1225 and due to a small dispersion in the mean B-field orientation of LDN 1225, we interpret that the observed polarization efficiency with an index of 0.7 0.5 is due to the changes in the properties and alignment efficiency of dust grains as a function of extinction.
The power-law index can also infer whether the observed polarization observations trace the B-fields in the cloud. Ideally, a power-law index of may corresponds to ceasing of dust grain alignment producing null polarization thereby providing no clues about the B-field orientation. However, in this work, the index of suggests that the dust grains are still aligned and our optical polarimetry is able to trace the B-fields at relatively less dense, outer parts of the cloud.
5 Summary and conclusions
We have performed single -band polarimetric and multi-band () photometric observations of the stars distributed towards a dark globule LDN 1225. A total of 280 stars were found to have polarization data satisfying the 2 criterion and also 689 stars are found to have optical plus 2MASS photometric data with uncertainties less than 0.1 mag. We use multi-wavelength images from DSS, WISE, Spitzer, and Herschel, parallaxes from GAIA DR2, and CO molecular lines data from PMO. In this work, we investigate the distance of LDN 1225, distribution of dust and B-field orientation as a function of distance, importance of B-fields in the formation and evolution of cloud, and extinction law in the foreground and cloud mediums.
Main results of our study are summarized below:
-
Based on the distance versus polarization, polarization angles, and Stokes parameters plots, we ascertain the distance of LDN 1225 as 83083 pc.
-
Total sample with polarization data are classified into foreground (FG) and background (BG) stars, based on the individual stellar distances in comparison to the cloud distance. FG and BG stars exhibit bimodal distributions in both the level of plarizations and polarization angles.
-
FG stars exhibit increasing trends in their polarizations and Stokes parameters. We make use of these samples to characterize the interstellar polarization (ISP) contribution and the same is subtracted to infer the B-field geometry of the cloud.
-
Using the dispersion in the cloud’s B-field orientations, gas velocity, and number density from PMO CO data, we estimate the B-field strength as 56 10 G, by using the Davis-Chandrasekhar-Fermi relation. We find that magnetic pressure is 3 times higher than the turbulent pressure, and also that the mass-to-magnetic flux ratio in units of critical value is less than one. These results imply that the dominance of B-fields over turbulence and gravity in the envelope of LDN 1225.
-
The morphological correlations between B-fields and cloud geometry at different optical depths, as probed by 12CO, 13CO, and C18O molecular lines, depict that B-fields might not be so important in the core scale of LDN 1225.
-
Based on the WISE and Herschel images along with the CO molecular lines data, we find that LDN 1225 host two MIR and two 70 m sources thereby reinforcing that LDN 1225 is not a starless but star forming dark globule.
-
Structure function analysis suggests that the contribution from the turbulent component of magnetic fields is very small compared with that of the non-turbulent ordered component in LDN 1225.
-
B-fields in LDN 1225 remain coherent with the large scale B-fields of CepOB3.
-
Using the distance versus polarizations, CO molecular lines data, and B-fields, we infer that LDN 1225 is associated and located at the same distance as CepOB3.
-
Using the photometric colors, the extinction law is tested in the foreground and cloud mediums. We find that foreground medium is characterized with the normal extinction law, whereas the cloud medium is with an abnormal extinction law.
-
Polarization efficiency of the dust grains of LDN 1225 decline as a function of extinction and yields a power-law exponent of 0.7 0.5 implying that our optical polarimetry is capable of tracing B-fields in the low-density parts of LDN 1225.
In conclusion, we make use of the polarization and distance information to study the dust distribution and their properties, and B-field orientation of the cloud. This can serve as an important tool to probe the 3D tomography of ISM and B-fields towards the molecular clouds and star forming regions. Photometry has been utilized to investigate the nature of extinction law to characterize the dust properties. Polarimetry along with the molecular lines data serve as an efficient tool to study the correlations between the multiple polarization and cloud components. Multi-wavelength (dust extinction and emission) polarization data, covering different length and density scales, are essential to test the star formation models.
References
- Alves et al (2014) Alves, F. O., Frau, P., Girart, J. M., et al. 2014, A&A, 569, L1
- André et al (2008) André, P., Minier, V., Gallais, P., et al. 2008, A&A, 490, L27
- Andre et al (2000) Andre, P., Ward-Thompson, D., & Barsony, M. 2000, Protostars and Planets IV, 59
- Balog et al (2014) Balog, Z., Müller, T., Nielbock, M., et al. 2014, Experimental Astronomy, 37, 129
- Barnard (1927) Barnard, E. E. 1927, Chicago: University of Chicago Press, 1927
- Bertelli et al (1994) Bertelli, G., Bressan, A., Chiosi, C., Fagotto, F., & Nasi, E. 1994, A&AS, 106, 275
- Bertrang et al (2014) Bertrang, G., Wolf, S., & Das, H. S. 2014, A&A, 565, A94
- Bessell & Brett (1988) Bessell, M. S., & Brett, J. M. 1988, PASP, 100, 1134
- Bolatto et al (2013) Bolatto, A. D., Wolfire, M., & Leroy, A. K. 2013, ARA&A, 51, 207
- Bok & Reilly (1947) Bok, B. J., & Reilly, E. F. 1947, ApJ, 105, 255
- Bontemps et al (1996) Bontemps, S., Andre, P., Terebey, S., & Cabrit, S. 1996, A&A, 311, 858
- Blaauw et al (1959) Blaauw, A., Hiltner, W. A., & Johnson, H. L. 1959, ApJ, 130, 69
- Brunt et al (2003) Brunt, C. M., Kerton, C. R., & Pomerleau, C. 2003, ApJS, 144, 47
- Brunt & Kerton (2002) Brunt, C. M., & Kerton, C. R. 2002, ApJ, 567, L41
- Cardelli et al (1989) Cardelli, J. A., Clayton, G. C., & Mathis, J. S. 1989, ApJ, 345, 245
- Cashman & Clemens (2014) Cashman, L. R., & Clemens, D. P. 2014, ApJ, 793, 126
- Chakraborty et al (2016) Chakraborty, A., & Das, H. S. 2016, Ap&SS, 361, 321
- Chandrasekhar & Fermi (1953) Chandrasekhar, S., & Fermi, E. 1953, ApJ, 118, 113
- Chapman et al (2011) Chapman, N. L., Goldsmith, P. F., Pineda, J. L., et al. 2011, ApJ, 741, 21
- Clemens & Barvainis (1988) Clemens, D. P., & Barvainis, R. 1988, ApJS, 68, 257
- Crawford et al (1970) Crawford, D. L., & Barnes, J. V. 1970, AJ, 75, 978
- Crutcher et al (2004) Crutcher, R. M., Nutter, D. J., Ward-Thompson, D., & Kirk, J. M. 2004, ApJ, 600, 279
- Cutri et al (2003) Cutri, R. M., Skrutskie, M. F., van Dyk, S., et al. 2003, VizieR Online Data Catalog, 2246
- Dame et al (1987) Dame, T. M., Ungerechts, H., Cohen, R. S., et al. 1987, ApJ, 322, 706
- Dame et al (2001) Dame, T. M., Hartmann, D., & Thaddeus, P. 2001, ApJ, 547, 792
- Davis (1951) Davis, L. 1951, Physical Review, 81, 890
- Dobashi et al (2005) Dobashi, K., Uehara, H., Kandori, R., et al. 2005, PASJ, 57, S1
- Draine (2003) Draine, B. T. 2003, ARA&A, 41, 241
- Dutra et al (2002) Dutra, C. M., & Bica, E. 2002, A&A, 383, 631
- Eswaraiah et al (2011) Eswaraiah, C., Pandey, A. K., Maheswar, G., et al. 2011, MNRAS, 411, 1418
- Eswaraiah et al (2012) Eswaraiah, C., Pandey, A. K., Maheswar, G., et al. 2012, MNRAS, 419, 2587
- Eswaraiah et al (2013) Eswaraiah, C., Maheswar, G., Pandey, A. K., et al. 2013, A&A, 556, A65
- Eswaraiah et al (2017) Eswaraiah, C., Lai, S.-P., Chen, W.-P., et al. 2017, ApJ, 850, 195
- Falceta-Gonçalves et al (2008) Falceta-Gonçalves, D., Lazarian, A., & Kowal, G. 2008, ApJ, 679, 537
- Franco et al (2010) Franco, G. A. P., Alves, F. O., & Girart, J. M. 2010, ApJ, 723, 146
- Franco & Alves (2015) Franco, G. A. P., & Alves, F. O. 2015, ApJ, 807, 5
- Frerking & Langer (1982) Frerking, M. A., & Langer, W. D. 1982, ApJ, 256, 523
- Fitzpatrick (1999) Fitzpatrick, E. L. 1999, PASP, 111, 63
- Gaia Collaboration et al (2016a) Gaia Collaboration, Prusti, T., de Bruijne, J. H. J., et al. 2016, A&A, 595, A1
- Gaia Collaboration et al (2016b) Gaia Collaboration, Brown, A. G. A., Vallenari, A., et al. 2016, A&A, 595, A2
- Gaia Collaboration et al (2018) Gaia Collaboration, Brown, A. G. A., Vallenari, A., et al. 2018, A&A, 616, A1
- Galli et al (2009) Galli, D., Cai, M., Lizano, S., & Shu, F. H. 2009, Revista Mexicana de Astronomia y Astrofisica Conference Series, 36, 143
- Gerakines et al (1995) Gerakines, P. A., Whittet, D. C. B., & Lazarian, A. 1995, ApJ, 455, L171
- Girart et al (2006) Girart, J. M., Rao, R., & Marrone, D. P. 2006, Science, 313, 812
- Goodman et al (1995) Goodman, A. A., Jones, T. J., Lada, E. A., & Myers, P. C. 1995, ApJ, 448, 748
- Goodman et al (1998) Goodman, A. A., Barranco, J. A., Wilner, D. J., & Heyer, M. H. 1998, ApJ, 504, 223
- Gong et al (2016) Gong, Y., Mao, R. Q., Fang, M., et al. 2016, A&A, 588, A104
- Güver & Özelz (2009) Güver, T., & Özel, F. 2009, MNRAS, 400, 2050
- Hartigan et al (2000) Hartigan, P., Morse, J., & Bally, J. 2000, AJ, 120, 1436
- Hartley et al (1986) Hartley, M., Tritton, S. B., Manchester, R. N., Smith, R. M., & Goss, W. M. 1986, A&AS, 63, 27
- Hildebrand et al (2009) Hildebrand, R. H., Kirby, L., Dotson, J. L., Houde, M., & Vaillancourt, J. E. 2009, ApJ, 696, 567
- Heiles (2000) Heiles, C. 2000, AJ, 119, 923
- Heyer et al (2008) Heyer, M., Gong, H., Ostriker, E., & Brunt, C. 2008, ApJ, 680, 420
- Heyer et al (1998) Heyer, M. H., Brunt, C., Snell, R. L., et al. 1998, ApJS, 115, 241
- Jones et al (2015) Jones, T. J., Bagley, M., Krejny, M., Andersson, B.-G., & Bastien, P. 2015, AJ, 149, 31
- Jones (1989) Jones, T. J. 1989, ApJ, 346, 728
- Jones et al (1992) Jones, T. J., Klebe, D., & Dickey, J. M. 1992, ApJ, 389, 602
- Jorquera et al (2018) Jorquera, S., & Bertrang, G. H.-M. 2018, arXiv:1804.02070
- Kandori et al (2017) Kandori, R., Tamura, M., Kusakabe, N., et al. 2017, ApJ, 845, 32
- Kleinmann et al (1986) Kleinmann, S. G., Cutri, R. M., Young, E. T., Low, F. J., & Gillett, F. C. 1986, Tucson, Univ. of Arizona (1986)
- Kumar et al (2014a) Kumar, B., Sharma, S., Manfroid, J., et al. 2014, A&A, 567, A109
- Kumar et al. (2014b) Kumar, B., Pandey, S. B., Eswaraiah, C., & Gorosabel, J. 2014, MNRAS, 442, 2
- Kumar et al. (2016) Kumar, B., Pandey, S. B., Eswaraiah, C., & Kawabata, K. S. 2016, MNRAS, 456, 3157
- Kun et al (2008) Kun, M., Kiss, Z. T., & Balog, Z. 2008, Handbook of Star Forming Regions, Volume I, 4, 136
- Ladd et al (1997) Ladd, E. F., & Hodapp, K.-W. 1997, ApJ, 474, 749
- Landolt (1992) Landolt, A. U. 1992, AJ, 104, 340
- Larson et al (1996) Larson, K. A., Whittet, D. C. B., & Hough, J. H. 1996, ApJ, 472, 755
- Launhardt et al (1997) Launhardt, R., & Henning, T. 1997, A&A, 326, 329
- Lee et al (2018) Lee, C. D., Eswaraiah, C., Chen, W. P., & Pandey, A. K. 2018, AJ, 156, 115
- Li et al (2017) Li, H.-B., Jiang, H., Fan, X., Gu, Q., & Zhang, Y. 2017, Nature Astronomy, 1, 0158
- Li et al (2008) Li, H.-b., & Houde, M. 2008, ApJ, 677, 1151
- Lynds (1962) Lynds, B. T. 1962, ApJS, 7, 1
- Maheswar & Bhatt (2006) Maheswar, G., & Bhatt, H. C. 2006, MNRAS, 369, 1822
- Maheswar et al (2010) Maheswar, G., Lee, C. W., Bhatt, H. C., Mallik, S. V., & Dib, S. 2010, A&A, 509, A44
- Maheswar et al (2006) Maheswar, G., & Bhatt, H. C. 2006, MNRAS, 369, 1822
- Medhi et al. (2008) Medhi, B. J., Maheswar, G., Pandey, J. C., Kumar, T. S., & Sagar, R. 2008, MNRAS, 388, 105
- McKee et al (2007) McKee, C. F., & Ostriker, E. C. 2007, ARA&A, 45, 565
- Molinari et al (2010) Molinari, S., Swinyard, B., Bally, J., et al. 2010, A&A, 518, L100
- Moscadelli et al (2009) Moscadelli, L., Reid, M. J., Menten, K. M., et al. 2009, ApJ, 693, 406
- Mouschovias (1976) Mouschovias, T. C. 1976, ApJ, 207, 141
- Mouschovias (1991) Mouschovias, T. C. 1991, ApJ, 373, 169
- Mouschovias et al (1999) Mouschovias, T. C., & Ciolek, G. E. 1999, NATO Advanced Science Institutes (ASI) Series C, 540, 305
- Myers et al (1983) Myers, P. C., & Benson, P. J. 1983, ApJ, 266, 309
- Myers et al (1991) Myers, P. C., & Goodman, A. A. 1991, ApJ, 373, 509
- Nakano et al (1978) Nakano, T., & Nakamura, T. 1978, PASJ, 30, 671
- Neckel et al (1985) Neckel, T., Chini, R., Guesten, R., & Wink, J. E. 1985, A&A, 153, 253
- Neckel et al (1981) Neckel, T., & Chini, R. 1981, A&AS, 45, 451
- Neckel et al (1990) Neckel, T., & Staude, H. J. 1990, A&A, 231, 165
- Neha et al (2018) Neha, S., Maheswar, G., Soam, A., & Lee, C. W. 2018, MNRAS, 476, 4442
- Olofsson et al (2010) Olofsson, S., & Olofsson, G. 2010, A&A, 522, A84
- Ostriker et al (2001) Ostriker, E. C., Stone, J. M., & Gammie, C. F. 2001, ApJ, 546, 980
- Pandey et al (2000) Pandey, A. K., Ogura, K., & Sekiguchi, K. 2000, PASJ, 52, 847
- Pandey et al (2003) Pandey, A. K., Upadhyay, K., Nakada, Y., & Ogura, K. 2003, A&A, 397, 191
- Pandey et al (2013) Pandey, A. K., Eswaraiah, C., Sharma, S., et al. 2013, ApJ, 764, 172
- Pandey et al (2013) Pandey, A. K., Samal, M. R., Chauhan, N., et al. 2013, New A, 19, 1
- Peterson et al (1998) Peterson, D. E., & Clemens, D. P. 1998, AJ, 116, 881
- PlanckCollaborationI (2014) Planck Collaboration, Ade, P. A. R., Aghanim, N., et al. 2014, A&A, 571, A1
- PlanckCollaborationetal (2016) Planck Collaboration, Ade, P. A. R., Aghanim, N., et al. 2016, A&A, 586, A138
- Poidevin et al (2010) Poidevin, F., Bastien, P., & Matthews, B. C. 2010, ApJ, 716, 893
- Pudritz et al (2007) Pudritz, R. E., Ouyed, R., Fendt, C., & Brandenburg, A. 2007, Protostars and Planets V, 277
- Puga et al (2010) Puga, E., Marín-Franch, A., Najarro, F., et al. 2010, A&A, 517, A2
- Ramaprakash et al (1998) Ramaprakash, A. N., Gupta, R., Sen, A. K., & Tandon, S. N. 1998, A&AS, 128, 369
- Rautela et al (2004) Rautela, B. S., Joshi, G. C., & Pandey, J. C. 2004, Bulletin of the Astronomical Society of India, 32, 159
- Reipurth (1983) Reipurth, B. 1983, A&A, 117, 183
- Reipurth (2008) Reipurth, B. 2008, Handbook of Star Forming Regions, Volume II, 5
- Richer et al (2000) Richer, J. S., Shepherd, D. S., Cabrit, S., Bachiller, R., & Churchwell, E. 2000, Protostars and Planets IV, 867
- Rieke et al (1985) Rieke, G. H., & Lebofsky, M. J. 1985, ApJ, 288, 618
- Samal et al (2007) Samal, M. R., Pandey, A. K., Ojha, D. K., et al. 2007, ApJ, 671, 555
- Santos et al (2012) Santos, F. P., Roman-Lopes, A., & Franco, G. A. P. 2012, ApJ, 751, 138
- Santos et al (2016) Santos, F. P., Busquet, G., Franco, G. A. P., Girart, J. M., & Zhang, Q. 2016, ApJ, 832, 186
- Sargent (1977) Sargent, A. I. 1977, ApJ, 218, 736
- Scappini et al (1996) Scappini, F., & Codella, C. 1996, MNRAS, 282, 587
- Schmidt et al (1992) Schmidt, G. D., Elston, R., & Lupie, O. L. 1992, AJ, 104, 1563
- Sen et al (1994) Sen, A. K., & Tandon, S. N. 1994, Proc. SPIE, 2198, 264
- Serkowski et al (1975) Serkowski, K., Mathewson, D. S., & Ford, V. L. 1975, ApJ, 196, 261
- Sharma et al (2017) Sharma, S., Pandey, A. K., Ojha, D. K., et al. 2017, MNRAS, 467, 2943
- Sofue et al (2016) Sofue, Y., & Kataoka, J. 2016, PASJ, 68, L8
- Soler et al (2016) Soler, J. D., Alves, F., Boulanger, F., et al. 2016, A&A, 596, A93
- Sugitani et al (2010) Sugitani, K., Nakamura, F., Tamura, M., et al. 2010, ApJ, 716, 299
- Shu (1977) Shu, F. H. 1977, ApJ, 214, 488
- Shu et al (1987) Shu, F. H., Lizano, S., & Adams, F. C. 1987, Star Forming Regions, 115, 417
- Stecklum et al (2007) Stecklum, B., Melnikov, S. Y., & Meusinger, H. 2007, A&A, 463, 621
- Su et al (2016) Su, Y., Sun, Y., Li, C., et al. 2016, ApJ, 828, 59
- Su et al (2017) Su, Y., Zhou, X., Yang, J., et al. 2017, ApJ, 836, 211
- Torii et al. (2015) Torii, K., Hasegawa, K., Hattori, Y., et al. 2015, ApJ, 806, 7
- Taylor et al (2003) Taylor, A. R., Gibson, S. J., Peracaula, M., et al. 2003, AJ, 125, 3145
- Ungerechts et al (2000) Ungerechts, H., Umbanhowar, P., & Thaddeus, P. 2000, ApJ, 537, 221
- Vallée (2002) Vallée, J. P. 2002, AJ, 123, 382
- Valencic & Smith (2015) Valencic, L. A., & Smith, R. K. 2015, ApJ, 809, 66
- Vrba et al (1986) Vrba, F. J., Luginbuhl, C. B., Strom, S. E., Strom, K. M., & Heyer, M. H. 1986, AJ, 92, 633
- Wang et al (2017) Wang, J.-W., Lai, S.-P., Eswaraiah, C., et al. 2017, ApJ, 849, 157
- Ward-Thompson et al (2000) Ward-Thompson, D., Kirk, J. M., Crutcher, R. M., et al. 2000, ApJ, 537, L135
- Welty et al (1992) Welty, D. E., & Fowler, J. R. 1992, ApJ, 393, 193
- Whitney et al (2005) Whitney, B. A., Robitaille, T. P., Indebetouw, R., et al. 2005, Massive Star Birth: A Crossroads of Astrophysics, 227, 206
- Whittet (2005) Whittet, D. C. B. 2005, Astronomical Polarimetry: Current Status and Future Directions, 343, 321
- Whittet et al (2008) Whittet, D. C. B., Hough, J. H., Lazarian, A., & Hoang, T. 2008, ApJ, 674, 304
- Whittet (2003) Whittet, D. C. B. 2003, Dust in the galactic environment, 2nd ed. by D.C.B. Whittet. Bristol: Institute of Physics (IOP) Publishing, 2003 Series in Astronomy and Astrophysics, ISBN 0750306246.
- Yonekura et al (1997) Yonekura, Y., Dobashi, K., Mizuno, A., Ogawa, H., & Fukui, Y. 1997, ApJS, 110, 21
- Yu et al (1996) Yu, Z.-Y., Nagahama, T., & Fukui, Y. 1996, ApJ, 471, 867
- Zinn et al (2018) Zinn, J. C., Pinsonneault, M. H., Huber, D., & Stello, D. 2018, arXiv:1805.02650
Appendix A Color-color diagrams and estimation of total-to-selective extinction ()
Figure 16 shows the color-color diagrams of the 111 FG stars (with distances 830 pc) and 375 BG stars (distances between 830 pc – 2.65 kpc) depicted using blue and red filled circles, respectively. There exist 27 and 16 M-type stars among the FG and BG stars, respectively, and are shown with overlapping squares. These M-type stars are identified based on a comparison of their vs colors with the intrinsic locus of M-type dwarfs (Peterson et al, 1998) shown with a curve in the top left panel of Figure 16. We have excluded M-type stars from the further analysis because they would effect the true reddening law of the cloud by occupying the location of reddened background stars. The remaining 92 FG stars and 351 BG stars with photometry (hereafter group I) were used to perform the weighted linear fits and the resultant slopes are given in Table 6. Similarly, shown in Figure 17, we also estimate the slopes based on the weighted linear fits to the color-color combinations of 30 FG and 57 BG stars with photometry plus polarimetry (hereafter group II). The fitted slopes along with their uncertainties are given in Table 6. In the group I, M-type stars seem to have more contamination on the reddened BG stars (Figure 16), in contrast this is not pronounced in group II (Figure 17).
To estimate the value of for LDN 1225, we use the following relation of the form (see Neckel et al, 1981)
| (A1) |
where and are the slopes of the two-color combinations, respectively, for the FG or BG stars and unreddened main-sequence stars following the normal extinction law (taken from the stellar models by Bertelli et al 1994, and also see Table 3 of Pandey et al 2003). corresponds to normal extinction law and is considered to be 3.1. Using the equation (A1) and the fitted slopes (cf. columns 3 and 5 of Table 6), we estimate values along with their uncertainties for the FG and BG stars of the two groups and are given in columns 4 and 6 of Table 6. The weighted mean values are 3.10 0.01 (standard deviation = 0.14) and 3.36 0.01 (standard deviation 0.14), respectively, for FG and BG stars of the group I. Similarly, the weighted mean values are 2.87 0.01 (standard deviation 0.12) and 3.41 0.01 (standard deviation = 0.15), respectively, for the FG and BG stars of the group II. Discussion based on the derived values is given in Section 4.9.
Appendix B Estimation of visual extinction ()
Figure 18 shows the NIR color-color ( versus ) diagram of 113 stars having polarization data. NIR photometric data of these stars were extracted from Two Micron All Sky Survey (2MASS) point source catalog (Cutri et al, 2003). All the sources have uncertainties less than 0.1 mag corresponds to signal-to-noise ratio (SNR) 10 and with photometric quality flag of “AAA" in -bands. NIR extinction method estimates value of a star by dereddening its observed colors ( and ) to match with its intrinsic colors ( and ) by using the following relations (cf. Maheswar et al, 2010):
| (B1) | |||
| (B2) |
These relations utilize the extinction law of Rieke et al (1985). In this method, various values having the interval of 0.01 mag were used for dereddening the observed colors, and these sets of dereddened colors were matched to the intrinsic colors as illustrated in the Figure 18 using a blue arrow. The value at which the dereddened colors matched to the intrinsic colors, giving a minimum Chi-square value, yields a best of a star. NIR extinction method (Maheswar et al, 2010) has been employed only to the 57 stars having 0.75 mag as shown with filled circles. The derived maximum value of extinction through this method comes out to be 4 mag. The criterion 0.75 excludes the unreddened/reddened M-type stars, giants, and classical T-Tauri stars. We also exclude stars distributed left side to the MS locus. All the excluded 56 stars are denoted with gray filled circles. The uncertainty in values are estimated by using equation (10) of Maheswar et al (2010).
Estimated values along with uncertainties for 57 stars are listed in Table 7. This table also lists the IDs, coordinates, NIR colors, polarization values. Further analysis uses only 32 stars and satisfying the criteria 2. The derived values range from 0.9 mag to 3.3 mag with mean of 2.00.6 mag888The corresponding mean column density is (2.20.2)1021 cm-2 (using the relations and (2.210.09)1021 mag-1 cm-2; see Güver & Özelz 2009; Valencic & Smith 2015). This value, within the error, is consistent with the column density, (3.41.3)1021 cm-2, derived using the 12CO integrated emission of LDN 1225 (cf., Section 3.7).. Based on the and polarization values, polarization efficiency of the dust grains of LDN 1225 is discussed in Section 4.10.


| Date | ||||
| Our work Schmidt et al (1992) | ||||
| Polarized standard HD 19820 | ||||
| 02 Nov 2013 | 4.60.1 | 114.60.6 | 4.530.03 | 114.50.2 |
| 12 Nov 2010 | 4.60.1 | 114.50.4 | 4.530.03 | 114.50.2 |
| 13 Dec 2010 | 4.60.1 | 114.20.4 | 4.530.03 | 114.50.2 |
| Polarized standard HD 204827 | ||||
| 13 Nov 2010 | 4.90.1 | 59.20.5 | 4.890.03 | 59.10.2 |
| Polarized standard BD+59 389 | ||||
| 14 Dec 2010 | 6.50.1 | 97.70.4 | 6.430.02 | 98.10.1 |
| 01 Nov 2013 | 6.30.1 | 98.00.4 | 6.430.02 | 98.10.1 |
| Unpolarized standard HD 21447 | ||||
| 14 Dec 2010 | 0.050.1 | 15656 | 0.050.02† | 171.5† |
.
| ID | R.A (J2000) | Dec (J2000) | distance | classification | |||||
|---|---|---|---|---|---|---|---|---|---|
| (h:m:s) | () | (%) | () | (mag) | (mag) | (mag) | (pc) | ||
| (1) | (2) | (3) | (4) | (5) | (6) | (7) | (8) | (9) | (10) |
| 1 | 23:10:38.082 | 61:30:40.208 | 2.5 0.9 | 74 10 | 14.22 0.04 | 13.70 0.04 | 13.51 0.04 | 1098 53 | BG |
| 2 | 23:10:38.271 | 61:29:25.339 | 2.5 0.4 | 98 5 | 11.83 0.03 | 11.02 0.03 | 10.84 0.02 | 2380 152 | BG |
| 3 | 23:10:40.539 | 61:28:48.878 | 2.1 0.3 | 78 5 | 12.73 0.03 | 12.40 0.03 | 12.29 0.02 | 669 10 | FG |
| 4 | 23:10:41.364 | 61:30:57.006 | 1.9 0.2 | 51 3 | 12.06 0.03 | 11.67 0.03 | 11.59 0.02 | 460 4 | FG |
| 5 | 23:10:43.502 | 61:31:52.251 | 1.8 0.5 | 73 8 | 13.47 0.03 | 13.09 0.03 | 12.97 0.03 | 843 20 | BG |
| 6 | 23:10:46.677 | 61:31:29.056 | 1.8 0.2 | 93 3 | 10.84 0.03 | 10.01 0.03 | 9.78 0.02 | 2668 159 | BG-NGC7538 |
| 7 | 23:10:47.868 | 61:31:10.794 | 1.1 0.3 | 51 7 | 12.90 0.03 | 12.41 0.03 | 12.35 0.03 | 517 6 | FG |
| 8 | 23:10:48.248 | 61:29:38.274 | 2.2 0.5 | 76 6 | 13.65 0.04 | 13.15 0.05 | 13.06 0.04 | 2078 145 | BG |
| 9 | 23:10:48.262 | 61:27:45.871 | 2.8 0.5 | 94 5 | 13.40 0.03 | 13.07 0.04 | 12.84 0.03 | 1061 32 | BG |
| 10 | 23:10:50.616 | 61:32:33.244 | 3.4 0.4 | 68 3 | 10.77 0.03 | 9.43 0.03 | 9.02 0.02 | – | – |
| 11 | 23:10:53.417 | 61:27:59.151 | 3.4 0.3 | 85 3 | 10.60 0.03 | 9.31 0.03 | 8.96 0.02 | 3206 601 | BG-NGC7538 |
| 12 | 23:10:54.662 | 61:32:45.974 | 2.7 0.7 | 111 7 | 14.23 0.03 | 13.71 0.03 | 13.46 0.04 | 3812 615 | BG-NGC7538 |
| 13 | 23:10:54.854 | 61:28:26.958 | 2.7 0.5 | 79 5 | 13.57 0.02 | 13.24 0.03 | 13.13 0.02 | 1497 67 | BG |
| 14 | 23:10:55.633 | 61:27:21.798 | 5.6 0.4 | 57 2 | 12.10 0.03 | 11.54 0.03 | 11.29 0.02 | 5519 981 | BG-NGC7538 |
| 15 | 23:10:56.201 | 61:31:54.080 | 1.5 0.5 | 89 10 | 14.15 0.03 | 13.91 0.05 | 13.72 0.05 | 2141 179 | BG |
| ID | R.A (J2000) | Dec (J2000) | |||||||
| (h:m:s) | () | (mag) | (mag) | (mag) | (mag) | (mag) | (mag) | (mag) | |
| (1) | (2) | (3) | (4) | (5) | (6) | (7) | (8) | (9) | (10) |
| 1 | 23:10:41.320 | 61:39:19.299 | 18.349 0.011 | 1.382 0.028 | 0.871 0.008 | 1.693 0.044 | 15.47 0.05 | 14.89 0.07 | 14.66 0.09 |
| 2 | 23:10:41.723 | 61:36:52.675 | 16.572 0.004 | 1.291 0.008 | 0.747 0.003 | 1.525 0.010 | 14.22 0.03 | 13.68 0.04 | 13.56 0.05 |
| 3 | 23:10:41.759 | 61:34:45.177 | 16.364 0.010 | 1.121 0.016 | 0.686 0.009 | 1.347 0.009 | 14.15 0.04 | 13.64 0.04 | 13.56 0.09 |
| 4 | 23:10:42.002 | 61:36:39.916 | 17.455 0.006 | 1.097 0.012 | 0.710 0.005 | 1.497 0.022 | 15.14 0.04 | 14.83 0.06 | 14.57 0.08 |
| 5 | 23:10:42.061 | 61:37:36.948 | 18.338 0.010 | 1.284 0.026 | 0.875 0.009 | 1.861 0.037 | 15.48 0.06 | 14.71 0.05 | 14.73 0.09 |
| 6 | 23:10:42.204 | 61:37:43.968 | 17.588 0.005 | 1.053 0.012 | 0.722 0.006 | 1.558 0.022 | 15.15 0.07 | 14.62 0.07 | 14.44 0.08 |
| 7 | 23:10:42.624 | 61:42:52.848 | 16.808 0.004 | 1.108 0.011 | 0.782 0.005 | 1.568 0.003 | 14.30 0.03 | 13.80 0.04 | 13.64 0.04 |
| 8 | 23:10:42.651 | 61:36:19.713 | 16.675 0.004 | 1.013 0.007 | 0.669 0.004 | 1.401 0.011 | 14.53 0.03 | 14.01 0.04 | 13.93 0.04 |
| 9 | 23:10:42.981 | 61:43:32.314 | 16.859 0.004 | 1.098 0.011 | 0.764 0.004 | 1.524 0.003 | 14.48 0.04 | 13.92 0.05 | 13.77 0.04 |
| 10 | 23:10:43.080 | 61:47:15.529 | 18.162 0.006 | 1.639 0.040 | 1.141 0.005 | 2.116 0.006 | 14.76 0.04 | 14.03 0.05 | 13.78 0.05 |
| 11 | 23:10:43.417 | 61:30:41.061 | 18.966 0.018 | 1.867 0.073 | 1.137 0.012 | 2.391 0.046 | 15.52 0.06 | 14.56 0.05 | 14.52 0.08 |
| 12(5) | 23:10:43.502 | 61:31:52.251 | 15.229 0.006 | 0.981 0.003 | 0.534 0.002 | 1.090 0.006 | 13.47 0.03 | 13.09 0.03 | 12.97 0.03 |
.
| Field/HD number | RA (J2000) | Dec (J2000) | weighted mean | weighted mean | pass-band | No. of stars | instrument (or) source |
|---|---|---|---|---|---|---|---|
| (h:m:s) | () | () | () | ||||
| (1) | (2) | (3) | (4) | (5) | (6) | (7) | (8) |
| FG stars with d 830 pc | |||||||
| 1 | 22:56:53.332 | 62:09:58.572 | 0.54 0.14 | 63 7 | R | 4 | AIMPOL |
| 2 | 22:56:33.530 | 62:04:54.912 | 2.20 0.10 | 73 1 | R | 5 | ,, |
| 3 | 22:56:07.713 | 61:58:02.352 | 1.19 0.08 | 109 2 | R | 5 | ,, |
| 4 | 22:57:41.210 | 62:41:51.792 | 1.29 0.13 | 69 3 | R | 2 | IMPOL |
| 5 | 22:58:16.408 | 62:43:25.176 | – | – | R | 0 | ,, |
| 6 | 22:57:02.560 | 62:39:01.188 | 0.61 0.03 | 68 1 | R | 4 | ,, |
| 7 | 22:56:50.930 | 62:34:53.292 | 1.31 0.06 | 76 1 | R | 3 | ,, |
| 8 | 22:56:51.355 | 62:31:18.084 | 1.41 0.03 | 83 1 | R | 4 | ,, |
| 9 | 22:58:19.392 | 62:38:45.744 | 0.11 0.06 | 75 14 | R | 1 | ,, |
| 10 | 22:57:34.209 | 62:35:53.484 | 1.00 0.07 | 163 2 | R | 3 | ,, |
| Line | R.A (J2000) | Dec (J2000) | ||||
|---|---|---|---|---|---|---|
| (h:m:s) | (::) | (arcmin) | (arcmin) | (°) | () | |
| (1) | (2) | (3) | (4) | (5) | (6) | (7) |
| 12CO | 23:12:16.62 | 61:38:24.27 | 8.60.2 | 4.40.1 | 1021 | 4 11 |
| 13CO | 23:12:01.11 | 61:39:13.50 | 4.40.1 | 3.10.1 | 523 | 54 11 |
| C18O | 23:11:55.60 | 61:39:15.00 | 1.80.1 | 1.30.1 | 548 | 5214 |
| color-color combination | ||||
| (1) | (2) | (3) | (4) | (5) |
| Group I: Stars with photometric data | ||||
| 92 FG stars 351 BG stars | ||||
| -1.12 0.01 | 3.15 0.01 | -1.24 0.01 | 3.49 0.01 | |
| -1.86 0.01 | 2.94 0.02 | -2.06 0.01 | 3.26 0.01 | |
| -2.28 0.01 | 2.92 0.02 | -2.52 0.01 | 3.22 0.01 | |
| -2.38 0.01 | 2.84 0.01 | -2.68 0.01 | 3.19 0.01 | |
| Group II: Stars with photometric plus polarimetric data | ||||
| 30 FG stars 57 BG stars | ||||
| -1.04 0.01 | 2.93 0.01 | -1.26 0.01 | 3.54 0.01 | |
| -1.69 0.02 | 2.67 0.03 | -2.07 0.01 | 3.27 0.02 | |
| -2.18 0.02 | 2.79 0.03 | -2.54 0.01 | 3.26 0.02 | |
| -2.27 0.02 | 2.71 0.02 | -2.69 0.01 | 3.20 0.01 | |
| ID | RA (J2000) | Dec (J2000) | ||||
| () | () | (mag) | (mag) | (%) | (mag) | |
| (1) | (2) | (3) | (4) | (5) | (6) | (7) |
| 05 | 23:10:43.502 | 61:31:52.251 | 0.40 0.04 | 0.08 0.04 | 1.8 0.5 | 0.4 0.5 |
| 12 | 23:10:54.662 | 61:32:45.974 | 0.52 0.04 | 0.22 0.05 | 2.7 0.7 | 2.8 0.6 |
| 15 | 23:10:56.201 | 61:31:54.080 | 0.26 0.05 | 0.16 0.07 | 1.5 0.5 | 2.5 0.8 |
| 19 | 23:11:00.097 | 61:33:54.450 | 0.43 0.05 | 0.12 0.05 | 2.5 0.7 | 1.0 0.6 |
| 20 | 23:11:03.445 | 61:41:30.120 | 0.39 0.04 | 0.08 0.04 | 2.3 0.2 | 0.4 0.5 |
| 42 | 23:11:18.675 | 61:46:42.571 | 0.42 0.04 | 0.17 0.04 | 1.9 0.3 | 2.2 0.4 |
| 44 | 23:11:20.161 | 61:31:08.886 | 0.41 0.04 | 0.11 0.05 | 1.8 0.4 | 0.8 0.6 |
| 46 | 23:11:23.872 | 61:34:43.075 | 0.57 0.04 | 0.16 0.04 | 2.1 0.2 | 1.3 0.5 |
| 47 | 23:11:24.807 | 61:31:16.078 | 0.47 0.04 | 0.11 0.05 | 3.5 0.8 | 0.8 0.6 |
| 51 | 23:11:27.976 | 61:43:49.180 | 0.37 0.03 | 0.08 0.04 | 1.5 0.2 | 0.3 0.5 |
| 54 | 23:11:31.673 | 61:34:05.188 | 0.19 0.04 | 0.08 0.04 | 3.2 0.2 | 0.7 0.5 |
| 55 | 23:11:32.560 | 61:33:12.301 | 0.34 0.04 | 0.14 0.05 | 3.9 0.6 | 1.7 0.5 |
| 57 | 23:11:33.231 | 61:32:13.758 | 0.31 0.03 | 0.07 0.04 | 1.3 0.2 | 0.4 0.4 |
| 58 | 23:11:33.251 | 61:43:31.011 | 0.29 0.04 | 0.10 0.04 | 1.5 0.2 | 0.9 0.4 |
| 59 | 23:11:34.034 | 61:45:52.336 | 0.36 0.04 | 0.21 0.05 | 2.6 0.6 | 3.2 0.6 |