Present address: ]Graduate School of Information Science, Tohoku University, Sendai 980-8579, Japan
Slow dynamics coupled with cluster formation in ultrasoft-potential glasses
Abstract
We numerically investigate slow dynamics of a binary mixture of ultrasoft particles interacting with the generalized Hertzian potential. If the softness parameter, , is small, the particles at high densities start penetrating each other, form clusters, and eventually undergo the glass transition. We find multiple cluster-glass phases characterized by different number of particles per cluster, whose boundary lines are sharply separated by the cluster size. Anomalous logarithmic slow relaxation of the density correlation functions is observed in the vicinity of these glass-glass phase boundaries, which hints the existence of the higher-order dynamical singularities predicted by the mode-coupling theory. Deeply in the cluster glass phases, it is found that the dynamics of a single particle is decoupled from that of the collective fluctuations.
pacs:
64.70.kj,63.50.Lm,64.70.Q-I Introduction
The ultrasoft potentials are pairwise isotropic and repulsive interactions whose value remains finite even if the two particles fully overlap each other Likos (2006); Malescio (2007). The Gaussian, harmonic, and Hertzian potentials are typical examples. The ultrasoft potential systems are known to exhibit very rich and complex thermodynamic and dynamic behaviors at high densities, which are never observed in systems with sharp short-ranged repulsions such as the hard-sphere and Lennard-Jones potentials. As originally proposed by Likos et al. based on a mean-field analysis, the ultrasoft potential systems are categorized crudely into two types, i.e., the and classes, depending on the shape of the interparticle potential , or more precisely, the shape of its Fourier transformation Likos et al. (2001). The class is a system with a positive-definite , where for all wavevectors . The Gaussian-core model (GCM) and Hertzian potential system belong to this class Stillinger (1976). The most salient feature of the systems in this class is the reentrant melting. The system which crystallized at moderate densities at a fixed temperature melts again as the density is increased. If one plots the binodal, or melting, temperature, , of the fluid-sold phase boundary as a function of the density (), or the pressure (), it first steeply increases with the density like a standard molecular systems but it reaches a reentrant peak and becomes a decreasing function. At high densities beyond this peak, many systems exhibit multiple solid phases, each of which is characterized by distinct crystalline structures Stillinger (1976); Prestipino, Saija, and Giaquinta (2005); Pàmies, Cacciuto, and Frenkel (2009); Zhu and Lu (2011); Miller and Cacciuto (2011). On the other hand, the class systems are characterized by which can take negative values at finite ’s. A representative example is the generalized exponential model (GEM) defined by with , where and are the energy and length scales, respectively. In the class systems, the reentrant transition is either suppressed or absent and instead the particles can overlap each other and form clusters consisting of multiple particles bonding together at high densities Klein et al. (1994); Likos et al. (2001); Mladek et al. (2006); Likos et al. (2007); Mladek et al. (2007); Lascaris et al. (2010); Sciortino and Zaccarelli (2013). The melting line becomes a monotonic function of the density in the high density limit. The density determines the number of particles in a cluster at low temperatures, where very rich multiple crystalline phases characterized by different cluster sizes are observed Zhang, Charbonneau, and Mladek (2010); Zhang and Charbonneau (2012). Peculiar dynamics such as fast intercluster ballistic hopping of particles has also been reported Moreno and Likos (2007); Coslovich, Strauss, and Kahl (2011); Montes-Saralegui, Nikoubashman, and Kahl (2013). The ultrasoft potential systems are not just idealized theoretical models but they can be seen in many realistic macromolecular systems, such as star polymers and dendrimers Likos (2006) and even in some quantum systems such as the vortices of Type 1.5 superconductors Cinti et al. (2010, 2014); Díaz-Méndez et al. (2015, 2017). Indeed some model macromolecules have been demonstrated to form clusters at high densities by simulations Lenz et al. (2012); Bernabei et al. (2013); Slimani et al. (2014).
The ultrasoft potential systems have also been studied in the context of the glass and jamming transitions. Binary and polydisperse systems of the harmonic and Hertzian potential systems have been pet models to study both jamming and glass transitions Berthier and Witten (2009a, b); O’Hern et al. (2003); *A.Donev2004; *C.OHern2004; van Hecke (2010). The glass transitions of these systems in the vicinity of the jamming transition point have been extensively investigated Berthier and Witten (2009b, a); Berthier, Moreno, and Szamel (2010) and the glass transition line of this systems were found to show the reentrant behaviors at high densities Berthier, Moreno, and Szamel (2010). Some anomalies of the jamming/glass transitions associated with the large particle overlap at high densities are also reported Wang, Duan, and Xu (2012); Zhao, Tian, and Xu (2011). The GCM is another class glass former. In contrast to typical glass formers, it was demonstrated that the monatomic GCM undergoes the glass transition at extremely high densities and its dynamical asymptotic behaviors agree unprecedentedly well with the mode-coupling theory (MCT) Ikeda and Miyazaki (2011a, b, 2012); Coslovich, Ikeda, and Miyazaki (2016).
Compared to the class, the glass transition of class systems is largely unexplored Klein et al. (1994); Coslovich, Bernabei, and Moreno (2012); Schmiedeberg (2013); Miyazaki, Kawasaki, and Miyazaki (2016). Numerical study of the glass transition has been first reported for GEM with , a typical system, where the particles are clumped to form clusters and these clusters exhibit the glassy slow dynamics at low temperatures Coslovich, Bernabei, and Moreno (2012). Recently, the cluster glass transition of another type of systems, i.e., the generalized Hertzian potential (GHP) has been reported Schmiedeberg (2013); Miyazaki, Kawasaki, and Miyazaki (2016). GHP is defined by a pairwise isotropic interaction defined by
| (1) |
where is the radius of the particle. The harmonic and Hertzian potential correspond to and 2.5, respectively. By directly Fourier transforming Eq. (1), one finds that GHP belongs to the class for and to the class otherwise. Indeed, is analytically written as
| (2) |
In Figure 1, we plot Eq. (2) for several ’s. When is large, is a monotonically decreasing function and always positive but if is decreased below 2, the zeros of start appearing at very large wavevectors. The first zero tends to shift to smaller ’s as decreases.
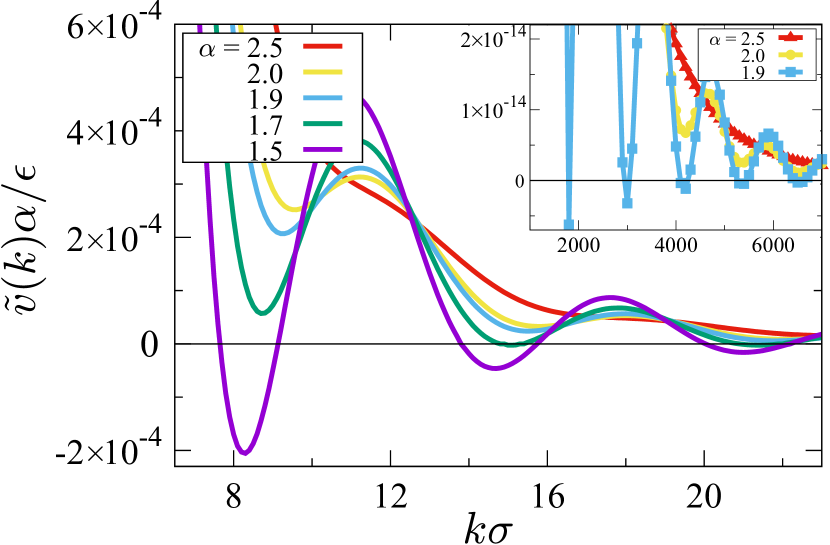
Therefore, it is expected that the GHP particles with form clusters at high densities. In the previous letter Miyazaki, Kawasaki, and Miyazaki (2016), we have briefly reported that the three dimensional binary GHP systems with undergo the glass transition and cluster formation concomitantly at low temperatures and high densities. It was demonstrated that the number of particles per cluster increases one by one semi-discontinuously as the density increases. The phase boundary of the multiple glass phases characterized by different cluster sizes was determined and, surprisingly, the system showed a singular relaxation dynamics in the vicinity of the phase boundary.
In this paper, we present thorough and detailed analysis of structural, dynamic, and thermodynamic properties of the GHP cluster glasses for a wide range of densities and for several ’s. Motivations to study slow dynamics of such an exotic model system are twofold. First, the absence of hard-sphere-like excluding volume effect and the presence of extraordinary rich thermodynamic ground states of the ultrasoft potential systems challenge our conventional and naive picture of the glass transition that the elementary ingredient of dynamical slow down is the arrest of the particles inside the rigid cages formed by their neighbors. How is this picture modified if the particles can penetrate each other? Secondly, presence of the multiple glass phases observed at high densities suggests that the GHP model is an ideal test bench to study the polyamorphism of complex fluids and, possibly, help understanding the putative liquid-liquid transition underlying at lower temperatures. The paper is organized as follows. We first introduce the numerical model and explain the method in Section II. The glass phase diagram, the iso-relaxation-time lines as a function of and , for the models with different ’s and the static properties are discussed in Section III. We investigate dynamical properties in detail in Section IV and we conclude in Section V.
II Model and methods
We investigate a three-dimensional 50:50 binary mixture of large () and small () spherical particles interacting with the GHP potential defined by Eq. (1). For the binary mixture, we replace the radius with , where is the particle diameter of the ( , ) component. The size ratio of the particles, , is set to 1.4 and the mass of the particles is set to for both components. As argued in the previous section, this model belongs to the class when . There is an argument that if the second derivative of the potential at origin is not negative, the system belongs to the class but this is not the case for GHP since is always positive even for Likos et al. (2007).
We run the molecular dynamics simulation for the systems with , , , and . We set , , with the Boltzmann constant , and , as the units of the length, mass, temperature, and time, respectively. The simulations are performed in the ensemble with the velocity Verlet algorithm over a wide range of temperatures and densities with the number of the particles and the volume of the simulation box Frenkel and Smit (2001). We mainly study the system of . We also run simulations for different at several temperatures and densities and confirmed that no appreciable finite size effect for our results was observed. The time step in our simulations is 0.002 for the systems with and and 0.02 for and . The time step for is set to be much smaller than that for to avoid energy drift in our simulation time windows. The system was equilibrated at a high temperature () at first. We subsequently cooled the system to lower temperatures by normalizing velocities of particles every 5000 steps over or time units for the lowest temperatures we investigate. In order to equilibrate the system after the annealing, every run was performed over 20 at least. Here is the structural relaxation time defined as the time at which the intermediate scattering function is equal to 0.1. We assured that no aging was observed after the equilibration run.
III Glass phase diagram and static properties
III.1 One component systems
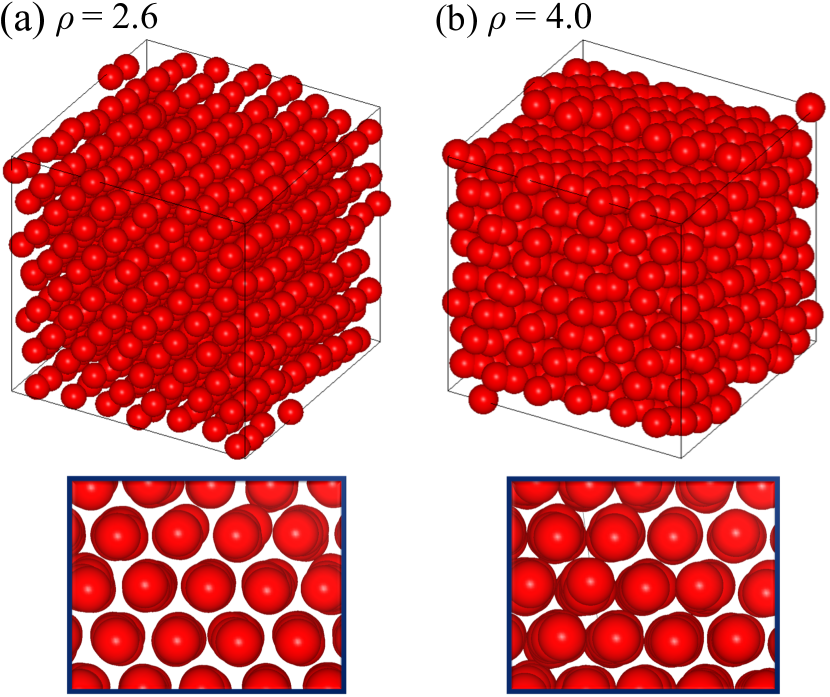
Before investigating the glass transition of the binary GHP, we briefly summarize our simulation results for the one component GHP with which is well below the criteria of . We run the simulation long enough to assure that the potential energy becomes constant and the system is well equilibrated. The snapshots of the observed crystalline structures are shown in Figure 2. Contrary to our anticipation, none of the solid phase observed in the simulation boxes is the cluster crystals even at densities as high as and . Instead, for both densities, we observe the quasi-hexagonal crystal phase where the particles form the two dimensional hexagonal layers laminated in the vertical direction of the layers. This structure is unchanged at higher densities () but the hexagonal layers are undulated along the direction parallel to the layers. The absence of the cluster phases is consistent with the previous study for the two dimensional system Miller and Cacciuto (2011), in which series of exotic crystalline phases were obtained over a wide range of densities but no cluster phase was observed. The hexagonal phases which we observed are akin to the lane phase observed in the two dimensional counterpart Miller and Cacciuto (2011). More elaborate free energy assessment using the thermodynamic integration is necessary in order to determine the accurate and full thermodynamic phase diagram of the crystalline structures but it is beyond the scope of this present study.
III.2 Glass Phase Diagram
Let us go back to the binary system and study the glass transition of GHP. We first draw the glass phase diagram in the – plane for various ’s. We define the fluid-glass phase boundary as the point at which the structural (or so-called alpha) relaxation time exceeds a prefixed value. is extracted from the intermediate scattering function for the large () component, , defined by
| (3) |
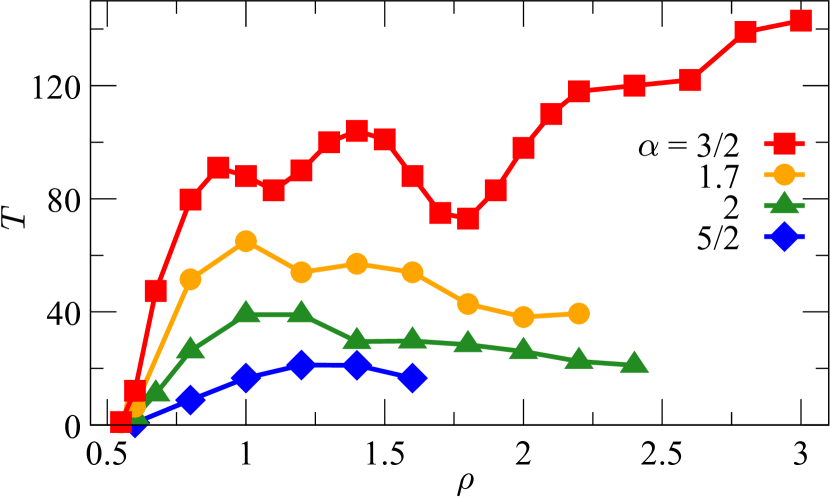
where is the density fluctuations of the large component in the Fourier space, in the summation denotes the set of particles of the large component, is the position of the -th particle. We define by . Here, the wavenumber is chosen to be close to the position of the nearest neighbor peak of the static structure factor for the large component (see Eq. (5) below). As we shall discuss below, for the correlation functions for the small component or for their self-part are different at high densities and small ’s. However, it does not qualitatively affect the overall shape of the phase diagram shown here. We defined the empirical glass transition temperature as the point at which reaches . We run the simulation for a range of densities, . The glass transition lines thus obtained are shown in Figure 3 for , , , and . They are the iso--lines whose shape can shift up and down depending on the definition of but the overall shapes are unchanged. For , has the maximum peak around before it gradually decreases at higher densities. Above , the system is found to nucleate to form the fcc crystal and no glassy behavior is observed. This reentrance behavior is consistent with the Likos criteria for the class systems. Similar behavior is reported for the polydisperse system with the same potential Berthier, Moreno, and Szamel (2010). Asides that the polydisperse system did not crystallizes at high densities, agree with that for the binary system almost quantitatively, hinting that the result is insensitive to the size dispersity of particles. The result for is also qualitatively similar; increases, reaches the maximal peak, and then gradually decreases. A cusp is observed slightly above the reentrant peak, around , which may be a precursor of a new glass phase but we did not observe any qualitative structural changes there (not shown). We again could not access higher densities above as demixing and nucleation intervene the glassy slow dynamics. Interestingly, the position of the peak is close to the phase boundary of the fcc and bcc crystals of the one-component counterpart Zhu and Lu (2011). Overall shape of for and , including the positions of the reentrant peaks, are similar to the fluid-crystal binodal lines for the one-component systems, although the latter lie at higher temperatures Pàmies, Cacciuto, and Frenkel (2009); Zhu and Lu (2011). As is lowered below 2, the overall trends of start changing qualitatively. For , is enhanced and two minima of are clearly observed around and . For , the deeper minima appear at and and, furthermore, increases at higher densities, instead of decreasing as observed for systems with , which is consistent with the mean-field prediction for the class fluids Likos et al. (2001) and the results for other cluster-forming systems Zhang, Charbonneau, and Mladek (2010); Zhang and Charbonneau (2012); Coslovich and Ikeda (2013). The presence of the distinct minima observed for is a clear sign that there exist multiple glass phases Miyazaki, Kawasaki, and Miyazaki (2016). In the following, we mainly focus on the system with and discuss thoroughly about static, thermodynamic, and dynamic properties of the system in the vicinity of .
III.3 Static structures

We investigate static properties of systems with and compare with those of in the vicinity of shown in Fig. 3 for several densities. We evaluate the partial radial distribution functions (, , ) defined by
| (4) |
and their Fourier transformations, the partial static structure factors (, , ) defined by
| (5) |
We show , , and several snapshots of the systems for in Fig. 4 and for in Fig. 5, respectively. First look at Fig. 4 for . In Fig. 4 (a), one observes that, when the density is small, is qualitatively similar to those of simple liquids and characterized by a sharp nearest-neighbor peak at followed by oscillatory tail. As the density increases (see and 1.4), the nearest-neighbor peak shifts to smaller and the peak width broadens, which is a reflection that the particles are squashed and start overlapping. At , the nearest-neighbor peak of splits into two. The separation between the two peaks gradually increases as the density increases and the peak at smaller moves to and stops at , whereas the peak at larger moves back to at the highest density, . Similar behaviors were reported for the same systems with the pressure control simulation at a finite temperature Wang, Duan, and Xu (2012) and at Zhao, Tian, and Xu (2011). Note that the position of the small- peak does not move after it reaches around at high densities. We checked that the peak position does not change appreciably as the temperature is lowered at a fixed density. The split of the peaks of is a consequences of the particles’ overlap but the fact that the two peaks are located at and suggests that the particles are overlapped with their neighbors but do not form clusters. If they were clusters, the inter-particle distance corresponding to the large peak position should be separated more than twice of the intra-particle distance corresponding to the small peak position. This observation is reflected in in Fig. 4 (d). It exhibits the growth of the second peak, which corresponds to the additional peak at smaller in at higher densities. We also note that the small and large particles of the system at the highest density of partly demix as seen in Fig. 4 (i). This is reflected in mild growth of at small ’s. In this density, we do not observe the glassy slow dynamics anyway. Likewise, in Fig. 4 (b) shows that the position of the peak shift to lower and its width widens as the density increases. However, the trend is weaker than that observed in . We observe the onset of the split of the first peak only at the highest density of . It is interesting that the similar trend is observed for [see Figure 4 (c)]. and in Fig. 4 (e) and (f) reflect the properties of and . Note that the increase of at is more dramatic than , suggesting that demixing is predominantly driven by small particles. The existence of the demixing or the phase separation of binary ultrasoft-potential systems at high densities was predicted by a mean-field analysis and using the hypernetted-chain closure Louis, Bolhuis, and Hansen (2000); Archer and Evans (2001); Archer, Likos, and Evans (2002)
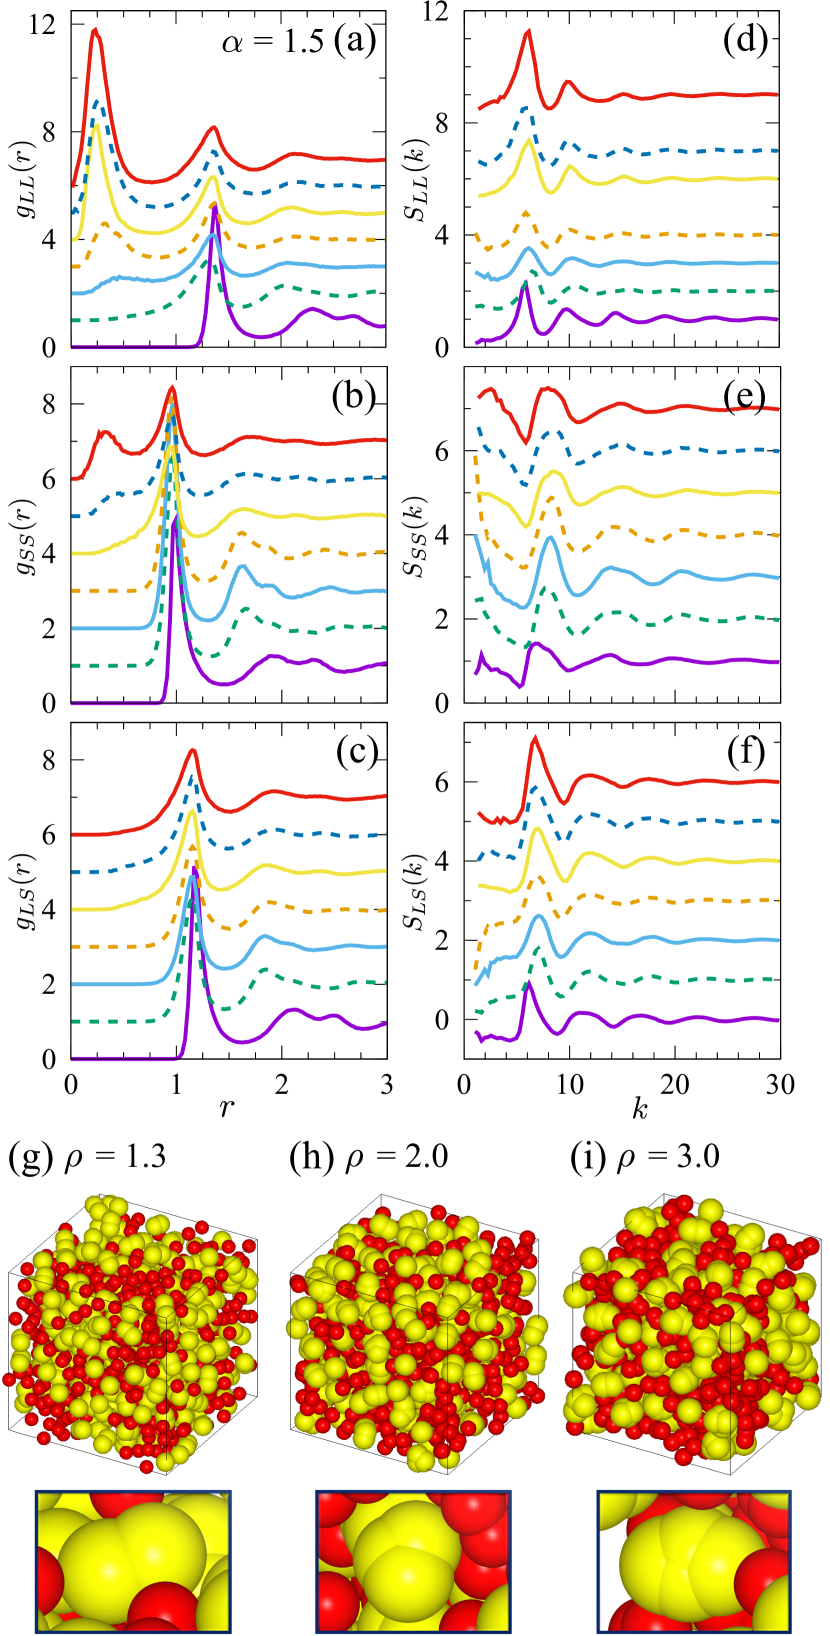
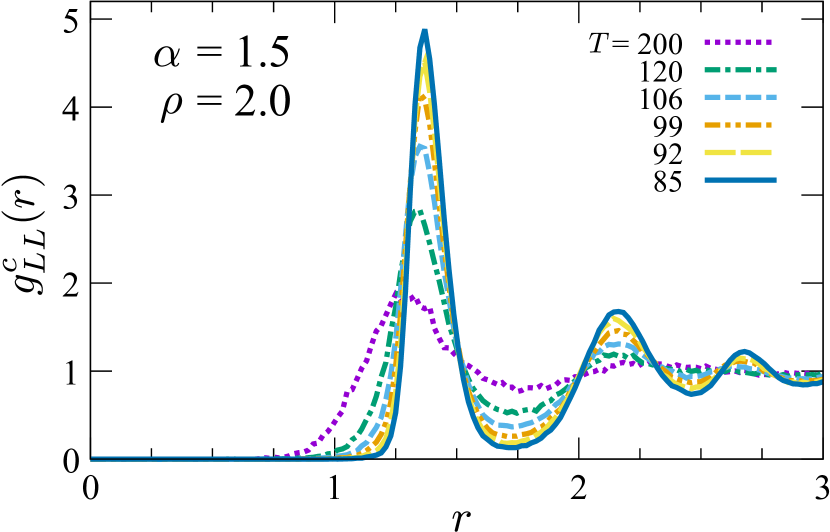
Figure 5 is the results for at . At the lowest density of , all and are similar to those for . As the density increases, anomalies first appear in . The nearest-neighbor peak broaden and its tail stretches to smaller . Its position barely changes whereas the height substantially lowers. At , where has the first minimum [see Figure 3], another peak appears at . Increasing the density further, the small- peak grows but its position slightly moves to smaller and eventually stops at . Furthermore, the minimum between the small- and the nearest-neighbor peaks deepens. This is a clear sign of the cluster formation Likos et al. (2001); Mladek et al. (2007); Lascaris et al. (2010); Zhang and Charbonneau (2012); Coslovich, Bernabei, and Moreno (2012); Miyazaki, Kawasaki, and Miyazaki (2016). The presence of the small- peak, or the cluster peak, at and a deep minimum () between the two peaks mean that a pair of particles is well separated from other pairs. This is in stark contrast from the case for [Fig. 4 (a)] for which the position of the cluster peak is located at larger () and the depth of the minimum between the two peaks remains finite, implying that the inter-particles distances of a fraction of particles are shortened because they are pressured but particles are not coagulated yet. Figure 5 (g) is the snapshot of the system at . One can clearly observe dimer-shaped clusters of the large particles at . The position of the cluster peak corresponds to the bond length of a dimer. As the density increases further, the large particles form the trimers [Fig. 5 (h)] and tetramer [Fig. 5 (i)]. These observations are also reflected in the shape of the static structure factor. ’s for in Fig. 4 (d) demonstrates that the second peak at higher ’s continuously grows as a direct consequence that more particles prefer to interacts with shorter distance, whereas the shape of ’s for [Fig. 5 (d)] is qualitatively unchanged, which suggests that clusters formed by particles with the short bond length are separated by from their neighbors.
Similar cluster formation is also observed for small particles but at higher densities as seen in Fig. 5 (b) and (e). The cluster peak of shows up at which is close to the second minimum of (Fig. 3). This peak also grows as the density increases and is located at less than like for the large particles. However, its height is lower and the minimum between the cluster peak and the nearest-neighbor peak is higher than those for the large particles. These features suggest that the the clusters of the small particles are more unstable and the size of the clusters fluctuates. Contrary to and , no cluster peak is observed in for all densities we studied as shown in Fig. 5 (c). This means that the cluster formation always takes place between the particles of the same size. The large particles do not pair with the small ones. This was observed also in a binary mixture of GEM Coslovich, Bernabei, and Moreno (2012). Distinct from the cluster phases of GEM is the shape of the clusters. For GEM, particles in one cluster are completely overlapped with each other and the averaged bond length is with broad fluctuations. This is natural because the shape of the GEM potential is flat at , so that the particles can sit on top of each other with no energetic penalty. On the other hand, the potential of GHP with remains repulsive up to and the particles bond together at a finite distance determined by the characteristic length encoded in .
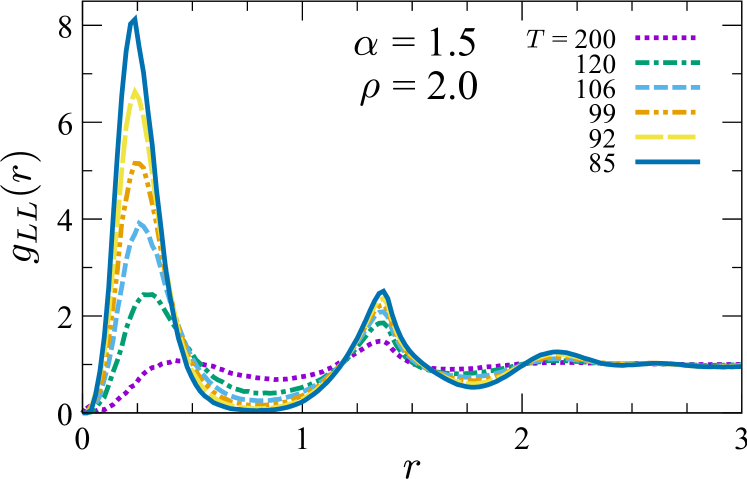
Finally, in Figure 6, the temperature dependence of for for a fixed density () is shown. At high temperatures , show no sharp peak and almost flat even at , meaning that the particles can easily penetrate each other. We can see a precursor of the cluster peak at . As the temperature is lowered, both the cluster and nearest neighbor peaks grow and sharpen but the growth of the cluster peak is more pronounced than the nearest neighbor peak. The minimum between the peaks concomitantly decreases. This result shows that the cluster formation is crossover and no sharp phase transition from the fluid phase to a “cluster-fluid” phase exists, which is also the case for the binary mixture of GEM Coslovich, Bernabei, and Moreno (2012).
III.4 Cluster sizes
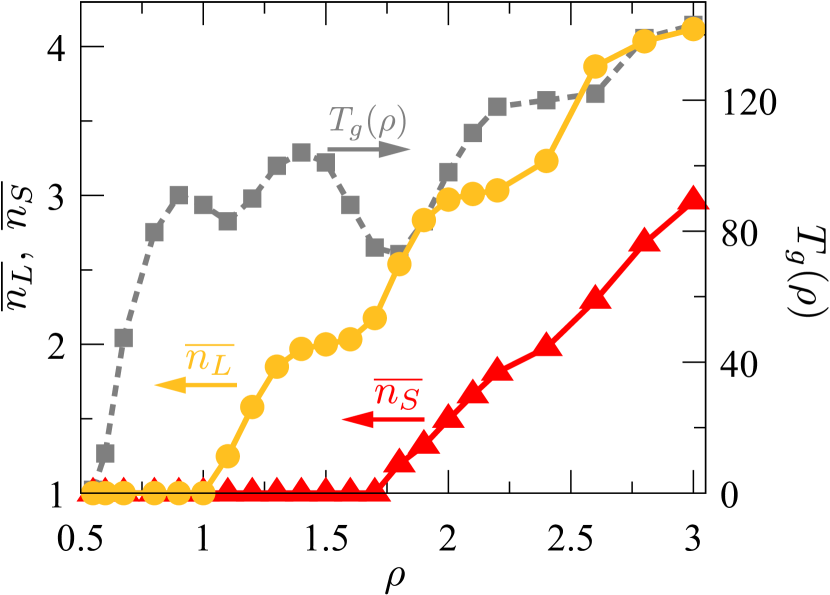
We investigate the properties of clusters formed in the system with in detail. As discussed in the previous subsection, the cluster formation is evident from the shape of and . In order to evaluate the number of particles contained in one cluster, one has to integrate over a cut-off distance . We define to be a center of the minimum of between the cluster and nearest neighbor peaks. Since all clustering systems develop clear minima and their positions are almost independent of temperatures and densities, we fix , , and to be 0.7, 0.6, and 0.65, respectively and use these values for all densities and temperatures. Hereafter, we consider the number of particles per cluster for the large () and small () particles near . The average numbers of and are shown together with in Fig. 7. At low densities, both and are unity and no cluster is formed. As the density increases, increases by one. This stepwise increase takes place at where shows the first minimum and the cluster peak of starts growing (Fig. 5 (a)). As the density increases further, increases one by one and the system enters from the dimer () to trimer (), and to the tetramer () phases. The density where a stepwise increase is observed synchronizes with the minimum of . On the other hand, clustering of the small particles starts at higher densities. The dimer phase () appears exactly at the density where the large particles enter the trimer phase and the increase to takes place at where the large particles becomes tetramers, although the increase of is less sharp. The multiple cluster phases with relatively sharp phase boundary shown in Fig. 7, however, are already seen at relatively high temperatures. In other words, the cluster formation is not triggered by the glass transition nor vice versa.
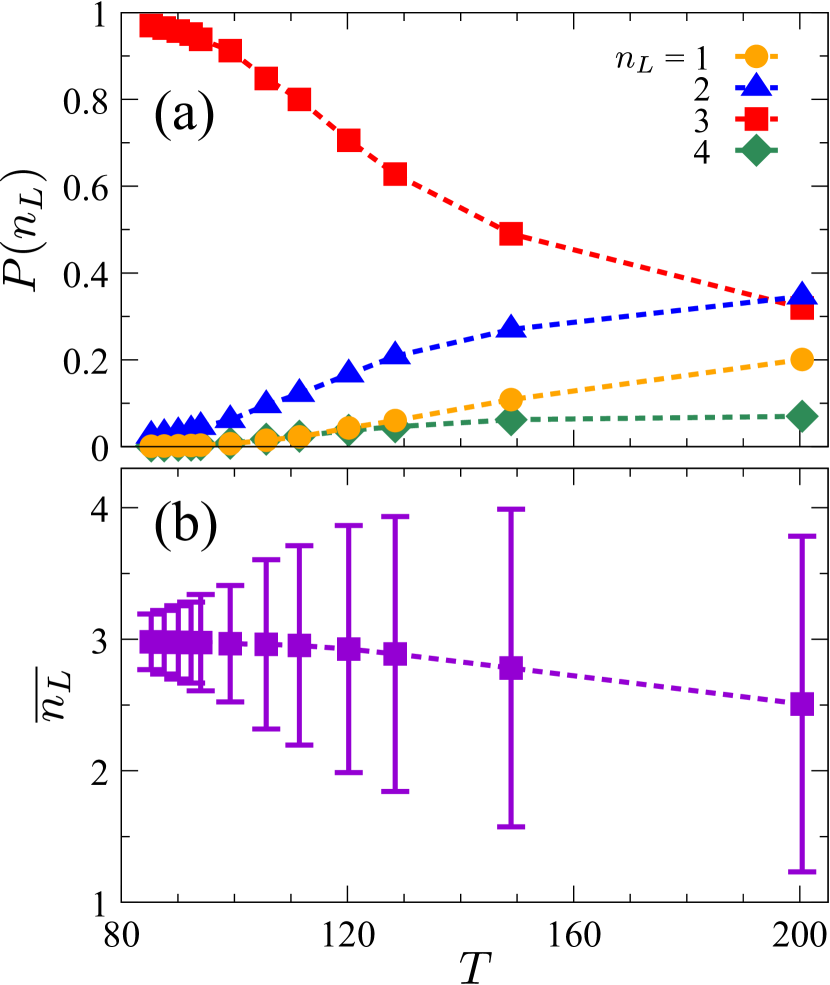
In Figure 8 (a), we show the temperature dependence of the fraction of the large particles forming a cluster of the size at where the large particles are in the trimer phase. At very high temperatures, the system consists of the mixture of clusters of various sizes from to but as the temperature is lowered, the system is gradually dominated by the trimer and eventually the system is almost completely occupied by trimers at . Temperature dependence of the average of the number of the cluster also confirm that there is no sharp transition from the monomer phase to the trimer phase (Fig. 8 (b)). The gradual but monotonic reduction of the error bars shown in this figure at lower temperatures is a clear sign that the emergence of phase is a crossover. Clusters of small particles show similar trend except that the variances are larger than the large particles (not shown).
The stepwise increase of the cluster size with density, whose edges tend to sharpen as the temperature is lowered, hints that the crossover between the different cluster phases becomes thermodynamic transition as the temperature is lowered, i.e., there might exist the liquid-liquid phase transition hidden at a low temperature which is not accessible due to inhibitedly slow glassy dynamics Katayama et al. (2000); Poole et al. (1997); Holten et al. (2012). This transition may be a liquid version of the first-order transition between the multiple crystalline phases which has been reported for the monatomic GEM at high densities and low temperatures Zhang, Charbonneau, and Mladek (2010); Zhang and Charbonneau (2012). As it is often the case of the studies of the polyamorphism and associated liquid-liquid phase transition, the precursor of the transition can be seen as the Widom line of the isothermal compressibility at higher temperatures. We estimate the isothermal compressibility defined by
| (6) |
by evaluating the pressure for various densities at fixed temperatures around the first minima of , where the monomer-dimer phase boundary is observed for the large particles. The density dependence of isothermal compressibility is shown in Figure 9.
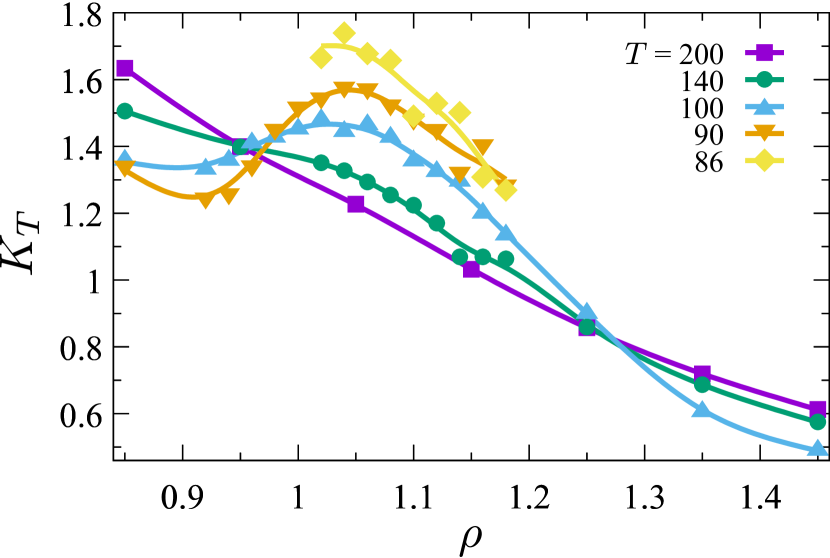
At high temperatures, is a monotonically decreasing function of the density. As the temperature is lowered, develops a peak at . Although the temperatures which we explored are still too high to be conclusive, this trend is similar to what has been observed for prospective liquid-liquid phase transitions for other systems Vasisht, Saw, and Sastry (2011); Luo et al. (2014).
Finally, we assess the static properties of configurations of the clusters. We compute the partial radial distribution function of clusters’ center of mass. Figure 10 is for in the trimer phase at at several temperatures near . It is single-peaked near which corresponds to the nearest neighbor distance between the trimers and the peak monotonically increases as the temperature is lowered. Similar trends are observed at other densities and for . This means that slow dynamics of the cluster fluids near its glass transition is caused by cage formation of clusters much the same way as the cage formation of atoms or molecules causes the glass transition of simple liquids.
IV Dynamics
In this section, we discus slow dynamics near of clustered fluids by analyzing the intermediate scattering functions. We specifically focus on the collective and self part of the scattering functions for the same species. The collective part is written explicitly as
| (7) |
and the self part is
| (8) |
IV.1 Density dependence
We first display , , , and for a wide range of densities for for which the rich cluster phases are observed.
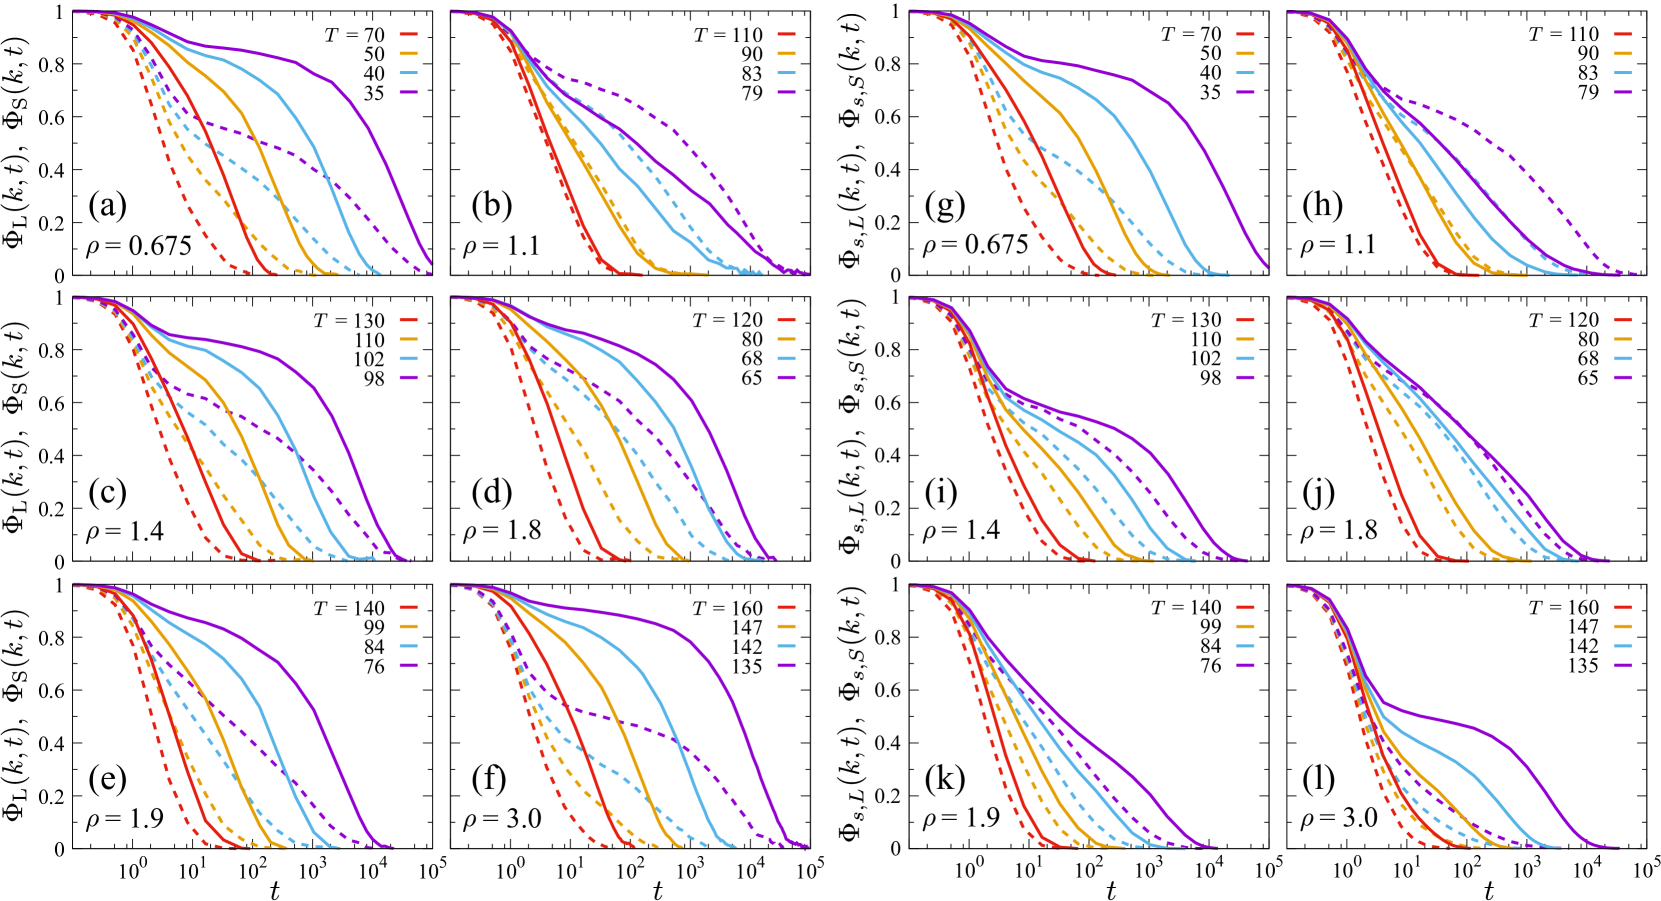
Figure 11 (a)–(f) are the collective parts for the large and small particles, and and (g)–(l) are the self parts, and for various temperatures and for selected densities, , 1.1, 1.4, 1.8, 1.9, and 3.0. For all figures, is chosen to be for large and for small particles, which are close to the first peak of [see Fig. 5]. At low densities, , around which increases with density, both collective and self correlation functions for large and small particles exhibit typical slow dynamics of canonical supercooled fluids, i.e., the two-step relaxation characterized by a well-developed plateau followed by the stretched exponential relaxation as shown in Figs. 11 (a) and (g). Furthermore, the time-temperature superposition holds as for standard glass formers (not shown) Götze (2009). At , where has a minimum and the large particles start clustering, the plateaus of and shown in Figs. 11 (b) and (h) disappear and the relaxation qualitatively changes. Almost linear decays in the semi-log plot in time means that the relaxation is logarithmic. The detail of this anomalous relaxation is discussed in the next subsection. On the other hand, and for small particles still show two-step relaxations. At , we find that both and retrieve the two-step relaxation as shown in Figs. 11 (c) and (i). At , where shows the second minimum and the small particles also start clustering to form dimers, remains qualitatively unchanged, but the dynamics of and become singular, showing the logarithmic decay instead of two-step relaxation. Furthermore, also shows the logarithmic decay. This suggests a decoupling of the collective and self dynamics at this density for the large particles [see Figs. 11 (e) and (k)]. At the highest density , one observes that both and retrieves the two-step relaxation again but two distinct changes are observed for their self parts, and . First, the self part for the large particles retrieves the two-step relaxation but its relaxation time is substantially shorter than its collective part. Secondly, the self part for the small particles does not show the two-step relaxation nor logarithmic relaxation and the relaxation is much faster than other correlation functions. This facilitated relaxation of small particles and decoupling both from its collective dynamics and those of large particles are reminiscent of the dynamical anomaly observed in the binary mixture of the particles with disparate size ratio Moreno and Colmenero (2006a, b). This qualitative change from the two-step relaxation to the single-step relaxation is also similar to the transition from the so-called Type B to Type A dynamics. Type A and Type B dynamics are the two distinct glassy slow dynamics originally predicted by the mode-coupling theory (MCT) Götze and Sjögren (1992). The former refers to a single step relaxation with continuous growth of the height of whereas the latter refers to a two-step relaxation with discontinuous jump of the plateau height of near the glass transition temperature. Mixed dynamics of type A and B is often observed when two competing arresting mechanisms, such as gelation and glass transitions, are at play Zaccarelli et al. (2005); *Zaccarelli2006.
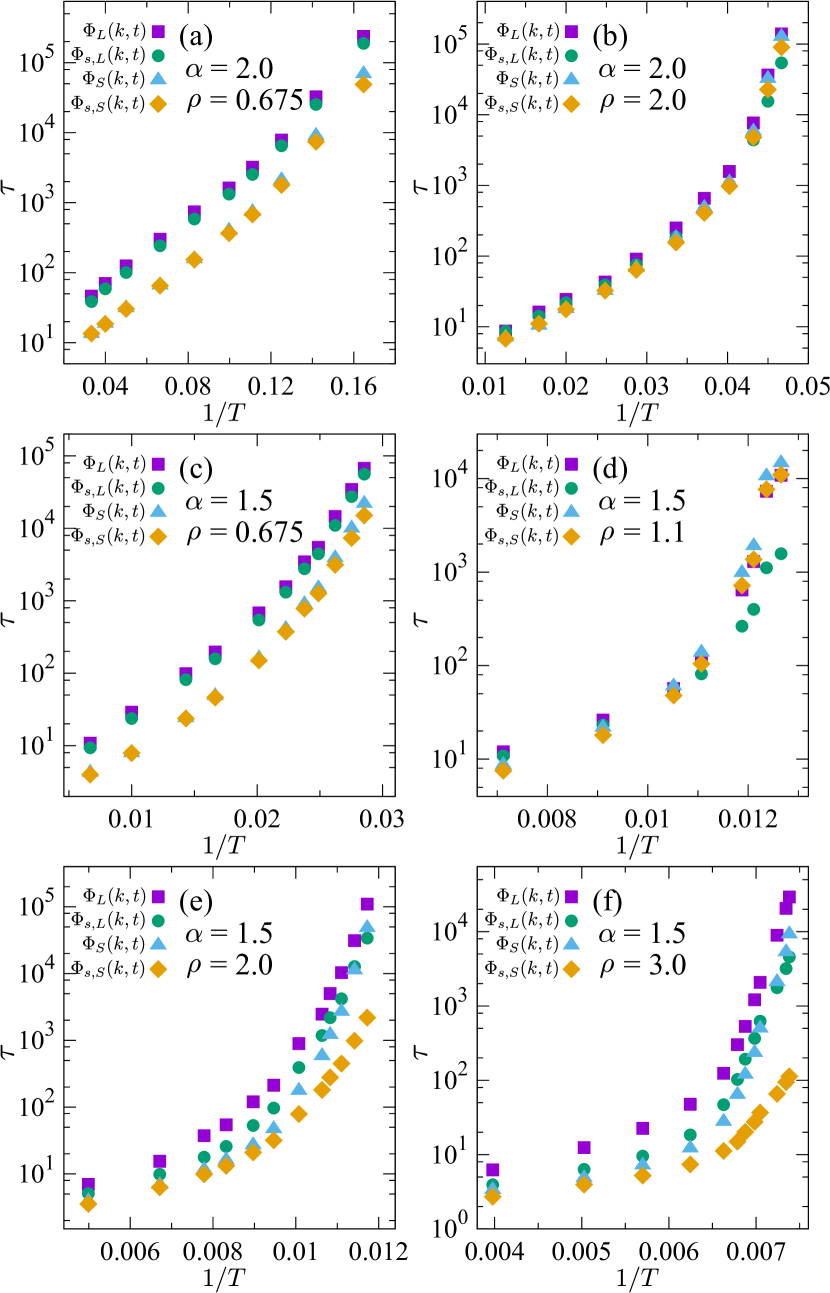
Decoupling of the self and collective relaxation and the large and small particles can be lucidly seen in the temperature dependence of the relaxation time . Figure 12 shows the temperature dependence of for and for the non-clustering system with (Fig. 12 (a)–(b)) and for several densities for the clustering system with (Figs. 12 (c)–(f)). All ’s for , , , and are plotted. It is well established that all relaxation times for both collective and self and for different components behave similarly for conventional glass models such as the Lennard-Jones and hard sphere mixtures Götze (2009). This is indeed the case for as shown in Fig. 12 (a). Aside that for the small particles is slightly smaller, their temperature dependence are identical. Agreement is even better at high densities for (Fig. 12 (b)). For , at the low density is almost identical with those for (Fig. 12 (c)). Interestingly, even at the density where the anomalous logarithmic decay is observed for and , ’s for all correlation functions are similar except for small deviation of for at the lowest temperature. The situation changes at higher densities. At , the four ’s deviate from each other (Fig. 12 (e)). ’s for the collective parts tend to be larger than those of the self parts. Especially, for is substantially smaller and its temperature dependence is weaker than other ’s. This trend is more enhanced at higher density, (Fig. 12 (f)). These observations are consistent with overall trend demonstrated in Fig. 11 and strongly indicates decoupling of dynamics between the self and collective fluctuations and between small and large particles. Dynamics of the self part of small particles is the fastest and its relaxation is very different from the typical glassy dynamics.
IV.2 Relaxations of the center of mass correlations
We investigate microscopic origins of differences of dynamics between the collective and self correlations and between the small and large particles. Similar decoupling of glassy dynamics has been also reported for a binary mixture of GEM near the glass transition temperature Coslovich, Bernabei, and Moreno (2012), according to which the faster relaxation of the self part is due to intercluster hopping of particles. The facilitation of the relaxation due to hopping is even more spectacular for the cluster crystals of a monatomic GEM system, where the particles hop over 10 nearest neighbors distances in a single hopping event Moreno and Likos (2007); Coslovich, Strauss, and Kahl (2011); Montes-Saralegui, Nikoubashman, and Kahl (2013). We first introduce the collective intermediate scattering function for the clusters, defined by the center of mass of clusters instead of particles as
| (9) |
where . denotes the set of indices for the clusters of the component and is the position of the center of mass of the -th cluster. The self part is defined in the same way. Note that the self part is calculated only during the time interval in which a particle resides in a single cluster. Figure 13 shows and for at , at which the system is in the trimer phase. and are also shown in the figure for comparison. At high temperatures (), decays faster than in short times, while it merges to at long times. This faster relaxation can be understood as the instability of clusters at the high temperatures as demonstrated in Figs. 6 and 8, where exhibits a low and broad peak. The positions of the center of mass of the clusters are easily changed by annihilation or rearrangement by thermal fluctuations. At long time, however, almost collapses to for all temperatures. This result eloquently demonstrates that the collective slow dynamics of is governed by slow dynamics of clusters each of which behaves like a rigid molecule. Similar behavior is observed for the small particles. However, decays slightly faster than . This is speculated as the consequences that the clusters of small particles are more unstable than the larger ones as evidenced as a lower and broader peak of [see Figs. 6 and 8]. From these observations, we conclude that glassy slow dynamics of both large and small collective fluctuations are governed not by individual particles but by the clusters.
Next, let us compare the self and collective dynamics. Substantial difference of the shapes of the collective and self correlation functions and their relaxation times discussed in the previous subsection suggests that there exists another relaxation mechanism in the self-correlation functions to facilitate dynamics. To clarify this point, we introduce another function called the single particle correlation function without hopping defined by
| (10) |
where denotes a set of particles of the -th component which belong to the same clusters in a time window . We expect this function to detect particles which have not left the cluster during this time window. This function is introduced in order to assess the contribution of the intercluster particle hopping during the relaxation.
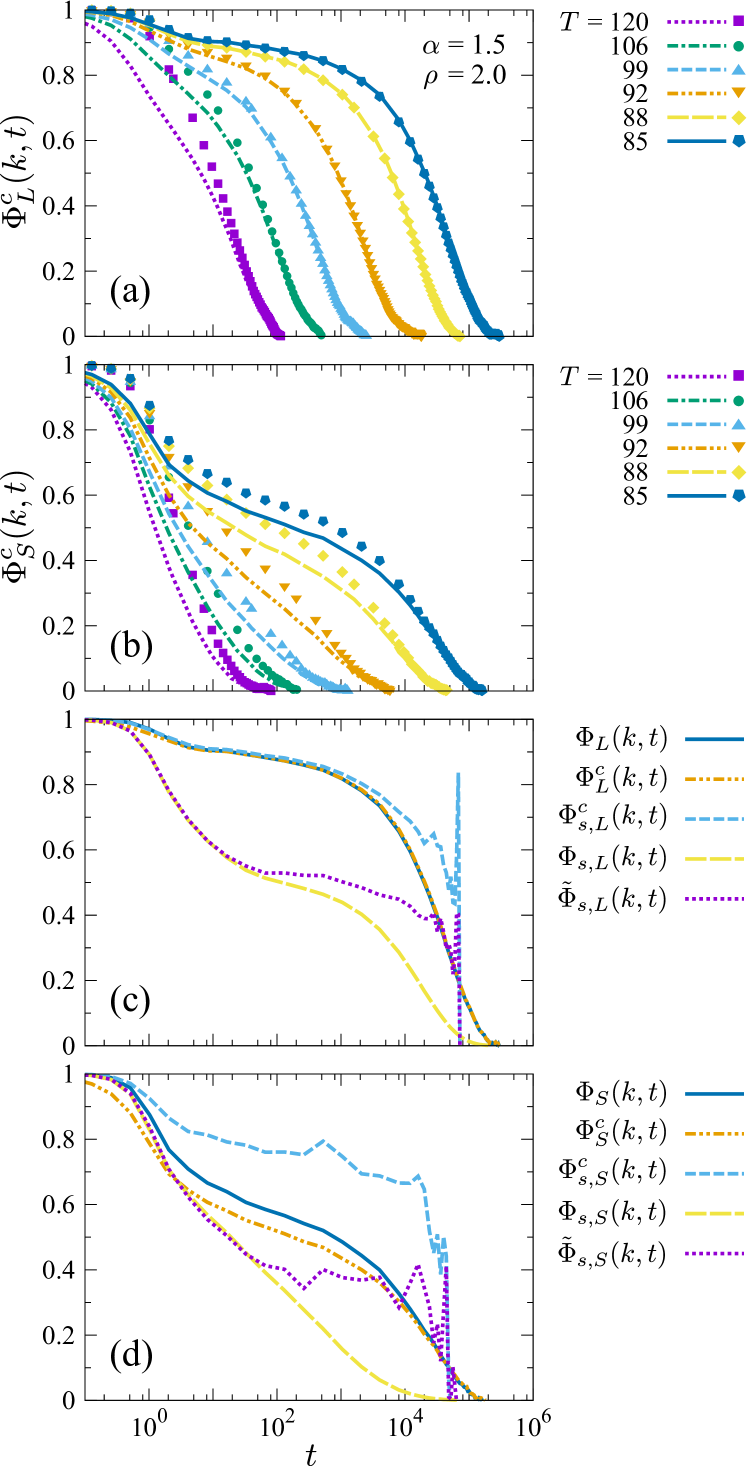
In Figure 13, we show the results at a large density and at a low temperature, where the characteristics of the two functions are most clearly seen. We observe several interesting features, in particular, for the large particles. First, the self-part of the center-of-mass correlator agrees very well with and from the short to intermediate time windows where the plateau is well developed, before it departs from the plateau. Relaxation of is slower than those of and . Eventually abruptly relaxes to zero with jerky oscillations, which is due to dissociation and annihilation of clusters at long times. This result demonstrates that the self dynamics and the collective dynamics of clusters are similar as it is the case for canonical simple glass formers. In other words, the difference between the collective and the self is attributed to the dynamics of the individual particles inside each clusters and the inter-cluster hopping of the particles. The effects of the intra-cluster dynamics and the inter-cluster hopping are distinguished by comparing and in Fig. 13 (c). The two functions display the same behavior in the -relaxation regime, while shows clearer plateau than and its slow relaxation is similar to . This fact demonstrates that the intra-cluster dynamics, detected by both functions, causes the low plateau height and is the primary reason for the different shape of in the short-time window. Fig. 13 (c) also shows that the hopping is responsible for the faster relaxation of than . On the other hand, the dynamics of the small particles shown in Fig. 13 (d) is more complicated than that of the large ones. The single-particle correlation function without hopping has a higher plateau than and the self part of the center-of-mass correlator also displays a higher plateau than the collective and its single-particle counterpart . Since both and do not contain the particles which hop to other clusters, one concludes that the inter-cluster exchange of the particles is one of the reasons for the faster relaxation of . However, the departure of from and starts before that of from . This hints that a different type of dynamics may also exist and affect the relaxation of small particles.
IV.3 Higher order singularities
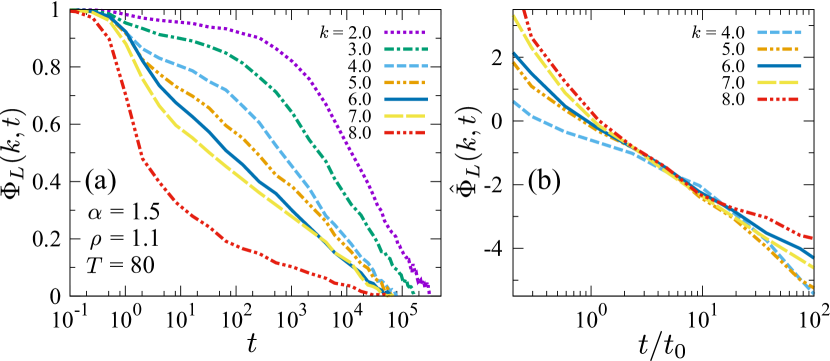
The most outstanding dynamical property of the GHP glass is the logarithmic relaxation appearing at densities where exhibits minima and the particles start forming clusters. As shown in Fig. 11 (b), this anomalous relaxation is most clearly seen at where the large particles start forming the dimer. The plateau of disappears and the relaxation becomes logarithmic, whereas still show the two-step relaxation. The logarithmic relaxation has been originally predicted by MCT Fabbian et al. (1999a, b); Dawson et al. (2000) as a signal of the so-called higher-order ( or ) singularity around the end point of the MCT (dynamical) transition line Götze and Sperl (2002); Götze (2009). Subsequent simulations and experimental studies demonstrated the logarithmic relaxation in various systems, such as short-ranged attractive colloids Mallamace et al. (2000); Chen, Chen, and Mallamace (2002, 2003); Pham et al. (2002); Puertas, Fuchs, and Cates (2002); Zaccarelli et al. (2002); Sciortino, Tartaglia, and Zaccarelli (2003); Cang, Novikov, and Fayer (2003a, b), star polymers Mayer et al. (2009), soft colloidal particles Kandar et al. (2012), square-shoulder potential fluids Das et al. (2013); Gnan et al. (2014), polymer blends Moreno and Colmenero (2006c), binary mixtures of particles with disparate size ratio Moreno and Colmenero (2006d, e); Sentjabrskaja et al. (2016), proteins Lagi, Baglioni, and Chen (2009); Chu et al. (2010), and tRNA Chu et al. (2013). This higher-order singularity tends to appear when the two competing glassy dynamics coexist in the system. For the attractive glasses, the glass transition caused by hard-sphere-like repulsion competes with the glass transition caused by bonding of particles due to sticky short-ranged attraction. For binary systems with the disparate size ratio, the two glassy dynamics characterized by disparate time-scales competes. In our system, the coexistence of the two glass phases, the monomer glass and dimer glass is expected to be the origin of the logarithmic singularity. At the lowest temperature in our system the logarithmic relaxation persisted over four decades and this is observed for both collective and self parts of the correlation functions. To verify that the observed behavior is genuinely due to the higher-order singularity, we fit the data for with the MCT asymptotic function;
| (11) |
where , , and are the critical non-ergodicity parameters, the critical amplitudes of the first, and second orders, respectively Götze (2009); Götze and Sperl (2002). The time scale is determined by the plateau height. We here neglect higher order terms, and , which can be the same order of magnitude as the term but is predicted to vanish in the case of the A4 singularity Götze (2009); Götze and Sperl (2002). , , and calculated for are plotted as functions of in Figs. 14 (a)–(c).
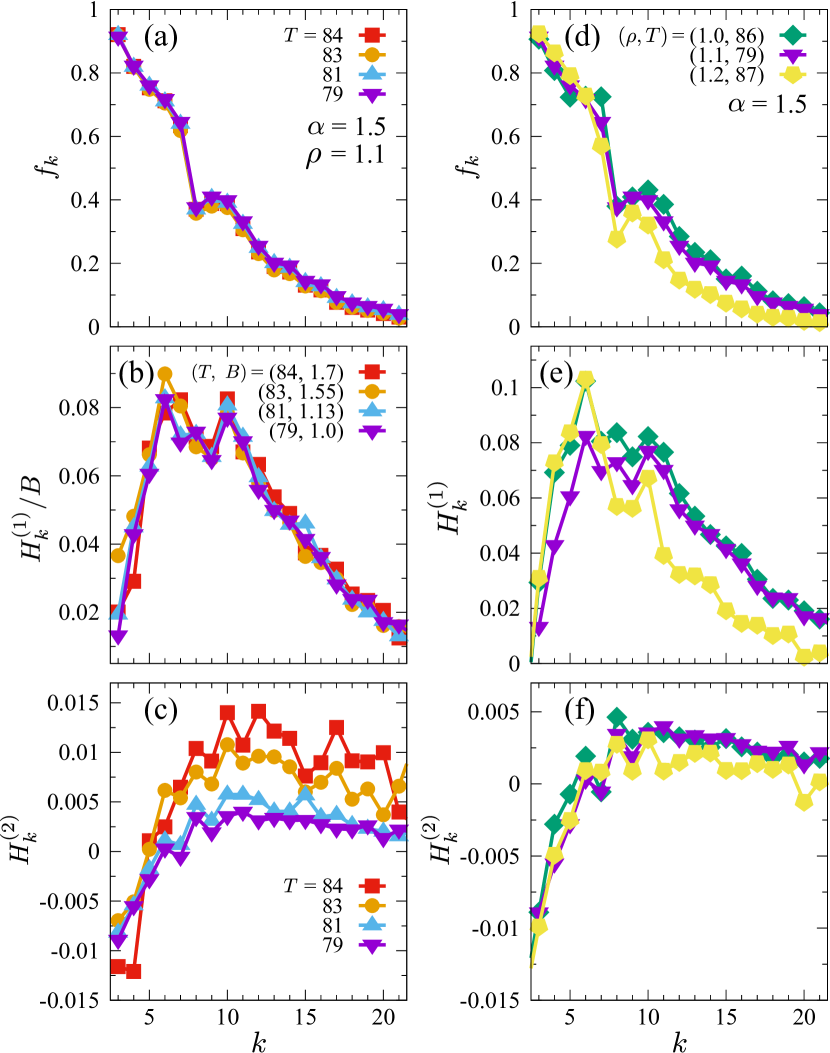
We determined in such a way that . The curves of for different temperatures collapse on a single function as shown in Fig. 14 (a). In Figure 14 (b), we plot scaled with a -independent and -dependent function . This result demonstrates that is self-similar in and can be decomposed as . This is consistent with the prediction of MCT which claims that is independent of Götze and Sperl (2002). We also find that is moderately decreasing function of the temperature. Figure 14 (c) shows . We find that is negative for small and positive for large , and it vanishes at which is close to the first peak of the static structure factor for the large particles. The concave-to-convex crossover as increases shown in Fig. 15 (a) is another typical feature of the singularity. In Figure 15 (b), we plot a rescaled function defined by
| (12) |
If is purely logarithmic, is a straight linear function of . The deviation from a logarithmic function is found at small and large .
Although our result shares similarity with other systems known to exhibit the singular dynamics, the wavevector at which is much larger than those of other systems Zaccarelli et al. (2002); Sciortino, Tartaglia, and Zaccarelli (2003); Das et al. (2013); Gnan et al. (2014). In our systems, this wavevector is close to , implying that the microscopic length scale is at play in our model and that the mechanism behind the singularity is different from other systems. Another difference is that the singular dynamics is most clearly observed for the large particles. For other systems, such as the binary mixture with disparate size ratio, the singular dynamics is observed for small particles Moreno and Colmenero (2006d, e).
In Figures 14 (d)–(f), the density dependence of , , and is shown. One finds no qualitative difference of these parameters slightly below () and above () the critical point, although the parameters for are slightly smaller. This is in stark contrast with the case of the short-range attractive colloids for which discontinuously changes in the vicinity of the singular point Puertas, Fuchs, and Cates (2002); Zaccarelli et al. (2002). Note, however, that the latter is a generic feature of the dynamical singularity but it is due to the intervention of the attractive glass transition caused by strong bonds of the colloidal particles. According to the original formulation of MCT, the higher order dynamical singularity is not necessarily accompanied by the discontinuous changes in the critical parameters Götze (2009).
As the density increases and reaches the second minimum of at , where the large particles form trimers and the small particles form dimer, the logarithmic relaxation is observed for the self part of the large particles, , and for the collective and self parts of the small particles, and , as shown in Figs. 11 (e), (j), and (k). remains to be a two-step relaxation function. At the third minimum at , where the number of particles per cluster increases further, we have not found any logarithmic relaxation any more. Although the higher-order singularities are most clearly seen at the phase boundary from the monomer to dimer phases, it is unclear whether they are completely absent at higher densities or they are simply masked by other complicated relaxation mechanism such as intercluster hopping.
V Conclusion
In this paper, we have presented detailed numerical results for structural and dynamical properties of the binary generalized Hertzian potential (GHP) fluids supercooled near the glass transition temperatures. We especially focused on the interplay of glassy slow dynamics with cluster formation at high densities. The multiple maxima and minima observed in synchronizes with the growth of the cluster sizes. The cluster size shows stepwise increases at every minimum of . Contrary to the conventional glass formers, each of collective and self parts of the intermediate scattering functions for the large and small particles exhibits a distinct dynamics at high densities. The collective part is dominated by dynamics of the clusters’ center of mass, whereas the self part is influenced sensitively by hopping and intra-cluster fluctuations. The terminal relaxations for both the collective and self parts are influenced by the life time of the clusters. Most significant in our studies is the logarithmic relaxation observed most clearly at the phase boundaries separating the monomer and dimer glasses shown as the minima of . At the first minimum of , only the large particles exhibits the logarithmic relaxation, and the singularity of the small particles is observed at the second minimum. The singular dynamics we observed agrees well with the prediction of the mode-coupling theory Götze and Sperl (2002); Götze (2009). However, the singularity were not clearly observed at higher densities where the size of clusters are larger, which may be hidden due to the complex intra- and inter-cluster dynamics. The stepwise change of as a function of density and the fact that this change becomes sharper as the temperature is decreased suggest the putative thermodynamic liquid-liquid transition between the different cluster phases at an even lower temperature. We also observed that the isothermal compressibility develops a peak in the vicinity of the density at which the first clustering is observed. The temperature range over which we have investigated is too high to draw any solid conclusion about the liquid-liquid phase transition. Further and independent investigation is required. However, we envisage that the (thermodynamics + dynamic) phase diagram near the first glass-glass transition (from the monomer to dimer glass phases) would look like Fig. 16.
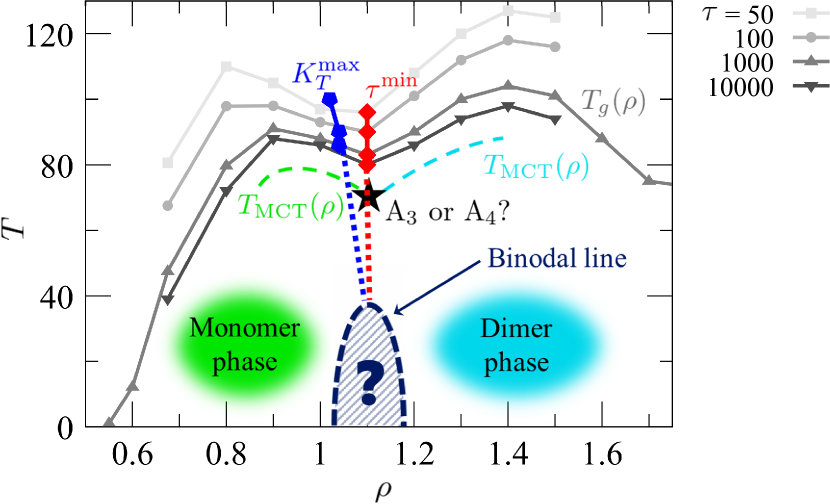
As sketched in this figure, we speculate that the liquid-liquid phase binodal line lies down at the low temperature region and would look similar to the solid-solid binodal found for the cluster crystal of the monatomic Generalized Exponential Model (GEM) [see Fig. 1 of Ref. Zhang, Charbonneau, and Mladek (2010)]. On the other hand, the MCT dynamical transition line would look like the two dashed lines ’s in this figure. We expect that at the intersection (more precisely at the close vicinity of the intersection) of the two lines rests the A3 or A4 singular point. Note that this is not a proof, but it is known in many systems that the higher order singularities are observed in the vicinity of the intersection or termination point where the two glass lines meet Götze (2009). Also plotted in this figure are the loci of the maxima of the compressibility and the minima of the iso- lines (). This is still a preliminary result but it suggests that the two loci meet at a prospective liquid-liquid critical point at a low temperature. We still do not know whether the observed higher order dynamical singularity is generically connected to the underlying liquid-liquid thermodynamic transition. The glass-glass dynamic crossover (such as the fragile-strong crossover) above the liquid-liquid critical point has been discussed in the past but, to the best of our knowledge, the dynamical singularity has never been discussed in the context of the liquid-liquid phase transition. It would be worthwhile to study whether this dynamical anomaly is universally linked to thermodynamic anomaly.
Acknowledgements.
We thank D. Coslovich, A. Ikeda, H. Ikeda, and M. Ozawa for helpful discussions. We acknowledge KAKENHI Grants No. 25103005, No. 25000002, and No. 16H04034.References
- Likos (2006) C. N. Likos, “Soft matter with soft particles,” Soft Matter 2, 478 (2006).
- Malescio (2007) G. Malescio, “Complex phase behaviour from simple potentials,” J. Phys.: Condens. Matter 19, 073101 (2007).
- Likos et al. (2001) C. Likos, A. Lang, M. Watzlawek, and H. Löwen, “Criterion for determining clustering versus reentrant melting behavior for bounded interaction potentials,” Phys. Rev. E 63, 031206 (2001).
- Stillinger (1976) F. H. Stillinger, “Phase transitions in the Gaussian core system,” J. Chem. Phys. 65, 3968 (1976).
- Prestipino, Saija, and Giaquinta (2005) S. Prestipino, F. Saija, and P. V. Giaquinta, “Phase diagram of the Gaussian-core model,” Phys. Rev. E 71, 050102 (2005).
- Pàmies, Cacciuto, and Frenkel (2009) J. C. Pàmies, A. Cacciuto, and D. Frenkel, “Phase diagram of Hertzian spheres,” J. Chem. Phys. 131, 044514 (2009).
- Zhu and Lu (2011) Y. L. Zhu and Z. Y. Lu, “Phase diagram of spherical particles interacted with harmonic repulsions,” J. Chem. Phys. 134, 044903 (2011).
- Miller and Cacciuto (2011) W. L. Miller and A. Cacciuto, “Two-dimensional packing of soft particles and the soft generalized thomson problem,” Soft Matter 7, 7552–7559 (2011).
- Klein et al. (1994) W. Klein, H. Gould, R. A. Ramos, I. Clejan, and A. I. Mel’cuk, “Repulsive potentials, clumps and the metastable glass phase,” Physica A: Statistical Mechanics and its Applications 205, 738–746 (1994).
- Mladek et al. (2006) B. Mladek, D. Gottwald, G. Kahl, M. Neumann, and C. Likos, “Formation of polymorphic cluster phases for a class of models of purely repulsive soft spheres,” Phys. Rev. Lett. 96, 045701 (2006).
- Likos et al. (2007) C. N. Likos, B. M. Mladek, D. Gottwald, and G. Kahl, “Why do ultrasoft repulsive particles cluster and crystallize? analytical results from density-functional theory,” J. Chem. Phys. 126, 224502 (2007).
- Mladek et al. (2007) B. M. Mladek, D. Gottwald, G. Kahl, M. Neumann, and C. N. Likos, “Clustering in the absence of attractions:â density functional theory and computer simulations,” J. Phys. Chem. B 111, 12799–12808 (2007), http://dx.doi.org/10.1021/jp074652m .
- Lascaris et al. (2010) E. Lascaris, G. Malescio, S. Buldyrev, and H. Stanley, “Cluster formation, waterlike anomalies, and re-entrant melting for a family of bounded repulsive interaction potentials,” Phys. Rev. E 81, 031201 (2010).
- Sciortino and Zaccarelli (2013) F. Sciortino and E. Zaccarelli, “Computational materials science: Soft heaps and clumpy crystals.” Nature 493, 30–1 (2013).
- Zhang, Charbonneau, and Mladek (2010) K. Zhang, P. Charbonneau, and B. M. Mladek, “Reentrant and Isostructural Transitions in a Cluster-Crystal Former,” Phys. Rev. Lett. 105, 245701 (2010).
- Zhang and Charbonneau (2012) K. Zhang and P. Charbonneau, “[N]pT Monte Carlo simulations of the cluster-crystal-forming penetrable sphere model,” J. Chem. Phys. 136, 214106–154906 (2012).
- Moreno and Likos (2007) A. Moreno and C. Likos, “Diffusion and relaxation dynamics in cluster crystals,” Phys. Rev. Lett. 99, 107801 (2007).
- Coslovich, Strauss, and Kahl (2011) D. Coslovich, L. Strauss, and G. Kahl, “Hopping and microscopic dynamics of ultrasoft particles in cluster crystals,” Soft Matter 7, 2127 (2011).
- Montes-Saralegui, Nikoubashman, and Kahl (2013) M. Montes-Saralegui, A. Nikoubashman, and G. Kahl, “Hopping and diffusion of ultrasoft particles in cluster crystals in the explicit presence of a solvent.” J. Phys. Condens. Matter 25, 195101 (2013).
- Cinti et al. (2010) F. Cinti, P. Jain, M. Boninsegni, A. Micheli, P. Zoller, and G. Pupillo, “Supersolid droplet crystal in a dipole-blockaded gas,” Phys. Rev. Lett. 105, 135301 (2010).
- Cinti et al. (2014) F. Cinti, T. Macrì, W. Lechner, G. Pupillo, and T. Pohl, “Defect-induced supersolidity with soft-core bosons.” Nature Comm. 5, 3235 (2014).
- Díaz-Méndez et al. (2015) R. Díaz-Méndez, F. Mezzacapo, F. Cinti, W. Lechner, and G. Pupillo, “Monodisperse cluster crystals: Classical and quantum dynamics,” Phys. Rev. E 92, 052307 (2015).
- Díaz-Méndez et al. (2017) R. Díaz-Méndez, F. Mezzacapo, W. Lechner, F. Cinti, E. Babaev, and G. Pupillo, “Glass Transitions in Monodisperse Cluster-Forming Ensembles: Vortex Matter in Type-1.5 Superconductors,” Phys. Rev. Lett. 118, 067001 (2017).
- Lenz et al. (2012) D. A. Lenz, R. Blaak, C. N. Likos, and B. M. Mladek, “Microscopically Resolved Simulations Prove the Existence of Soft Cluster Crystals,” Phys. Rev. Lett. 109, 228301 (2012).
- Bernabei et al. (2013) M. Bernabei, P. Bacova, A. J. Moreno, A. Narros, and C. N. Likos, “Fluids of semiflexible ring polymers: effective potentials and clustering,” Soft Matter 9, 1287 (2013).
- Slimani et al. (2014) M. Z. Slimani, P. Bacova, M. Bernabei, A. Narros, C. N. Likos, and A. J. Moreno, “Cluster Glasses of Semiflexible Ring Polymers.” ACS Macro Lett. 3, 611–616 (2014).
- Berthier and Witten (2009a) L. Berthier and T. A. Witten, “Compressing nearly hard sphere fluids increases glass fragility,” Europhys. Lett. 86, 10001 (2009a).
- Berthier and Witten (2009b) L. Berthier and T. A. Witten, “Glass transition of dense fluids of hard and compressible spheres,” Phys. Rev. E 80, 021502 (2009b).
- O’Hern et al. (2003) C. S. O’Hern, L. E. Silbert, A. J. Liu, and S. R. Nagel, “Jamming at zero temperature and zero applied stress: The epitome of disorder,” Phys. Rev. E 68, 011306 (2003).
- Donev et al. (2004) A. Donev, S. Torquato, F. H. Stillinger, and R. Connelly, “Comment on “Jamming at zero temperature and zero applied stress: The epitome of disorder”,” Phys. Rev. E 70, 043301 (2004).
- O’Hern et al. (2004) C. S. O’Hern, L. E. Silbert, A. J. Liu, and S. R. Nagel, “Reply to “Comment on ‘Jamming at zero temperature and zero applied stress: The epitome of disorder’ ”,” Phys. Rev E 70, 043302 (2004).
- van Hecke (2010) M. van Hecke, “Jamming of soft particles: geometry, mechanics, scaling and isostaticity.” J. phys.: Condens. Matter 22, 033101 (2010).
- Berthier, Moreno, and Szamel (2010) L. Berthier, A. Moreno, and G. Szamel, “Increasing the density melts ultrasoft colloidal glasses,” Phys. Rev. E 82, 060501 (2010).
- Wang, Duan, and Xu (2012) L. Wang, Y. Duan, and N. Xu, “Non-monotonic pressure dependence of the dynamics of soft glass-formers at high compressions,” Soft Matter 8, 11831–11838 (2012).
- Zhao, Tian, and Xu (2011) C. Zhao, K. Tian, and N. Xu, “New jamming scenario: From marginal jamming to deep jamming,” Phys. Rev. Lett. 106, 125503 (2011).
- Ikeda and Miyazaki (2011a) A. Ikeda and K. Miyazaki, “Glass transition of the monodisperse Gaussian core model,” Phys. Rev. Lett. 106, 015701 (2011a).
- Ikeda and Miyazaki (2011b) A. Ikeda and K. Miyazaki, “Slow dynamics of the high density Gaussian core model.” J. Chem. Phys. 135, 054901 (2011b).
- Ikeda and Miyazaki (2012) A. Ikeda and K. Miyazaki, “Ultra-Soft Potential System as a Mean-Field Model of the Glass Transition,” J. Phys. Soc. Jpn. 81, SA006 (2012).
- Coslovich, Ikeda, and Miyazaki (2016) D. Coslovich, A. Ikeda, and K. Miyazaki, “Mean-field dynamic criticality and geometric transition in the gaussian core model,” Phys. Rev. E 93, 042602 (2016).
- Coslovich, Bernabei, and Moreno (2012) D. Coslovich, M. Bernabei, and A. J. Moreno, “Cluster glasses of ultrasoft particles,” J. Chem. Phys. 137, 184904 (2012).
- Schmiedeberg (2013) M. Schmiedeberg, “Multiple reentrant glass transitions of soft spheres at high densities: Monotonicity of the curves of constant relaxation time in jamming phase diagrams depending on temperature over pressure and pressure,” Phys. Rev. E 87, 052310 (2013).
- Miyazaki, Kawasaki, and Miyazaki (2016) R. Miyazaki, T. Kawasaki, and K. Miyazaki, “Cluster glass transition of ultrasoft-potential fluids at high density,” Phys. Rev. Lett. 117, 165701 (2016).
- Frenkel and Smit (2001) D. Frenkel and B. Smit, Understanding Molecular Simulation (Academic Press, 2001).
- Coslovich and Ikeda (2013) D. Coslovich and A. Ikeda, “Cluster and reentrant anomalies of nearly Gaussian core particles,” Soft Matter 9, 6786 (2013).
- Louis, Bolhuis, and Hansen (2000) A. Louis, P. Bolhuis, and J. Hansen, “Mean-field fluid behavior of the Gaussian core model,” Phys. Rev. E 62, 7961–7972 (2000).
- Archer and Evans (2001) A. J. Archer and R. Evans, “Binary gaussian core model: Fluid-fluid phase separation and interfacial properties,” Phys. Rev. E 64, 041501 (2001).
- Archer, Likos, and Evans (2002) A. J. Archer, C. N. Likos, and R. Evans, “Binary star-polymer solutions: bulk and interfacial properties,” J. Phys.: Condens. Matter 14, 12031–12050 (2002).
- Katayama et al. (2000) Y. Katayama, T. Mizutani, W. Utsumi, O. Shimomura, M. Yamakata, and K.-i. Funakoshi, “A first-order liquid—[ndash]—liquid phase transition in phosphorus,” Nature 403, 170–173 (2000).
- Poole et al. (1997) P. H. Poole, T. Grande, C. A. Angell, and P. F. McMillan, “Polymorphic Phase Transitions in Liquids and Glasses,” Science 275 (1997).
- Holten et al. (2012) V. Holten, C. E. Bertrand, M. A. Anisimov, and J. V. Sengers, “Thermodynamics of supercooled water,” J. Chem. Phys. 136, 094507 (2012).
- Vasisht, Saw, and Sastry (2011) V. V. Vasisht, S. Saw, and S. Sastry, “Liquidâliquid critical point in supercooled silicon,” Nature Phys. 7, 549–553 (2011).
- Luo et al. (2014) J. Luo, L. Xu, E. Lascaris, H. E. Stanley, and S. V. Buldyrev, “Behavior of the widom line in critical phenomena,” Phys. Rev. Lett. 112, 135701 (2014).
- Götze (2009) W. Götze, Complex Dynamics of Glass-Forming Liquids (Oxford University Press, Oxford, 2009).
- Moreno and Colmenero (2006a) A. J. Moreno and J. Colmenero, “”Anomalous dynamic arrest in a mixture of large and small particles”,” Phys. Rev. E 74, 021409 ((2006)a).
- Moreno and Colmenero (2006b) A. J. Moreno and J. Colmenero, “”Relaxation Scenarios in a Mixture of Large and Small Spheres: Dependence on the Size Disparity”,” J. Chem. Phys. 125, 164507 ((2006)b).
- Götze and Sjögren (1992) W. Götze and L. Sjögren, “”Relaxation processes in supercooled liquids”,” Rep. Prog. Phys. 55, 241–376 ((1992)).
- Zaccarelli et al. (2005) E. Zaccarelli, C. Mayer, A. Asteriadi, C. N. Likos, F. Sciortino, J. Roovers, H. Iatrou, N. Hadjichristidis, P. Tartaglia, H. Löwen, and D. Vlassopoulos, “”Tailoring the Flow of Soft Glasses by Soft Additives”,” Phys. Rev. Lett. 95, 268301 (2005).
- Zaccarelli et al. (2006) E. Zaccarelli, I. Saika-Voivod, S. V. Buldyrev, A. J. Moreno, P. Tartaglia, and F. Sciortino, “”Gel to glass transition in simulation of a valence-limited colloidal system”,” J. Chem. Phys. 124, 124908 (2006).
- Fabbian et al. (1999a) L. Fabbian, W. Götze, F. Sciortino, P. Tartaglia, and F. Thiery, “Ideal glass-glass transitions and logarithmic decay of correlations in a simple system,” Phys. Rev. E 59, R1347–R1350 (1999a).
- Fabbian et al. (1999b) L. Fabbian, W. Götze, F. Sciortino, P. Tartaglia, and F. Thiery, “Erratum: Ideal glass-glass transitions and logarithmic decay of correlations in a simple system [phys. rev. e 59 , r1347 (1999)],” Phys. Rev. E 60, 2430–2430 (1999b).
- Dawson et al. (2000) K. Dawson, G. Foffi, M. Fuchs, W. Götze, F. Sciortino, M. Sperl, P. Tartaglia, T. Voigtmann, and E. Zaccarelli, “Higher-order glass-transition singularities in colloidal systems with attractive interactions,” Phys. Rev. E 63, 011401 (2000).
- Götze and Sperl (2002) W. Götze and M. Sperl, “Logarithmic relaxation in glass-forming systems,” Phys. Rev. E 66, 011405 (2002).
- Mallamace et al. (2000) F. Mallamace, P. Gambadauro, N. Micali, P. Tartaglia, C. Liao, and S.-H. Chen, “Kinetic glass transition in a micellar system with short-range attractive interaction,” Phys. Rev. Lett. 84, 5431–5434 (2000).
- Chen, Chen, and Mallamace (2002) W.-R. Chen, S.-H. Chen, and F. Mallamace, “Small-angle neutron scattering study of the temperature-dependent attractive interaction in dense copolymer micellar solutions and its relation to kinetic glass transition,” Phys. Rev. E 66, 021403 (2002).
- Chen, Chen, and Mallamace (2003) S.-H. Chen, W.-R. Chen, and F. Mallamace, “The glass-to-glass transition and its end point in a copolymer micellar system.” Science 300, 619–22 (2003).
- Pham et al. (2002) K. N. Pham, A. M. Puertas, J. Bergenholtz, S. U. Egelhaaf, A. Moussaïd, P. N. Pusey, A. B. Schofield, M. E. Cates, M. Fuchs, and W. C. K. Poon, “Multiple glassy states in a simple model system.” Science 296, 104–6 (2002).
- Puertas, Fuchs, and Cates (2002) A. M. Puertas, M. Fuchs, and M. E. Cates, “Comparative simulation study of colloidal gels and glasses,” Phys. Rev. Lett. 88, 098301 (2002).
- Zaccarelli et al. (2002) E. Zaccarelli, G. Foffi, K. A. Dawson, S. V. Buldyrev, F. Sciortino, and P. Tartaglia, “Confirmation of anomalous dynamical arrest in attractive colloids: A molecular dynamics study,” Phys. Rev. E 66, 041402 (2002).
- Sciortino, Tartaglia, and Zaccarelli (2003) F. Sciortino, P. Tartaglia, and E. Zaccarelli, “Evidence of a higher-order singularity in dense short-ranged attractive colloids,” Phys. Rev. Lett. 91, 268301 (2003).
- Cang, Novikov, and Fayer (2003a) H. Cang, V. N. Novikov, and M. D. Fayer, “Logarithmic decay of the orientational correlation function in supercooled liquids on the Ps to Ns time scale,” J. Chem. Phys. 118, 2800 (2003a).
- Cang, Novikov, and Fayer (2003b) H. Cang, V. N. Novikov, and M. D. Fayer, “Experimental observation of a nearly logarithmic decay of the orientational correlation function in supercooled liquids on the picosecond-to-nanosecond time scales.” Phys. Rev. Lett. 90, 197401 (2003b).
- Mayer et al. (2009) C. Mayer, F. Sciortino, C. N. Likos, P. Tartaglia, H. Löwen, and E. Zaccarelli, “Multiple Glass Transitions in Star Polymer Mixtures: Insights from Theory and Simulations,” Macromolecules 42, 423–434 (2009).
- Kandar et al. (2012) A. K. Kandar, J. K. Basu, S. Narayanan, and A. Sandy, “Anomalous structural and dynamical phase transitions of soft colloidal binary mixtures,” Soft Matter 8, 10055 (2012).
- Das et al. (2013) G. Das, N. Gnan, F. Sciortino, and E. Zaccarelli, “Unveiling the complex glassy dynamics of square shoulder systems: simulations and theory.” J. Chem. Phys. 138, 134501 (2013).
- Gnan et al. (2014) N. Gnan, G. Das, M. Sperl, F. Sciortino, and E. Zaccarelli, “Multiple glass singularities and isodynamics in a core-softened model for glass-forming systems,” Phys. Rev. Lett. 113, 258302 (2014).
- Moreno and Colmenero (2006c) A. J. Moreno and J. Colmenero, “Is there a higher-order mode coupling transition in polymer blends?” J. Chem. Phys. 124, 184906 (2006c).
- Moreno and Colmenero (2006d) A. J. Moreno and J. Colmenero, “Anomalous dynamic arrest in a mixture of large and small particles,” Phys. Rev. E 74, 021409 (2006d).
- Moreno and Colmenero (2006e) A. J. Moreno and J. Colmenero, “Relaxation scenarios in a mixture of large and small spheres: dependence on the size disparity.” J. Chem. Phys. 125, 164507 (2006e).
- Sentjabrskaja et al. (2016) T. Sentjabrskaja, E. Zaccarelli, C. De Michele, F. Sciortino, P. Tartaglia, T. Voigtmann, S. U. Egelhaaf, and M. Laurati, “Anomalous dynamics of intruders in a crowded environment of mobile obstacles.” Nature comm. 7, 11133 (2016).
- Lagi, Baglioni, and Chen (2009) M. Lagi, P. Baglioni, and S.-H. Chen, “Logarithmic decay in single-particle relaxation of hydrated lysozyme powder,” Phys. Rev. Lett. 103, 108102 (2009).
- Chu et al. (2010) X.-q. Chu, M. Lagi, E. Mamontov, E. Fratini, P. Baglioni, and S.-H. Chen, “Experimental evidence of logarithmic relaxation in single-particle dynamics of hydrated protein molecules,” Soft Matter 6, 2623 (2010).
- Chu et al. (2013) X.-Q. Chu, E. Mamontov, H. O’Neill, and Q. Zhang, “Temperature Dependence of Logarithmic-like Relaxational Dynamics of Hydrated tRNA.” J. Phys. Chem. lett. 4, 936–42 (2013).