The History of the Muon Experiments
B. Lee Roberts ,
Department of Physics
Boston University
Boston, MA 02215 USA
* roberts@bu.edu
![]() Proceedings for the 15th International Workshop on Tau Lepton Physics,
Proceedings for the 15th International Workshop on Tau Lepton Physics,
Amsterdam, The Netherlands, 24-28 September 2018
scipost.org/SciPostPhysProc.Tau2018
Abstract
I discuss the history of the muon measurements, beginning with the Columbia-Nevis measurement that observed parity violation in muon decay, and also measured the muon -factor for the first time, finding . The theoretical (Standard Model) value contains contributions from quantum electrodynamics, the strong interaction through hadronic vacuum polarization and hadronic light-by-light loops, as well as the electroweak contributions from the , and Higgs bosons. The subsequent experiments, first at Nevis and then with increasing precision at CERN, measured the muon anomaly down to a precision of 7.3 parts per million (ppm). The Brookhaven National Laboratory experiment E821 increased the precision to 0.54 ppm, and observed for the first time the electroweak contributions. Interestingly, the value of measured at Brookhaven appears to be larger than the Standard Model value by greater than three standard deviations. A new experiment, Fermilab E989, aims to improve on the precision by a factor of four, to clarify whether this result is a harbinger of new physics entering through loops, or from some experimental, statistical or systematic issue.
1 Introduction
The muon was first observed in cosmic rays by Paul Kunze [1] as a “particle of uncertain nature”111“Natur der oberen positiven Korpuskel nicht sicher bekannt.”. It was definitively identified by Anderson and Neddemeyer [2], and confirmed by Street and Stevenson [3, 4], and by Nishina et al., [5]. There was significant confusion as to the nature of this new particle. It interacted too weakly with matter [6] to be the Yukawa particle [7], and it did not spontaneously decay to an electron and a ray [8, 9], nor did it convert to an electron in the field of a nucleus [9]. It became possible that the muon might be like a heavy electron, which was a complete mystery.
1.1 Spin and magnetic moments
Our modern view of quantum mechanics of the leptons began with Dirac’s famous paper where he introduced the relativistic equation for the electron [10]. In that seminal paper he found that he was able to obtain the measured magnetic moment of the electron: “an unexpected bonus for me, completely unexpected”. [11]
However, the story of spin began earlier. In an almost unknown paper, the idea of electron spin was first proposed by A.H. Compton [12], who proposed a spinning electron to explain ferromagnetism, which he realized was difficult to explain by any other means. Subsequently Unlenbeck and Goudsmit [13, 14] proposed their spinning electron to explain fine-structure splitting in atomic spectra. However there was a factor of two discrepancy between the measured fine structure splitting and that predicted using Schrödinger quantum mechanics and their suggestion of spin. This factor of two was shown to be a relativistic effect by L.H. Thomas [15, 16] which we now call “Thomas precession”. Later, in a letter to Goudsmit, Thomas said [17]:
I think you and Uhlenbeck have been very lucky to get your spinning electron published and talked about before Pauli heard of it. It appears that more than a year ago, Kronig believed in the spinning electron and worked out something; the first person he showed it to was Pauli. Pauli ridiculed the whole thing so much that the first person became also the last and no one else heard anything of it. Which all goes to show that the infallibility of the Deity does not extend to his self-styled vicar on earth.
which adds a certain irony that we now talk about the “Pauli theory of spin”.
A spin 1/2 particle, has a magnetic moment along the spin:
| (1) |
I use the notation of Czarnecki and Mariano [18], where and . When placed in a magnetic field, there is a torque on the spin, . If the particle is at rest, the rate at which the spin turns, the Larmor frequency, is given by
| (2) |
1.2 The first muon spin rotation experiments
When Lee and Yang [19] questioned whether the weak force respected the parity symmetry, they laid out the details of several experiments that could observe this violation including in muon decay, all of which were soon observed experimentally [20, 21, 22]. Parity violation in pion decay produced polarized muons. Furthermore, parity violation in muon decays produced a correlation between the muon spin and the highest energy positrons.
Lee and Yang also pointed out that that parity violation would provide a way to measure the muon magnetic moment. With the experimental observation of parity violation in the decay chain [21, 22], a tool to measure the magnetic moment became available. The muon from pion decay at rest, , is born 100% polarized to conserve angular momentum, since the neutrino (antineutrino) is left (right) handed. For a beam of pions, the very forward muons, as well as the very backward muons have a high degree of polarization. Thus the weak interaction provides experimentalists with information on where the muon spin was initially and in the decay, the highest energy positrons are correlated with the muon spin. Thus the polarized muon at rest in a magnetic field will precess, and the parity violating weak decay will cause a modulation of the high-energy decay positrons with the Larmor frequency, .
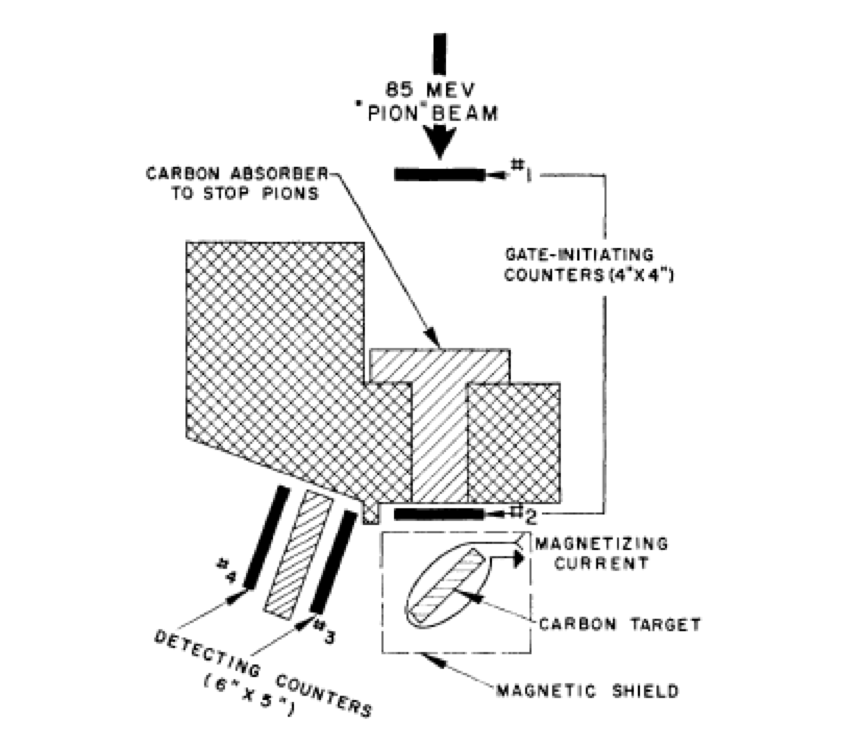
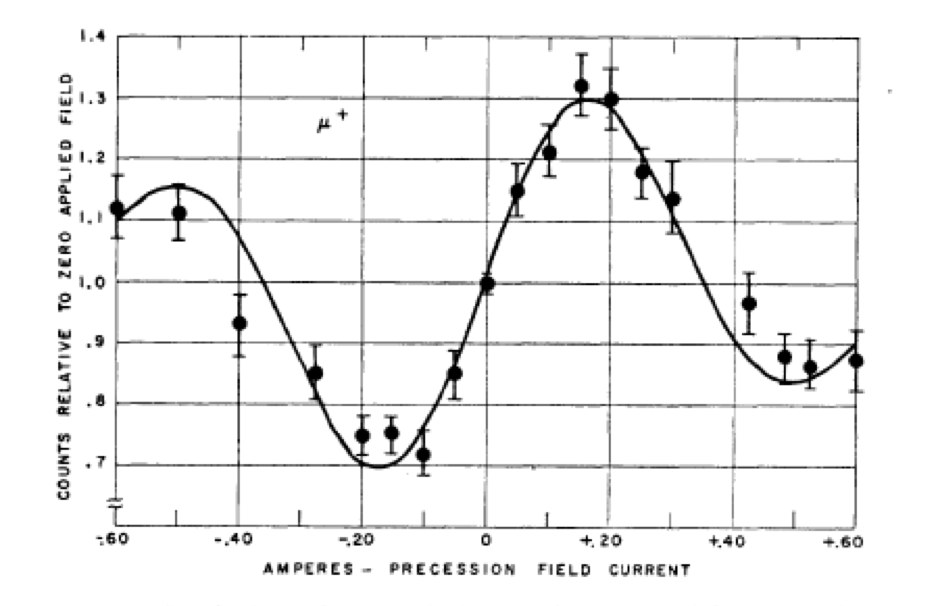
Garwin, Lederman and Weinrich [21] used a mixed beam of and from the Nevis cyclotron. Using a degrader, they stopped the pions, and muons exiting the degrader were then stopped in a carbon target, placed in a magnetic field as shown in Fig. 1(a). A scintillator telescope measured the subsequent decay for a fixed time interval. The magnetic field was varied, with higher field causing more spin precession in the magnetic field before decay. The data from this first muon spin rotation experiment [21], Observation of the Failure of Conservation of Parity and Charge Conjugation in Meson Decays: the Magnetic moment of the Free Muon, shown in Fig. 1(b) permitted Garwin et al., to measure the muon -value, and found to 10% precision.
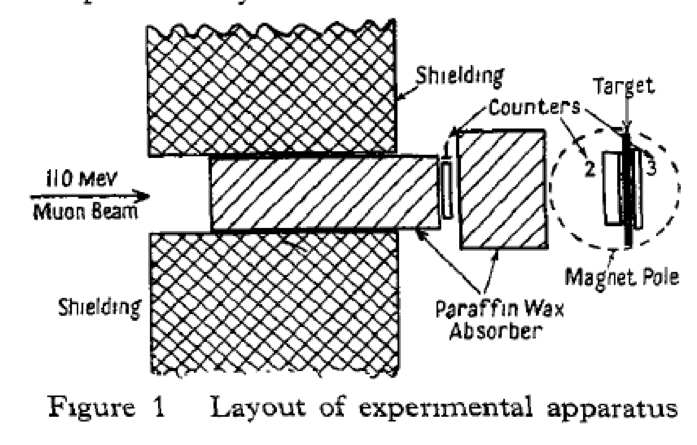
Very soon thereafter, the precision on was improved significantly by Cassels et al [23] to at the University of Liverpool cyclotron. Polarized muons were stopped in a Cu or C target, which was inside of an external magnetic field, as shown in Fig. 2(a). A stopped muon was defined as . A delayed coincidence of defined a muon decay. The stop started an “analyzer”, a voltage ramp, which was read out with a multichannel analyzer when a muon decay trigger was received. This technique was the beginning of what we now call a time to digital converter. Their data shown in Fig. 2(b) have the exponential muon lifetime divided out, using the measured muon lifetime from Bell and Hincks [24].
At the conclusion of this paper, the authors state:
the value of itself should be sought in a comparison of the precession and cyclotron frequencies of muons in a magnetic field. The two frequencies are expected to differ only by the radiative correction.
We explain this statement in the next section.

1.3 Why go beyond ?
In 1948 Julian Schwinger published a revolutionary paper on quantum electrodynamics (QED) and the magnetic moment of the electron [25]. In that paper he presented the very first calculation of a radiative correction in QED, which was motivated by the larger than expected hyperfine structure in hydrogen [26, 27]. Schwinger’s result, the famous mass-independent correction to the electron magnetic moment:
| (3) |
was the beginning of the calculation of radiative corrections, which became increasingly important in the study of lepton magnetic moments. This calculation was confirmed by the famous experiment of Kush and Foley [28]. Today the electron anomaly has been measured to a few parts per billion [29], which required the QED theory to be extended to tenth-order (5 loops) [30].
For the muon, things are more complicated, since the contribution of heavier physics, relative to the electron, scales as So the standard model value of has measurable contributions from QED, the strong and electroweak sector, as shown graphically in Fig. 3. Possible new, as yet undiscovered, physics beyond the Standard Model could also contribute to the muon magnetic anomaly through loops, as indicated in Fig. 3(e).

1.4 Going beyond in the laboratory
In a series of follow-up experiments at Nevis using a stopped muon beam, Garwin, et al. [31] improved on their initial measurement of the muon magnetic moment. In a note in proof, enabled by a new measurement of the muon mass, they obtained
| (4) |
which agreed with the value that Schwinger calculated [25]. This final Nevis measurement provided strong evidence that in a magnetic field, the muon behaved like a heavy electron. This observation, combined with the failure to observe the electromagnetic decay [8, 9] clearly pointed to the generation structure of the Standard Model. The observation of the muon neutrino two years later [32] clarified the existence of the second generation, which became an important ingredient in the Standard Model.
We should note at this point that these low-energy experiments with stopped muons used positive muons, since low-energy negative muons when brought into matter will stop and then be captured into atomic orbits. Since the Bohr radius is proportional to the inverse of the mass of the orbiting particle, the muon quickly gets inside of the atomic electron cloud and forms a hydrogen-like atom, cascading down to the atomic ground state of the muonic atom. It will then undergo weak capture on the nucleus, or decay, which will reduce the effective muon lifetime from the free muon lifetime of 2.2 s. So any measurement of the muon magnetic moment that involves stopping a muon in matter, should be done with .
1.5 The Spin Equations and Subsequent Experiments
When traversing a magnetic field where the velocity is perpendicular to the magnetic field (), the muon spin and momentum turn with the frequencies
| (5) |
where is the rate at which the spin turns relative to the momentum. This difference frequency provides a way to measure the anomaly, directly, and explains the quote from Cassels, et al. [23] above. All subsequent experiments measured this difference frequency, instead of measuring directly. Experimentally one measures and , where the magnetic field is averaged over the muon distribution.
Nuclear magnetic resonance (NMR) was used in all of the CERN experiments to measure . The presence of magnetic gradients over the NMR probes causes damping of the NMR signal, and reduces the precision of the NMR measurement. In addition, if the magnetic field contains gradients, which are necessary to focus the muon beam vertically, then the paths of the stored muons needed to be known well, in order to calculate the average magnetic field on the muon ensemble. As the precision on was increased in a series of three experiments at CERN, it became necessary to come up with a new way of focusing the beam, which eliminated the need for magnetic gradients. The technique used in the third CERN experiment will be discussed below in some detail, since it formed the basis of the Brookhaven-based experiment, E821, as well as the ongoing Fermilab experiment, E989.
2 The CERN Experiments
2.1 CERN-1
The first CERN experiment was carried out at the CERN synchrocylotron with a beam of [33, 34]. It should be noted that one of the motivations to press on with a more precise measurement was to search for a breakdown of QED. A cutoff of the muon propagator of energy , would modify the anomaly to be . So from the beginning, the muon experiments were searching for evidence of new physics.
The beam was brought to a large dipole magnet with a magnetic field that contained a small gradient that caused the muon circular orbits to drift slowly toward the far end of the magnet as shown in Fig. 4(a). The beam was injected into the magnet using a beryllium degrader between the second and third scintillation counters. At the end of the magnet, a large magnetic gradient ejected the muons from the magnet. The exiting muons were stopped in a methylene iodide target, chosen because it did not destroy the muon polarization. The backward (forward) decays were recorded with a ( ) signal. The time distribution of the muon decays is shown in Fig. 4(b). Note that the muons were non-relativistic, so the muon lifetime is essentially 2.2 s. The final result was[34]:
| (6) |

The limitations of this experimental method are obvious: the muon lifetime at rest is 2.2 s, which limits the measurement period to a few lifetimes. CERN-1 measured from 2 s to 6.5 s [33] and then from 2 s to 8 s [34]. This short lifetime and measurement period means that the number of muon decays measured is small. It became clear that to make a significant improvement in the uncertainty, the experiment should be done with a more intense muon beam and at a higher muon energy, where the time dilated muon lifetime, was significantly larger than 2.2 s.
2.2 CERN-2
The next experiment at CERN was done using a storage ring. The elements of a storage ring experiment are: 1) an incident beam of particles; 2) a kick to store the injected particles onto stable orbits in the storage ring; 3) detectors to detect the daughter particles that come out of the storage ring reactions, in this case the positrons from muon decay. The issue of injection into a storage ring is quite complicated, and the latter two CERN experiments dodged this technical problem by using the decay as a muon kicker to store muons.
The second CERN collaboration [35] built a 5 m diameter magnetic weak focusing storage ring that contained a pion production target inside of the ring, as shown in Fig. 5(a). The magnetic field was 1.711 T, GeV/c and .
The detectors were lead-scintillator sandwiches optimized to measure the high-energy decay positrons, which carry the muon spin information at the time of decay. These detectors measured both the arrival time and (crudely) the energy of the decay positrons. The arrival time spectrum is described by
| (7) |
where was defined in Eq. 5, and is the product of the weak decay asymmetry times the average polarization of the muon beam. The statistical error on is given by
| (8) |

The result obtained in CERN-2 was
| (9) |
which tested QED up to sixth-order, viz. to order .
The large hadronic background from the pion production target placed inside of the storage ring compromised the detectors, and limited the sensitivity of this experiment. The statistical power was limited by the poor efficiency for producing pions that were captured into an orbit in the storage ring which then produce a stored muon.
The limitation of this second CERN measurement was the small number of muons stored, and the enormous background in the counters at injection caused by the large hadronic flash in the detectors caused by “junk” from the production target.
2.3 CERN-3
To increase the precision of the measurement of further, one needed to go to a higher muon lifetime, and to accumulate more data. The major issue with a storage ring experiment that uses weak magnetic focusing, is with magnetic gradients present. The major issue is “How do you know the average field felt by the muon distribution precisely without knowing the muon orbits precisely?” The solution was found by the third CERN collaboration by examining the the spin precession formula for a muon in a storage ring with a uniform magnetic field and an electric quadrupole field to provide vertical focusing. In atomic physics this arrangement is called a Penning Trap.
With the presence of both electric and magnetic fields, the cyclotron frequency becomes
| (10) |
and the spin rotation frequency is
| (11) |
where the term comes from the vertical pitching motion of the muons in the weak focusing storage ring.
Eq. 11 was first discovered by Thomas [16] in 1927. We use the version given in Jackson’s book [36] in modern notation, which is equivalent to Thomas’ Eq. 4.121 in Ref. [16]. 222Bargmann, Michel and Telegdi [37] also studied this problem.
Using , we find that the spin difference frequency is333Strictly speaking, the rate of change of the angle between the spin and the momentum vectors, = ‘precession frequency’, is equal to only if and are parallel. For the E821 and E989 experiments, the angle between and is always small and the rate of oscillation of out of pure circular motion is fast compared to , allowing us in the following discussion the make the approximation that . More general calculations, where this approximation is not made, are found in References [38, 39, 40, 41]. For the CERN-3, E821 and E989 experimental conditions, the results presented here are the same as those in these references.
| (12) |
For the moment, we ignore the term in Eq. 12 and get
| (13) |
While a relativistic particle moving in an electric field will experience a motional magnetic field, the negative sign in the parentheses introduces a cancellation at , GeV/c. By building a muon storage ring that operates at the “magic” , the effect of the motional magnetic field is minimized. Small corrections are necessary to account for the vertical pitching motion, the () term, and for the fact that not all muons are at the central radius, and therefore not at magic momentum. For details see [42, 43, 40] and references therein.


A new 7 m diameter storage ring, composed of 40 contiguous magnets, was designed and constructed as shown in Fig. 6(a). Twenty four lead-scintillator shower counters were placed symmetrically around the inside of the ring to measure the arrival time and energy of the positrons.
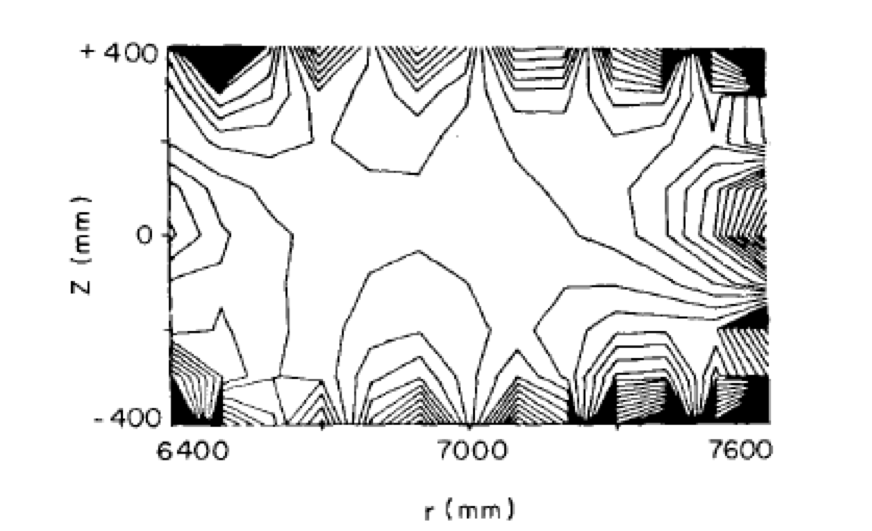
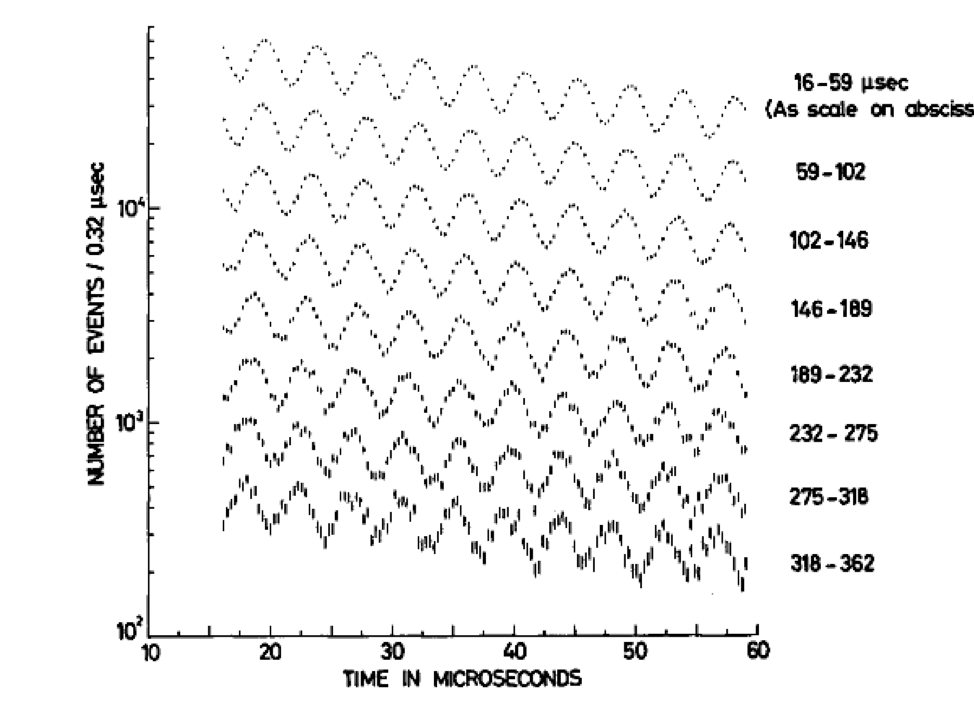
There were four significant improvements over the CERN-2 experiment: 1) The injection of a pion beam into the storage ring; 2) The development of an inflector magnet that canceled the field of the storage ring so that the beam deflection entering into the storage ring was minimal; 3) The use of the magic meant that the muon lifetime was extended to 64.4 s, which significantly increased the measurement time; 4). The more uniform magnetic field with weak electric focusing made it easier to determine the average magnetic field weighted over the muon distribution. The magnetic field averaged over azimuth is shown in Fig. 7(a).
The inflector magnetic field was generated by a current pulse which rose to a peak value of 300 kA in 12 s [44]. Electrostatic quadrupoles [45] with 2-fold symmetry provided weak vertical focusing. The quadrupoles were pulsed on during the data collection time, and then off between fills of the ring to minimize the trapping of electrons by the quadrupole field, to minimize sparks in the system.
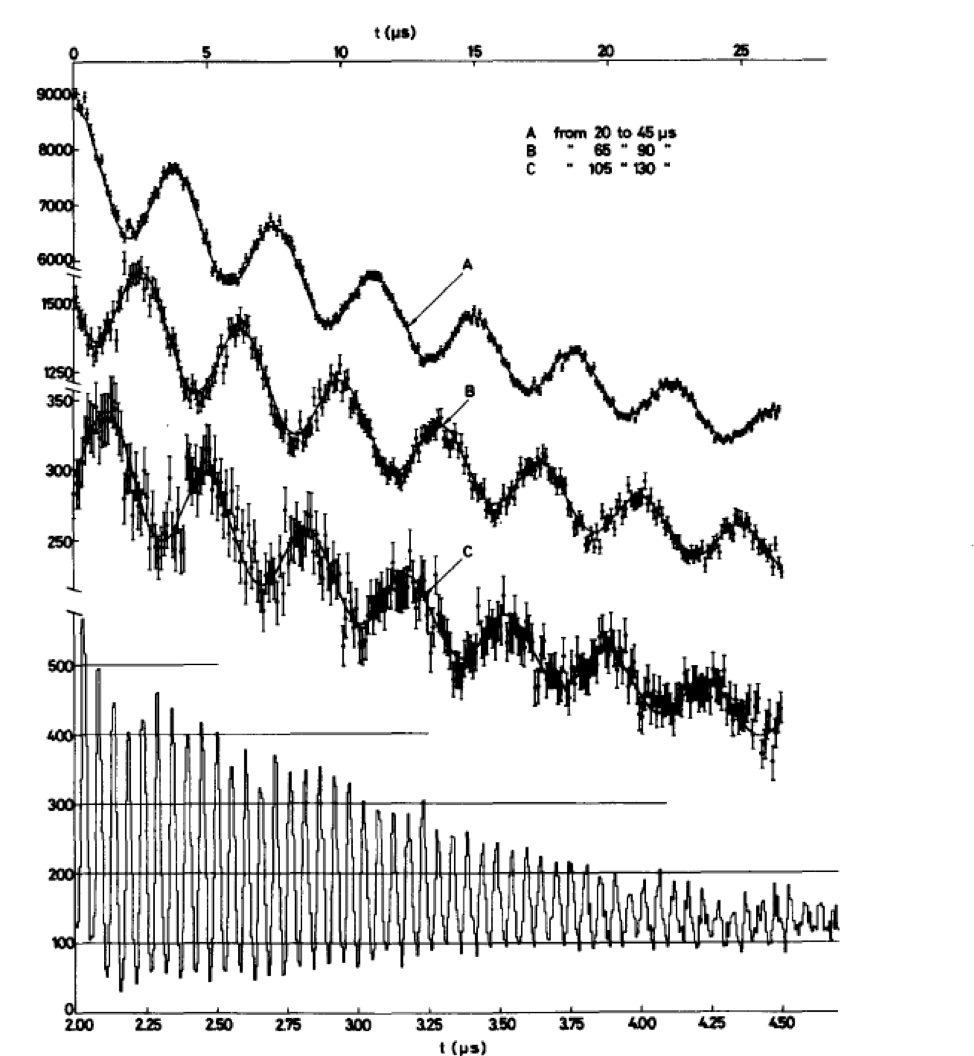
The time spectrum of high-energy positrons is shown in Fig. 7(b). The CERN-3 experiment measured both positive and negative muons, and the final results were [44]
| (14) | |||||
| (15) | |||||
| (16) |
which agreed well with the Standard Model Value. To compare with theory, it became necessary to include QED to sixth order, and the hadronic contribution. The precision was not adequate to be sensitive to eighth-order QED, or the electroweak contribution.
3 Brookhaven Experiment E821
To increase the precision on the muon anomaly, with the goal to observe the electroweak contribution, as well as to search for contributions from New Physics such as supersymmetry, a new experiment was proposed for the Brookhaven National Laboratory (BNL) Alternating Gradient Synchrotron (AGS). The first meetings began at Brookhaven around 1984. The plan was to use the magic and electrostatic focusing, that was developed at CERN. A collaboration was formed, that eventually became BNL Experiment E821. Final approval came from the U.S. Department of Energy and from the Laboratory in 1989.
There were a number of significant improvements planned for the new experiment: 1) A much more uniform magnetic field using a superferric superconducting storage ring magnet; 2) A passive superconducting inflector magnet; 3) A beam tube NMR trolley that could map the magnetic field in the storage ring often, by simply turning the muon beam off; 4) An array of 378 NMR probes around the ring to continuously monitor the magnetic field during data collection; 5) A 4-fold symmetry for the electrostatic quadrupoles instead of 2-fold, which resulted in , compared to 3.26 for the two-fold symmetry used at CERN; 6) A circular beam with collimators to minimize the importance of both higher magnetic multipoles and higher moments of the muon beam distribution in the determination of the average magnetic field felt by the muons; 7) A fast muon kicker to directly inject muons into the storage ring rather than pions, which would drastically reduce the flash from the beam pions after injection; and 8) A much more intense pion/muon beam than was available at CERN.
The E821 beamline was designed to permit either pion injection or muon injection into the storage ring. A 24 GeV/c momentum proton pulse ( ns) from the AGS containing up to protons, was extracted from the AGS and brought to a pion production target. The secondary beamline contained an 80 m pion decay channel, which had momentum selection collimators both before and after the decay channel [47]. After the final momentum selection, the beam was brought into the experimental hall and entered the storage ring through a penetration in the the yoke shown in Fig 8(a).
Before the fast muon kicker became available, E821 had a short pion injection run in the style of CERN-3 using the decay to provide the kick. The initial flash in the electron calorimeters from the injected pion beam was enormous. This flash prevented us from analyzing data before 75 s after injection [48], more than one muon lifetime of 64 s.
When we switched to muon injection, things became much more manageable. Once the fast muon kicker became available, the muon beam beam entering the storage ring had a pion to muon ratio .
We were able to begin the fit around 30 s after injection, which was after the muon beam debunched in the ring, and the initial flash from the pions in the muon beam died away. Muon injection enabled us to improve on the precision of by a factor of 14 over the CERN-3 result. Fig 8(a) shows the geometry of the incoming muon beam, and (b) the region at the inflector exit.
A superconducting inflector magnet was designed based on a truncated double cosine theta design [49]. This design provided a superconducting septum magnet that had minimal magnetic flux leakage into the muon storage region. Furthermore it was surrounded with a passive superconducting shield, that essentially eliminated the flux leakage from the inflector magnet [50]. This static superconducting design eliminated the repetition rate limitations of the pulsed CERN-3 inflector, and had the important advantage that it did not produce any eddy currents or other transient magnetic fields associated with the beam injection.


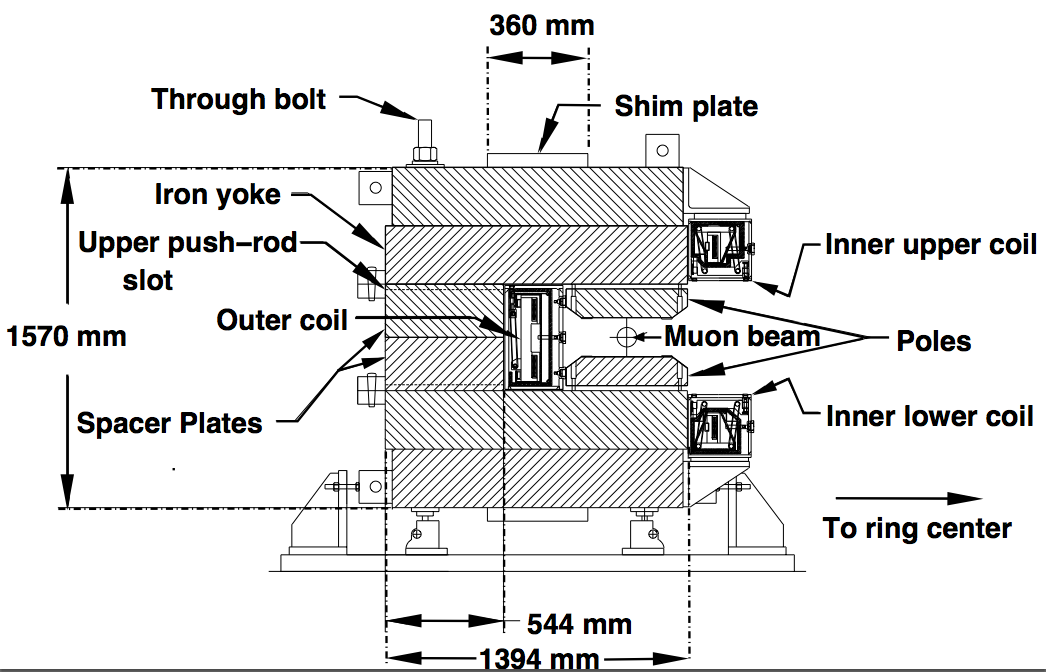
The storage ring yoke and pole design consisted of azimuthally continuous sections [51], unlike the 40 separate magnets in the CERN-3 design. The as-built azimuthal gaps between yoke pieces was 0.8 mm, with an rms deviation of 0.2 mm. This small spacing between yoke pieces made it possible to eliminate the “bumps” in the magnetic field that were present in the 40 gaps between the individual magnets in the CERN-3 storage ring. An air gap between the main yoke and the pole pieces, decoupled the magnetic field in the storage region from possible non-uniformities in the yoke steel. The precision pole pieces were fabricated from special steel that was continuous vacuum-cast steel with 0.004% carbon. The tolerance on flatness for the pole pieces was 25 m, which represents 140 ppm of the magnet gap. A number of shimming tools were built into the design of the magnet [51]. The upper and lower pole faces were machined parallel to 0.005 cm. There were two penetrations through the magnet yoke, for the beam to enter the storage ring, and for the inflector magnet services. To minimize the flux disturbance in the yoke, iron plates were added around the holes on the outer radius side of the yoke to compensate for the iron removed to make the penetrations.

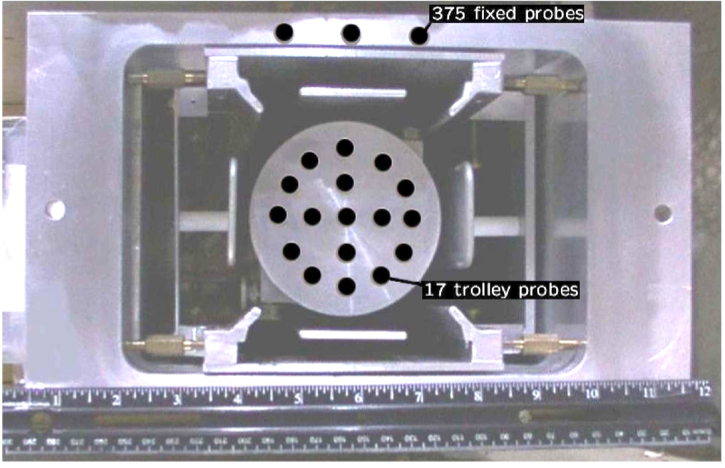
The magnetic field was measured and monitored with nuclear magnetic resonance probes [53]. There were 378 probes (called “fixed probes”) placed in grooves machined into the outside the vacuum chamber above and beneath the muon storage region. These probes made it possible to track the magnetic field in the entire storage region during the data collection period. Because of magnetic gradients at the pole piece boundaries, and only about half of these proved useful. An NMR trolley inside of the vacuum chamber was outfitted with 17 NMR probes, as shown in Fig. 10(b). The trolley remained in a garage during data collection. Once every several days the beam was turned off, and the trolley traveled around the ring measuring the field at about 6000 points and then returned to the garage. The trolley map was then correlated with the fixed probe readings to determine the magnetic field seen by the muons during data collection.
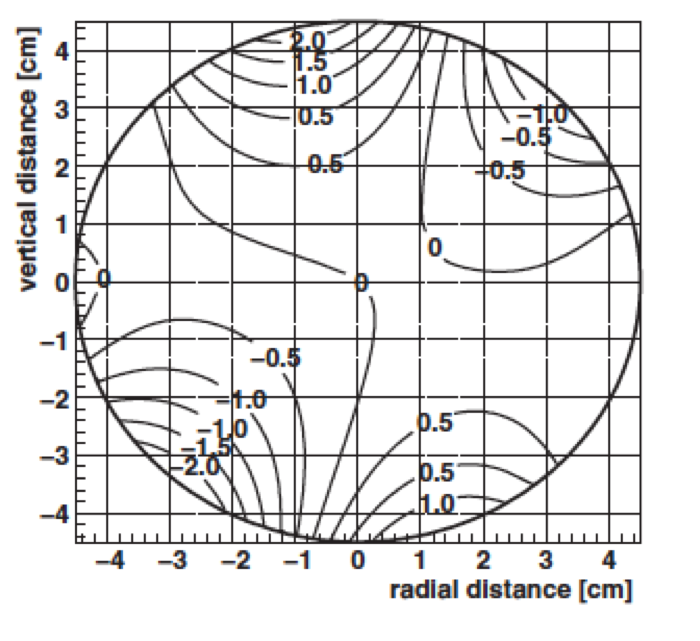
The dipole field from a sample trolley run is shown in Fig. 11(a). The RMS of this map is 39 ppm, with a peak-to-peak range of 230 ppm. The field averaged over the azimuth is shown in Fig. 11(b), which should be compared with the CERN map in Fig. 7. Since the storage ring is a weak focusing betatron, the muons slowly sample the full azimuthal magnetic field, so the magnetic field averaged over azimuth is the relevant quantity.

Twenty four lead-scintillating fiber electromagnetic calorimeters [54] were placed symmetrically around the storage ring. Four acrylic lightguides carried the light to four photomultipliers which were analog summed and then wave-form digitized. The muon beam vacuum chambers had a “sawtooth” arrangement, as shown in Fig. 10(a). The calorimeters, located in air, were placed into this sawtooth step. The decay positrons exited this sawtooth through a thin Al window before striking the calorimeter, which prevented shower losses before the calorimeter, which was important in preserving the decay asymmetry in the data.
The arrival time spectrum of electrons from the 2001 data collection period is shown in Fig. 12(a). There are approximately events in this spectrum, and the precision on from this data set was 0.7 ppm.
E821 measured both and . Assuming CPT symmetry, the final result from E821 was:
| (17) |
which is shown in Fig. 12(b) along with the individual measurements.


4 Fermilab E989
To clarify whether the 3.7-standard deviation difference between the Standard Model and the E821 measurements, a new experiment was founded at Fermilab. The experiment re-uses the storage ring magnet and the superconducting inflector from E821, with a re-furbished NMR trolley and magnetic field measurement system.
The new features of E989 are: 1) A pure muon beam with no hadronic component has been designed and commissioned; 2) Segmented calorimeters consisting of a array of lead fluoride crystals, which permit the observation of minimizing ionizing particles such as muons lost from the storage ring; 3) A new fast muon kicker using a Blumlein pulse-forming network; 4) Improved magnetic shimming that has improved the magnetic field uniformity by a factor of two; 5) Two straw tracker arrays inside of the vacuum chamber upstream of two of the calorimeters; 6) More rapid rate of filling the storage ring from the Fermilab accelerator facility. The goal is to accumulate 21 times more data than E821, to improve the systematic errors by a factor of and the overall uncertainty a factor of four over E821. More details and a progress report are covered in the talk by Anna Driutti at this meeting.
5 Summary and Conclusions
The measurement of the muon magnetic moment spans six decades, and the story is not over. With the recent significant improvements in the Standard Model value of the muon anomaly [56, 57, 55] evidence for a possible deviation between the experimental value and the Standard Model value continues to grow. The E821 result now differs by more than three and a half standard deviations from the Standard Model value. Fortunately there are two new experiments that should be able to clarify this discrepancy. The Fermilab experiment E989, which represents the next level of improvement in the series of “magic ” storage ring experiments, is now collecting data with the goal of a fourfold improvement over BNL E821. A new experiment, E34 at J-PARC, discussed at this conference by Tsutomu Mibe, is developing a very different technique to measure the anomaly.
6 Acknowledgments
For many years I have been deeply involved in the muon experiment E821 at Brookhaven, and in the new Fermilab experiment E989 that is now coming on line. I wish to thank all of my collaborators for their contributions, and for the many things that they taught me. I especially wish to recognize the very senior members, many of whom have died over the past decade or so. I wish to acknowledge the enormous amount of knowledge that I gained from Francis J.M. Farley (1920 - 2018), who played a leading role in all three CERN experiments as well as being a collaborator on E821; Vernon W. Hughes (1920 - 2008), founder and Co-spokesperson for E821; Frank Krienen (1917-2008), who designed the inflector magnet and electric quadrupoles for the CERN-3 experiment, and made many contributions to E821 including the design of the superconducting inflector magnet; Gordon Danby (1929-2016), who came up with the brilliant magnetic design of the E821/E989 storage ring; and Gisbert zu Putlitz, a senior collaborator whose wisdom and leadership in E821 was essential. I also learned many things from Emilio Picasso (1927-2014), who was deeply involved in CERN-3, and was a friendly critic as we prepared E821. At the very beginning of the planning for E821, Fred Combley (1935-2001) suggested that direct muon injection into the storage ring should be developed. That suggestion, and its realization by our team at Brookhaven was essential to the success of E821. Muon injection is also a central feature of the new Fermilab experiment.
This work was supported in part by the U.S. Department of Energy Office of High Energy Physics.
References
- [1] P. Kunze, Z. Phys. 83, 1 (1933).
- [2] C. D. Anderson and S. H. Neddermeyer, Phys. Rev. 50, 263 (1936), 10.1103/PhysRev.50.263.
- [3] J. Street and E. Stevenson, Phys Rev. 51, 1005 (1937).
- [4] J. C. Street and E. C. Stevenson, Phys. Rev. 52, 1003 (1937), 10.1103/PhysRev.52.1003.
- [5] Y. Nishina, M. Takeuchi and T. Ichimiya, Phys. Rev. 52, 1198 (1937), 10.1103/PhysRev.52.1198.
- [6] M. Conversi, E. Pancini and O. Piccioni, Phys. Rev. 71, 209 (1947), 10.1103/PhysRev.71.209, [,579(1947)].
- [7] H. Yukawa, Proc. Phys. Math. Soc. Japan 20, 319 (1938).
- [8] E. P. Hincks and B. Pontecorvo, Phys. Rev. 73, 257 (1948), 10.1103/PhysRev.73.257.
- [9] S. Lokanathan and J. Steinberger, Phys Rev. 98, 240A Minutes of the 1954 Thanksgiving Meeting (1955).
- [10] P. A. M. Dirac, Proc. Roy. Soc. Lond. A117, 610 (1928).
- [11] A. Pais, Paul Dirac: The Man and His Work, Cambridge U. Press (1998).
- [12] A. Compton, Jour. Franklin Inst. 192, 145 (1921).
- [13] G. E. Uhlenbeck and S. Goudsmit, Naturwissenschaften 13, 953 (1925).
- [14] G. E. Uhlenbeck and S. Goudsmit, Nature 117, 264 (1926).
- [15] L. H. Thomas, Nature 117, 514 (1926), 10.1038/117514a0.
- [16] L. H. Thomas, Phil. Mag. Ser.7 3, 1 (1927), 10.1080/14786440108564170.
- [17] L. H. Thomas, AIP Archives https://lorentz.leidenuniv.nl/history/spin/goudsmit.html (1926).
- [18] A. Czarnecki and W. J. Marciano, Adv. Ser. Direct. High Energy Phys. 20, 11 (2009), 10.1142/9789814271844_0002.
- [19] T. D. Lee and C.-N. Yang, Phys. Rev. 104, 254 (1956), 10.1103/PhysRev.104.254.
- [20] C. S. Wu, E. Ambler, R. W. Hayward, D. D. Hoppes and R. P. Hudson, Phys. Rev. 105, 1413 (1957), 10.1103/PhysRev.105.1413.
- [21] R. L. Garwin, L. M. Lederman and M. Weinrich, Phys. Rev. 105, 1415 (1957), 10.1103/PhysRev.105.1415.
- [22] J. I. Friedman and V. L. Telegdi, Phys. Rev. 105, 1681 (1957), 10.1103/PhysRev.105.1681.
- [23] J. M. Cassels, T. W. O’Keeffe, M. Rigby, A. M. Wetherell and J. R. Wormald, Proceedings of the Physical Society. Section A 70(7), 543 (1957).
- [24] W. E. Bell and E. P. Hincks, Phys. Rev. 84, 1243 (1951), 10.1103/PhysRev.84.1243.
- [25] J. S. Schwinger, Phys. Rev. 73, 416 (1948), 10.1103/PhysRev.73.416.
- [26] J. E. Nafe, E. B. Nelson and I. I. Rabi, Phys. Rev. 71, 914 (1947), 10.1103/PhysRev.71.914.
- [27] D. E. Nagel, R. S. Julian and J. R. Zacharias, Phys. Rev. 72, 971 (1947), 10.1103/PhysRev.72.971.
- [28] P. Kusch and H. M. Foley, Phys. Rev. 74, 250 (1948), 10.1103/PhysRev.74.250.
- [29] D. Hanneke, S. Fogwell and G. Gabrielse, Phys. Rev. Lett. 100, 120801 (2008), 10.1103/PhysRevLett.100.120801, 0801.1134.
- [30] T. Aoyama, T. Kinoshita and M. Nio, Phys. Rev. D97(3), 036001 (2018), 10.1103/PhysRevD.97.036001, 1712.06060.
- [31] R. L. Garwin, D. P. Hutchinson, S. Penman and G. Shapiro, Phys. Rev. 118, 271 (1960), 10.1103/PhysRev.118.271.
- [32] G. Danby et al., Phys. Rev. Lett. 9, 36 (1962), 10.1103/PhysRevLett.9.36.
- [33] G. Charpak et al., Phys. Rev. Lett. 6, 128 (1961), 10.1103/PhysRevLett.6.128.
- [34] G. Charpak, F. J. M. Farley and R. L. Garwin, Phys. Lett. 1, 16 (1962).
- [35] J. Bailey et al., Phys. Lett. B28, 287 (1968), 10.1016/0370-2693(68)90261-X.
- [36] J. D. Jackson, Classical Electrodynamics, Wiley, New York, NY, 3rd ed. edn. (1999).
- [37] V. Bargmann, L. Michel and V. L. Telegdi, Phys. Rev. Lett. 2, 435 (1959), 10.1103/PhysRevLett.2.435, [,92(1959)].
- [38] F. J. M. Farley, Phys. Lett. B42, 66 (1972), 10.1016/0370-2693(72)90718-6.
- [39] F. Combley and E. Picasso, Phys. Rept. 14, 1 (1974), 10.1016/0370-1573(74)90004-0.
- [40] J. H. Field and G. Fiorentini, Nuovo Cim. A21, 297 (1974), 10.1007/BF02724809.
- [41] F. J. M. Farley and E. Picasso, Adv. Ser. Direct. High Energy Phys. 7, 479 (1990), 10.1142/9789814503273_0011, [,479(1990)].
- [42] J. Grange et al. (2015), 1501.06858.
- [43] J. P. Miller and B. L. Roberts (2018), 1805.01944.
- [44] J. Bailey et al., Nucl. Phys. B150, 1 (1979), 10.1016/0550-3213(79)90292-X.
- [45] W. Flegel and F. Krienen, Nucl. Instrum. Meth. 113, 549 (1973), 10.1016/0029-554X(73)90749-0.
- [46] J. Bailey and et al., Phys. Lett. 55B, 420 (1975), 10.1016/0370-2693(75)90374-3.
- [47] G. W. Bennett et al., Phys. Rev. D73, 072003 (2006), 10.1103/PhysRevD.73.072003, hep-ex/0602035.
- [48] R. M. Carey et al., Phys. Rev. Lett. 82, 1632 (1999), 10.1103/PhysRevLett.82.1632.
- [49] F. Krienen, D. Loomba and W. Meng, Nucl. Instrum. Meth. A283, 5 (1989), 10.1016/0168-9002(89)91249-7.
- [50] A. Yamamoto et al., Nucl. Instrum. Meth. A491, 23 (2002), 10.1016/S0168-9002(02)01232-9.
- [51] G. T. Danby et al., Nucl. Instrum. Meth. A457, 151 (2001), 10.1016/S0168-9002(00)00704-X.
- [52] G. W. Bennett et al., Phys. Rev. Lett. 92, 161802 (2004), 10.1103/PhysRevLett.92.161802, hep-ex/0401008.
- [53] R. Prigl, U. Haeberlen, K. Jungmann, G. zu Putlitz and P. von Walter, Nucl. Instrum. Meth. A374(1), 118 (1996), 10.1016/0168-9002(96)37493-7.
- [54] S. A. Sedykh et al., Nucl. Instrum. Meth. A455, 346 (2000), 10.1016/S0168-9002(00)00576-3.
- [55] A. Keshavarzi, D. Nomura and T. Teubner, Phys. Rev. D97(11), 114025 (2018), 10.1103/PhysRevD.97.114025, 1802.02995.
- [56] M. Davier, A. Hoecker, B. Malaescu and Z. Zhang, Eur. Phys. J. C77(12), 827 (2017), 10.1140/epjc/s10052-017-5161-6, 1706.09436.
- [57] F. Jegerlehner, EPJ Web Conf. 166, 00022 (2018), 10.1051/epjconf/201816600022, 1705.00263.