Measurement of the Negative Muon Anomalous Magnetic Moment to 0.7 ppm
Abstract
The anomalous magnetic moment of the negative muon has been measured to a precision of 0.7 parts per million (ppm) at the Brookhaven Alternating Gradient Synchrotron. This result is based on data collected in 2001, and is over an order of magnitude more precise than the previous measurement of the negative muon. The result (0.7 ppm), where the first uncertainty is statistical and the second is systematic, is consistent with previous measurements of the anomaly for the positive and negative muon. The average for the muon anomaly is (0.5 ppm).
pacs:
13.40.Em, 12.15.Lk, 14.60.EfThe anomalous magnetic moments of the muon and the electron have played an important role in the development of the standard model. Compared to the electron, the muon anomaly has a relative sensitivity to heavier mass scales which typically is proportional to . At the present level of accuracy the muon anomaly gives an experimental sensitivity to virtual and gauge bosons as well as a potential sensitivity to other, as yet unobserved, particles in the few hundred GeV/ mass range kh .
We report our result for the negative muon anomalous magnetic moment from data collected in early 2001. The measurement is based on muon spin precession in a magnetic storage ring with electrostatic focusing. The same experimental technique was used as in our most recent measurements of muplus ; g2_2000 , and a similar precision of 0.7 ppm was achieved. Detailed descriptions of the apparatus may be found elsewhere nimpapers ; fei ; nimpapers2 ; kicker ; quads .
For polarized muons moving in a uniform magnetic field perpendicular to the muon spin and to the plane of the orbit and in an electric quadrupole field , which is used for vertical focusing quads , the angular frequency difference, between the spin precession frequency and the cyclotron frequency, is given by
| (1) |
The dependence of on the electric field is eliminated by storing muons with the “magic” cern , which corresponds to a muon momentum GeV/. Hence measurement of and of , in terms of the free proton NMR frequency and the ratio of muon to proton magnetic moments , determines . At the magic , the muon lifetime is approximately and the precession period is . With a field of 1.45 T in our storage ring nimpapers , the central orbit radius is 7.11 m.
The difference frequency was determined by counting the number of decay electrons above an energy threshold. The time spectrum of decay electrons is then given by
| (2) |
The normalization , asymmetry , and phase vary with the chosen energy threshold.
The measurement of the magnetic field frequency is based on proton NMR in water. A trolley with 17 NMR probes was moved typically every three days throughout the entire muon storage region. About 150 fixed NMR probes distributed around the ring in the top and bottom walls of the vacuum chamber were used to interpolate the field between trolley measurements. The system was calibrated with respect to a standard probe with a spherical sample fei . The homogeneity of the field in 2001 (Figure 1) was similar to that achieved for the opposite polarity field in 2000 g2_2000 .
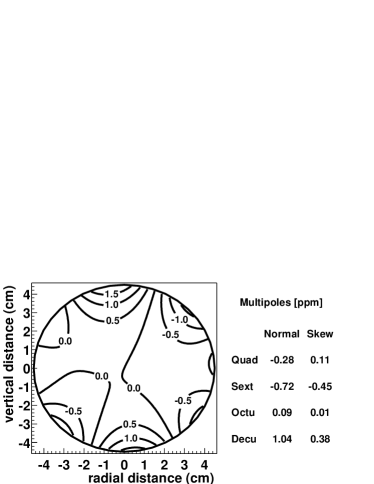
The field weighted with the analyzed event sample was obtained from two largely independent analyses, whose results were found to agree to within 0.05 ppm. Its final value is expressed in terms of the free proton resonance frequency and is given by (0.2 ppm). Table 1 lists the uncertainties. The improved 2001 uncertainties resulted from refinements in the calibration measurements, and from an upgraded system to determine the azimuthal trolley position in the storage ring.
| Source of uncertainty | Size [ppm] |
|---|---|
| Absolute calibration of standard probe | 0.05 |
| Calibration of trolley probe | 0.09 |
| Trolley measurements of | 0.05 |
| Interpolation with fixed probes | 0.07 |
| Uncertainty from muon distribution | 0.03 |
| Others† | 0.10 |
| Total systematic error on | 0.17 |
† higher multipoles, trolley temperature and voltage response, eddy currents from the kickers, and time-varying stray fields.
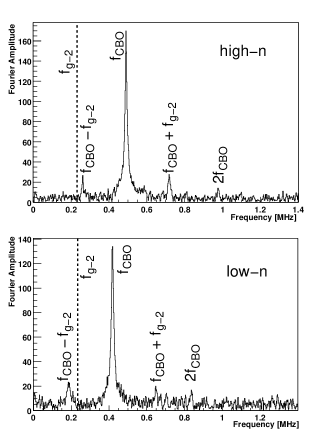
The 2001 data taking was similar to that in 2000. However, the hardware energy threshold of the detectors was kept lower and equal for all counters at 0.9 GeV compared to 1.0-1.4 GeV in 2000. This was made possible by reducing the intensity of the injected beam, which in turn reduced the light flash in the detectors muplus ; g2_2000 . These factors allowed all the detectors to be turned on and be stable by 32 s after beam injection, as opposed to 50 s in 2000. As a result of the reduced rates, the fraction of overlapping signals (pileup) after 32 s in 2001 was comparable to the pileup fraction after 50 s in 2000. In 2000 the field focusing index , which is proportional to the electric field gradient, was , corresponding to a horizontal coherent betatron oscillation frequency (CBO) of 466 kHz g2_2000 . This frequency was close to twice the frequency of 229 kHz, which resulted in a sizable uncertainty in the fitted value g2_2000 . In 2001 we used two different -values, and , which resulted in CBO frequencies, 419 kHz and 491 kHz that are further from twice the frequency (see Figure 2). Consequently, the uncertainty caused by CBO is smaller. Furthermore it also reduced the correlation between the CBO and detector gain effects in the fits to the time spectrum.
Two independent implementations of the algorithm to reconstruct the electron times and energies from the calorimeter signals were used. The frequency was determined by fitting the time distribution of decay electrons. Five independent analyses were performed in order to probe the systematic uncertainties and, of course, to protect against mistakes. All five results agreed within the expected statistical deviations due to different data selection and weightings. These analyses are described below.
Two of the analyses used slightly different parametrizations muplus ; g2_2000 that included CBO modulations and fitted the combined electron spectrum in the energy range 1.8-3.4 GeV. In the third analysis, the counts were weighted with the experimentally determined energy-dependent modulation asymmetry, which optimized the statistical power of the data. This method permitted the analyzed energy range to be extended. We used an energy range of 1.5 to 3.4 GeV, which together with the asymmetry weighting resulted in a 10% improvement of the statistical uncertainty. As in the first two analyses, the resulting spectrum of weighted counts was fitted to a function that parametrized all known and statistically significant perturbations.
The remaining analyses fit the ratio muplus ; g2_2000 formed by randomly assigning the data to four statistically independent subsets to . The subsets were rejoined in and , where is an estimate of the period, and then combined to form the time spectrum . The rate modulation of is 180∘ degrees out of phase compared to that of , and to sufficient precision can be described by . The ratio is largely insensitive to changes of observed counts on time scales larger than .
In one of the ratio analyses, the sensitivity to CBO was reduced by combining the data from both -values and all detectors prior to fitting. The data were fitted from 32 s after injection when all detectors were on. In the second ratio analysis the data were fitted separately for each calorimeter and value. The fits began between 24 s and 32 s, and required the parametrization of the CBO effects in the fit function.
Changes in the radial and vertical muon distributions with time were quantified, and were found to have negligible effect on . A small reduction in the pulsed electrostatic quadrupole voltages quads during the measurement period could change the vertical muon distribution. Analysis of the data from scintillator counter hodoscopes placed in front of the calorimeters combined with a beam tracking calculation and a GEANT based simulation set a systematic error limit of 0.03 ppm. The muon radial distribution is determined by the magnetic field and the momentum distribution muplus ; yuri . The magnetic field does not change with time after injection, except due to the field from eddy currents induced by the fast kicker kicker . This was measured, and found to have a negligible effect on the muon radial distribution. Muons of lower momenta decay earlier in the laboratory frame than muons of higher momenta. The momentum distribution of the stored beam thus changes during the measurement period. The effect on due to this change was studied in simulation, and was found to be 0.03 ppm.
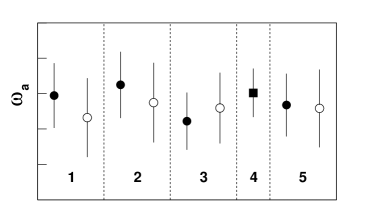
The results for for the two -values are consistent, see Figure 3, and were combined for each of the analyses. The values for from the five analyses are in agreement to within variations expected from the differences in the analyzed event samples and the treatment of the data. The analysis techniques are expected to have somewhat different sensitivities to different systematic effects. Detailed comparisons of the results, using all analyzed data as well as only the data in overlap, showed no evidence for unaccounted systematic differences. The five resulting values for were combined in a simple arithmetic mean to obtain a single value for .
The resulting frequency value is (0.7 ppm), which includes a correction of ppm for contributions to Eq. 1 caused by vertical oscillations (0.30 ppm) and for the effect of the horizontal electric fields on muons with (0.47 ppm). The stated uncertainties account for strong correlations among the individual results, both statistical and systematic. Table 2 lists the systematic uncertainties in the combined result with these correlations taken into account.
| Source of errors | Size [ppm] |
|---|---|
| Coherent betatron oscillations | 0.07 |
| Pileup | 0.08 |
| Gain changes | 0.12 |
| Lost muons | 0.09 |
| Others† | 0.11 |
| Total systematic error on | 0.21 |
† AGS background, timing shifts, E field and vertical oscillations, beam debunching/randomization, binning and fitting procedure.
After the and analyses were finalized separately and independently, was evaluated. The result is
| (3) |
where and liu . This new result is in good agreement with the average of muplus as predicted by the CPT theorem. The difference . The new average is and
| (4) |
in which the total uncertainty consists of (0.4 ppm) statistical uncertainty and (0.3 ppm) systematic uncertainty. The correlation of systematic uncertainties between the data sets has been taken into account. The combined result for the positive muon g2_2000 , (0.7 ppm) has a statistical uncertainty of (0.6 ppm) and a systematic uncertainty of (0.4 ppm). It is shown in Figure 4 together with the new result for the negative muon and their average.
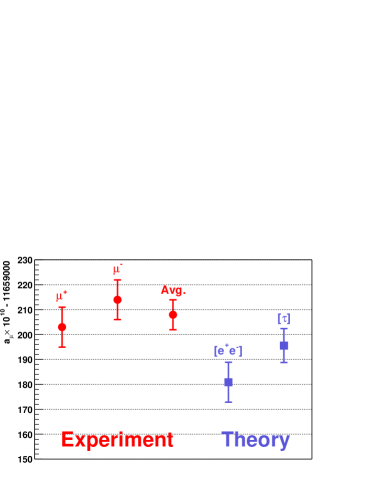
The standard model prediction for consists of QED, hadronic and weak contributions. The uncertainty on the standard model value is dominated by the uncertainty on the lowest-order hadronic vacuum polarization. This contribution can be determined directly from the annihilation of to hadrons through a dispersion integral disp . The indirect determination using data from hadronic decays, the conserved vector current hypothesis, plus the appropriate isospin corrections, could in principle improve the precision of . However, discrepancies between the and the results exist dehz03 ; jeg . The two data sets do not give consistent results for the pion form factor. Using annihilation data the corresponding theoretical value is . The value deduced from decay is larger by and has a stated uncertainty of . The difference between the experimental determination of and the standard model theory using the or data for the calculation of the hadronic vacuum polarization is 2.7 and 1.4 , respectively.
This is the final analysis of the anomalous magnetic moment from experiment E821 at the Brookhaven Alternating Gradient Synchrotron. We aim to substantially improve our result in a new measurement and look forward to continued efforts to improve the theoretical evaluation.
We thank T. Kirk, D.I. Lowenstein, P. Pile, and the staff of the BNL AGS for the strong support they have given this experiment. This work was supported in part by the U.S. Department of Energy, the U.S. National Science Foundation, the U.S. National Computational Science Alliance, the German Bundesminister für Bildung und Forschung, the Russian Ministry of Science, and the U.S.-Japan Agreement in High Energy Physics.
References
- (1) V.W. Hughes and T. Kinoshita, Comments. Nucl. Part. Phys. 14, 341 (1985).
- (2) H.N. Brown et al., (Muon Collaboration), Phys. Rev. D62, 091101 (2000); H.N. Brown, et al., (Muon Collaboration), Phys. Rev. Lett. 86 2227 (2001).
- (3) G.W. Bennett et al., (Muon Collaboration), Phys. Rev. Lett. 89, 101804 (2002).
- (4) A. Yamamoto et al., Nucl. Instrum. Methods Phys. Res. A491 23 (2002); G.T. Danby et al., Nucl. Instrum. Methods Phys. Res. A 457, 151 (2001); S.I. Redin et al., Nucl. Instrum. Methods Phys. Res. A473, 260 (2001); R. Prigl et al., Nucl. Instrum. Methods Phys. Res. A374 118 (1996).
- (5) X. Fei, V.W. Hughes and R. Prigl, Nucl. Instrum. Methods Phys. Res. A394, 349 (1997).
- (6) J. Ouyang et al., Nucl. Instrum. Methods Phys. Res. A374, 215 (1996); S.A. Sedykh et al., Nucl. Instrum. Methods Phys. Res. A455 346 (2000).
- (7) E. Efstathiadis et al., Nucl. Instrum. Methods Phys. Res. A496, 8 (2003).
- (8) Y.K. Semertzidis et al., Nucl. Instrum. Methods Phys. Res. A503 458 (2003).
- (9) J. Bailey et al., Nucl. Phys. B150, 1 (1979).
- (10) Y. Orlov, C.S. Özben and Y.K. Semertzidis, Nucl. Instrum. Meth. A482, 767 (2002).
- (11) W. Liu et al., Phys. Rev. Lett. 82, 711 (1999), and K. Hagiwara et al., (Particle Data Group) Phys. Rev. D66, 010001 (2002).
- (12) B.E. Lautrup, A. Peterman and E. de Rafael, Phys. Rep. C 3, 193 (1972).
- (13) M. Davier, S. Eidelman, A. Höcker, Z. Zhang Aug 2003, Eur. Phys. J. C 31, 503 (2003).
- (14) S. Ghozzi and F. Jegerlehner, hep-ph/0310181, Phys. Lett. B, in Press, (2004).