e-mail: anders@astro.lu.se
2 Earth-Life Science Institute (ELSI), Tokyo Institute of Technology, Meguro, Tokyo, 152-8550, Japan
How planetary growth outperforms migration
Planetary migration is a major challenge for planet formation theories. The speed of Type I migration is proportional to the mass of a protoplanet, while the final decade of growth of a pebble-accreting planetary core takes place at a rate that scales with the mass to the two-thirds power. This results in planetary growth tracks (i.e., the evolution of a protoplanet’s mass versus its distance from the star) that become increasingly horizontal (migration-dominated) with rising mass of the protoplanet. It has been shown recently that the migration torque on a protoplanet is reduced proportional to the relative height of the gas gap carved by the growing planet. Here we show from 1-D simulations of planet-disc interaction that the mass at which a planet carves a 50% gap is approximately 2.3 times the pebble isolation mass. Our measurements of the pebble isolation mass from 1-D simulations match published 3-D results relatively well, except at very low viscosities () where the 3-D pebble isolation mass is significantly higher, possibly due to gap edge instabilities that are not captured in 1-D. The pebble isolation mass demarks the transition from pebble accretion to gas accretion. Gas accretion to form gas-giant planets therefore takes place over a few astronomical units of migration after reaching first the pebble isolation mass and, shortly after, the 50% gap mass. Our results demonstrate how planetary growth can outperform migration, both during core accretion and during gas accretion, even when the Stokes number of the pebbles is small, , and the pebble-to-gas flux ratio in the protoplanetary disc is in the nominal range of –. We find that planetary growth is very rapid in the first million years of the protoplanetary disc and that the probability for forming gas-giant planets increases with the initial size of the protoplanetary disc and with decreasing turbulent diffusion.
Key Words.:
planet-disk interactions, planets and satellites: formation, planets and satellites: gaseous planetsA. Johansen ()
1 Introduction
The formation of planets involves many distinct steps in the growth from dust and ice particles to full planetary system (a realisation that was pioneered 50 years ago by Safronov, 1969). The competition between radial migration and growth is nevertheless a general theme in planet formation. The formation of planetesimals, for example, has to overcome the radial drift caused by the head-wind of the slower moving gas on the growing particles (Weidenschilling, 1977; Brauer et al., 2008). Trapping pebbles in pressure bumps formed in the turbulent gas flow (Lyra et al., 2008; Johansen et al., 2009a; Bai, 2015) or by embedded planets (Lyra et al., 2009) or through run-away pile-ups caused by the friction on the gas (Youdin & Goodman, 2005; Johansen et al., 2009b; Bai & Stone, 2010; Gonzalez et al., 2017; Dra̧żkowska et al., 2016) provide possible solutions to the radial drift problem of planetesimal formation.
Planetary migration results from the gravitational torque exerted on a protoplanet by the spiral density wakes excited in the gaseous protoplanetary disc (Lin & Papaloizou, 1979; Goldreich & Tremaine, 1980; Tanaka et al., 2002). The nominal Type I migration rate reaches approximately 1 m/s (about 100 AU/Myr) for a 10-Earth-mass protoplanet embedded in a young, massive protoplanetary disc. The solutions proposed to mitigate catastrophic Type I migration include slowing down or even reversing the migration where the temperature gradient is steep in the inner regions of the protoplanetary disc (Paardekooper et al., 2010; Lyra et al., 2010; Bitsch et al., 2014; Brasser et al., 2017), or by a positive corotation torque resulting from the accretion heat of the protoplanet (Benítez-Llambay et al., 2015) or from the scattering of (large) pebbles (Benítez-Llambay & Pessah, 2018). Migration can even stall entirely if the turbulent viscosity is too weak to diffuse away the gas density enhancement that forms interior of the planetary orbit (Rafikov, 2002; Li et al., 2009; Fung & Lee, 2018).
A more direct way to overcome Type I migration is simply for the planetary core to increase its mass very rapidly. The accretion rate of pebbles is potentially high enough for the protoplanet growth to outperform the nominal rate of Type I migration (Lambrechts & Johansen, 2014; Ormel et al., 2017; Johansen & Lambrechts, 2017). Bitsch et al. (2015b) demonstrated that protoplanets forming several tens of AU from the host star have enough space to grow to gas-giant planets while they migrate into 5–10 AU orbits111Matsumura et al. (2017), on the other hand, started the seeds in the 5–10 AU region and showed how this leads mainly to the formation of warm and hot Jupiters. However, Brügger et al. (2018) found that the pebble flux rate in the model of Bitsch et al. (2015b) was artificially high and that nominal pebble fluxes ( relative to the gas flux) do not yield high enough core growth rates to compete with migration, unless the metallicity is enhanced significantly beyond the solar value. Bitsch et al. (2018a) argued instead that the pebble sizes and surface densities of Bitsch et al. (2015b) in fact correspond well to observations of protoplanetary discs. However, although the protoplanetary disc model advocated in Bitsch et al. (2018a) is motivated observationally, the pebble sizes and surface densities used in that work are not anchored in self-consistent theoretical models of pebble growth and drift.
In this paper we develop pebble accretion models with small pebbles of Stokes number (approximately mm-sized in the planet formation region), much smaller than those considered in Bitsch et al. (2015b) and Brügger et al. (2018). Such small pebbles follow the viscous accretion flow of the gas and, in contrast to larger pebbles, their column density is not notably reduced by radial drift (Lambrechts & Johansen, 2014). We demonstrate how in this model planetary formation outperforms migration for nominal pebble fluxes and metallicities. We derive analytical expressions that describe the growth tracks of solid protoplanets undergoing pebble accretion (Section 2). We find that planetary cores do undergo substantial migration before reaching the pebble isolation mass. However, using novel prescriptions for the migration rate of gap-opening planets (Kanagawa et al., 2018), we show that gas accretion to form gas-giant planets takes place over just a few astronomical units of migration (Section 3). Hence the main migration phase of a protoplanet happens during the accumulation of the core. We summarise our results and discuss the implications for planet formation in Section 4. In Appendix A we discuss the survival of pebbles in protoplanetary discs and in Appendix B we derive approximate times associated with the analytical growth tracks from Section 2. Our paper forms a companion paper to Ida et al. (2018), which focuses on the effect of the Kanagawa et al. (2018) migration rate on the gas accretion stage.
2 Analytical pebble accretion growth tracks
In this section we derive analytical expressions for the growth track of a protoplanet growing by pebble accretion. We then use this expression to derive the location where the growth track crosses the pebble isolation mass.
2.1 Pebble accretion
To derive the analytical shape of the growth track of a solid protoplanet, we use the protoplanet growth rate from pebble accretion in the 2-D Hill regime (Ormel & Klahr, 2010; Lambrechts & Johansen, 2012; Ida et al., 2016),
| (1) |
Here is the mass of the protoplanet, is the Stokes number of the pebbles (defined later in equation 16), is the Keplerian frequency at the location of the protoplanet, is the friction time of the pebble (proportional to the particle size when pebbles are small), is the Hill radius of the protoplanet, is the mass of the central star, is the radial location of the planet and is the pebble surface density. Significant effort is currently being put into understanding how pebble accretion depends on the eccentricity and inclination of the protoplanet (Johansen et al., 2015; Liu & Ormel, 2018) as well as on realistic hydrodynamical flow in the Hill sphere (Popovas et al., 2018), but we consider here the relatively simpler case of a protoplanet on a circular orbit and the gas flow as pure shear.
Our assumption of 2-D Hill accretion is valid when the pebble accretion radius, , is larger than the scale-height of the pebble layer, (see Morbidelli et al., 2015, for a discussion). Here is the scale-height of the gas and is the dimensionless dust diffusion coefficient (defined in Johansen et al., 2014). That gives an accretion radius relative to the pebble scale-height as
| (2) |
We normalised here to and . Our choice of Stokes number is elaborated in Section 2.4, while the choice of a low diffusion coefficient is motivated by observations of dusty protoplanetary discs that show that the dust has settled to a mid-plane layer of width 10% of a gas scale-height (Mulders & Dominik, 2012; Menu et al., 2014; Pinte et al., 2016). Note that indeed yields a moderately sedimented pebble mid-plane layer with a scale-height relative to the gas scale-height of .
The transition from the Bondi regime (where the pebble approach speed is set by the sub-Keplerian motion) to the Hill regime (where the pebble approach speed is set by the Keplerian shear) of pebble accretion typically happens at 0.001-0.01 Earth masses (Lambrechts & Johansen, 2012). Protoplanets that accrete either in the Bondi regime or in the 3-D Hill regime thus experience very low migration rates and hence the shape of the growth track is not affected by our choice to start the analytical core growth tracks in the 2-D Hill accretion phase. In Section 3 we include the 3-D branch of Hill accretion in the numerical integrations.
Johansen & Lambrechts (2017) demonstrated that the accretion of planetesimals contributes significantly to the growth from planetesimal sizes to protoplanets with masses , due to the low rates of pebble accretion in the Bondi regime, while pebble accretion in the Hill regime dominates the further growth. Therefore we start our protoplanets at and ignore the contribution of planetesimal accretion to the core growth rate, although the inclusion of planetesimal accretion could give a boost to the accretion rate, depending on the migration speed of the protoplanet (Tanaka & Ida, 1999).
2.2 Type I migration
For Type I migration we use the standard scaling law,
| (3) |
Here is the migration speed of the protoplanet, is a constant prefactor that depends on the gradients of surface density and temperature, is the mass of the central star, is the gas surface density, is the disc aspect ratio and is the Keplerian speed at the position of the planet. For the prefactor we follow here a fit to 3-D numerical simulations found in D’Angelo & Lubow (2010),
| (4) |
where and are the negative logarithmic derivatives of the surface density and the temperature profiles, respectively. However, we explicitly maintain in our equations, since the prefactor depends on the physical effects that are included in the simulations (e.g. Tanaka et al., 2002; Paardekooper et al., 2010).
2.3 Radial mass fluxes of gas and pebbles
The gas sound speed and the derived gas scale-height enter both the calculation of the planetary migration migration rate as well as expressions for the radial speed of the gas and pebbles that we present below. We assume that the sound speed profile follows a power law
| (5) |
Here is the negative power-law index of the temperature (proportional to ) and is the sound speed at 1 AU. The disc aspect ratio then follows the power-law
| (6) |
The turbulent viscosity sets the radial gas accretion speed. We use here the -disc assumption for the turbulent viscosity (e.g. Pringle, 1981),
| (7) |
This now results in the gas accretion speed
| (8) |
This expression for the accretion speed is specific to the -disc assumption and would not be valid if the angular momentum loss was transported instead by disc winds (Bai & Stone, 2013). However, since the radial mass accretion rate of the gas depends only on the speed of the gas, and not on the nature of the angular momentum transport, we can consider in equation (8) simply a dimensionless measure of the radial accretion speed.
The radial drift of the particles is given by (Weidenschilling, 1977)
| (9) |
In the limit , valid for pebbles smaller than approximately 0.1-1 meters in size outside of a few AU (Johansen et al., 2014), this expression simplifies to
| (10) |
Here the sub-Keplerian speed , which is a measure of the radial pressure support of the gas, is given by
| (11) |
We denote the negative logarithmic pressure gradient in the mid-plane as . The inwards mass fluxes of gas and pebbles, respectively, are given by
| (12) | |||||
| (13) |
The ratio of the surface densities of pebbles to gas is then
| (14) |
Here we defined the ratio of the fluxes as in Ida et al. (2016),
| (15) |
We will show below in Sections 2.5 and 2.6 that is a key parameter that determines the shape of a protoplanet’s growth track and the total migration distance of the protoplanet before reaching the pebble isolation mass. The gas and solid components of the protoplanetary disc will accrete towards the star at the same time-scale when , where represents the metallicity of the protoplanetary disc. This nominal value of is obtained when the radial drift of the pebbles is dominated by advection with the accreting gas, corresponding to in equation (14). Therefore also the local metallicity will keep its original value for the nominal pebbles-to-gas flux ratio.
Large pebbles with in equation (14) experience an increase in proportional to and hence the local metallicity is maintained at its global value . An increased Stokes number will nevertheless have an overall positive effect on the pebble accretion rate (through equation 1), but such large pebbles are lost to radial drift on a shorter time-scale than the gas accretion. This is the well-known radial drift problem of protoplanetary discs (Brauer et al., 2007). Another possibility is that is dictated by the production rate of pebbles in the outer regions of the protoplanetary disc (Lambrechts & Johansen, 2014; Bitsch et al., 2015b). In that case is no longer directly coupled to in equation (14) and the local metallicity falls proportional to the inverse Stokes number when . Overall, there are then many advantages to considering small pebbles for pebble accretion models, in contrast to the large pebbles that were used in the models of Bitsch et al. (2015b) and Brügger et al. (2018).
2.4 Pebble sizes
Dust in protoplanetary discs grows to pebbles through coagulation (Brauer et al., 2007; Zsom et al., 2010). If particles stick perfectly when they collide, then growth continues until the radial drift time-scale becomes comparable to the growth time-scale, at Stokes numbers around 0.1–1 in the region of giant planet formation (Birnstiel et al., 2012; Lambrechts & Johansen, 2014). Pebble accretion with such drift-limited pebble growth was explored in Bitsch et al. (2015a) and Brügger et al. (2018).
Here we focus instead on a different, and perhaps more realistic, mode of pebble growth where the pebbles experience bouncing or fragmenting collisions. Zsom et al. (2010) showed that the growth of silicate particles is limited to millimeter sizes by bouncing, based on extensive experimental data on collisions between silicate dust aggregates. Such experiments also show that collisions become fragmenting when the collision speed crosses a threshold value (Birnstiel et al., 2012).
Water ice, in contrast to silicates, has higher surface energy and is thus expected to experience growth beyond the bouncing barrier (Okuzumi et al., 2012), while CO2 ice (and likely CO ice as well) appears to have sticking properties similar to silicates (Musiolik et al., 2016a, b). The CO2 ice line sits at a temperature of approximately 70 K at solar abundances, corresponding to the 2–4 AU region in the late stages of protoplanetary disc evolution (Bitsch et al., 2015a; Madhusudhan et al., 2017). Hence, we expect that the growth of pebbles is limited by bouncing or fragmentation in the accretion region of the cores of cold gas giants. Ices of CO and CO2 may, in turn, under UV irradiation form longer refractory organic molecules (Muñoz Caro & Schutte, 2003). We ignore here the possibility that such organic molecules could be sticky and facilitate the formation of pebbles larger than millimeters in size (Lodders, 2004).
Both pebble accretion (in the Hill regime) and radial drift depend on the Stokes number of the pebbles rather than on their physical sizes. The pebble Stokes number is calculated from the radius and material density of the pebbles through the relation
| (16) |
This yields the pebble size for a given value of as
| (17) | |||||
In Section 3 we adopt a nominal protoplanetary disc evolution model where the gas accretion rate drops from to over three million years (Hartmann et al., 2016). This gives a typical pebble size of mm-cm in the 5–20 AU region, for , which corresponds well to the sizes of pebbles whose growth is stuck at the bouncing barrier (Zsom et al., 2010; Birnstiel et al., 2012).
The fragmentation barrier is reached when the collision speed driven by the turbulent gas motion, (Ormel & Cuzzi, 2007), equals an assumed fragmentation speed, (Birnstiel et al., 2012). Here is the turbulent viscosity; we discuss its value and connection to the global disc accretion coefficient in Section 2.6. The turbulent collision speed results in a limiting Stokes number
| (18) | |||||
The fragmentation barrier thus lies at a Stokes number that is (a) independent of the temporally decaying mass accretion rate onto the star and (b) only weakly dependent on the distance from the star.
The small pebbles stuck at the bouncing or fragmentation barrier have radial speeds that are approximately the same as the radial gas accretion speed. This results in a pebble-to-gas flux ratio , where is the overall metallicity of the protoplanetary disc, and hence a similar depletion time of the gaseous and solid components of the protoplanetary disc. We will therefore, for simplicity, consider in our models, as this choice agrees both with the bouncing and fragmentation barriers and with observations that show that pebbles of mm-cm sizes remain present in protoplanetary discs over a wide range of ages (Pérez et al., 2012; Huang et al., 2018). We discuss the life-time of the pebble component of protoplanetary discs more in Appendix A.
Choosing a larger value of would correspond to larger pebbles, more in agreement with pebble growth limited only by the radial drift (Birnstiel et al., 2012; Lambrechts & Johansen, 2014). Such large pebbles would lead to high pebble accretion rates, but would drain out of the protoplanetary disc on a shorter time-scale than the gas accretion time-scale (Lin et al., 2018, our Appendix A), adding significant complication in modelling the divergent evolution of gas and pebbles.
2.5 Analytical core growth track
Using equation (1) for the core growth rate and equation (3) for the migration rate, we can now formulate the differential equation for the growth track ,
| (19) | |||||
The solution is found by separation of variables,
| (20) | |||||
Here and are the starting mass and starting location of the protoplanet, respectively. We can now divide the equation by its solution at , , to obtain
| (21) |
The “maximum mass” reached at for is given by
| (22) | |||||
For , the aspect ratio increases when approaching the star (equation 6) and migration is stalled by the high temperature in the inner regions of the protoplanetary disc. The protoplanet therefore never reaches in that case. We can reformulate equation (22) as a scaling law for in the limit ,
| (23) | |||||
We see here how , which sets the pebble accretion rate, and , which sets the migration rate, pull the maximum mass in opposite directions at an exactly equal power index. Any reduction in the pebble accretion rate, e.g. from 3-D accretion if the pebble scale-height is larger than 10% of the gas scale-height in equation (2), will act in similar way as a reduction in to reduce . We assumed in the derivations above that is a constant. This assumption may break down in the inner, viscously heated regions of the protoplanetary disc (typically interior of 1 AU for nominal accretion rates and disc masses) where the positive corotation torque can slow down or reverse migration (Bitsch & Johansen, 2016; Brasser et al., 2017). We note also that the weak scaling with in equation (23) does not take into account that depends on the luminosity, and hence on the mass, of the star222Assuming that the luminosity of the host star has a power-law dependence on the stellar mass, , yields a temperature at 1 AU that scales as (Ida et al., 2016) and hence . That gives a combined mass-dependence of equation (23) as , which is close to linear for .
We finally obtain the shape of the growth track, , from equation (21),
| (24) |
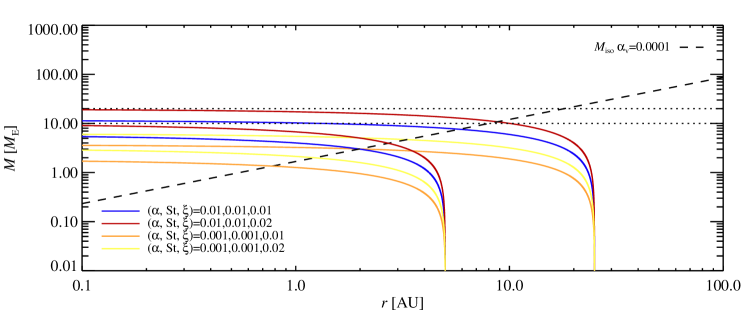
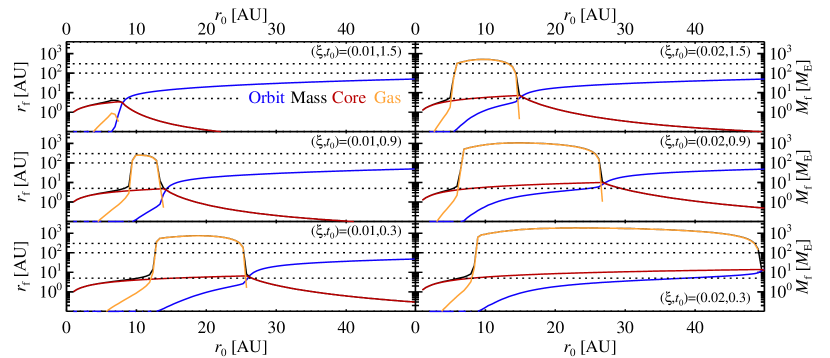
In Appendix B we use this expression to derive the time associated with each step in the growth track. We show analytical growth tracks in Figure 1, for pairs of values of and . We use a disc temperature profile here with and , appropriate for the outer regions of the protoplanetary disc where viscous heating is negligible (Chiang & Youdin, 2010; Bitsch et al., 2015a; Ida et al., 2016). The growth tracks start off nearly vertical (growth dominates over migration), but as the migration rate increases, eventually the growth tracks turn horizontal and reach after migrating to . Type I migration is truly a tough opponent for the planetary core to overcome.
2.6 Pebble isolation mass
The core growth stage ends as the planetary core reaches the pebble isolation mass. Here the protoplanet’s gravity perturbs the gas flow enough to form a plateau of Keplerian motion on the exterior side of the orbit, trapping the migrating pebbles there. The lack of heating by infalling pebbles then allows the gas to decrease its entropy by radiative heat loss and contract slowly to accrete a growing envelope around the core (Lambrechts et al., 2014). In Bitsch et al. (2018b) the pebble isolation mass was fitted to 3-D simulations by the expression
| (25) | |||||
Here is a constant and is the turbulent viscosity, which we distinguish in this paper from the -value of the mass accretion rate of equation (7), as the latter may be driven by disc winds at a weak level of actual turbulence (Bai & Stone, 2013; Béthune et al., 2017). Dürmann & Kley (2015) showed that the gas flow through the protoplanetary disc achieves a constant rate through a planetary gap and that the migration rate is not dependent on the global gas flow. We therefore here assume that the global gas speed also does not affect gap formation and use a nominal value of to calculate the pebble isolation mass in equation (25) (see Armitage et al., 2013; Hasegawa et al., 2017, for a discussion of this distinction). We motivate our usage of in defining the pebble isolation mass by noting that the gas speed driven by the turbulent viscosity over the length-scale of the gap, assumed to be the gas scale-height , is
| (26) |
where is the global gas accretion speed. Hence turbulent viscosity is expected to be a factor times more effective than the global gas accretion speed at counteracting gap formation. However, we emphasize that Dürmann & Kley (2015) did not distinguish between the measuring disc accretion and the measuring turbulent viscosity. Future studies are needed to assess the effect of the global gas accretion speed, here parameterised through , on gap formation and pebble isolation mass.
The isolation mass for the nominal value of is overplotted in Figure 1. The pebble isolation mass is increased over the expression given in equation (25) for small pebbles or strong particle turbulence (Bitsch et al., 2018b; Ataiee et al., 2018); we ignore such effects here since we work in the limit of weak turbulence and since even small pebbles of are easily trapped at the outer edge of the gap.
2.7 Reaching the pebble isolation mass
One can derive analytically the location where the protoplanet growth track crosses the pebble isolation mass. The pebble isolation mass changes as decreases from its initial . Scaling equation (25) from the starting position of the growth track, , we obtain the expression
| (27) |
Here is the isolation mass at . In the limit the protoplanet therefore reaches pebble isolation mass at when
| (28) |
This equation forms a second order polynomial,
| (29) |
with or . The positive solution to the polynomial is
| (30) |
where . Note that a solution exists for all , i.e. the pebble isolation mass is reached for all starting positions . That is due to the steeply falling pebble isolation mass with decreasing distance, in the passively irradiated case. Our results generally do not apply to the viscously heated interior regions of the protoplanetary disc where increases and the aspect ratio becomes relatively constant (Bitsch et al., 2015a; Ida et al., 2016; Brasser et al., 2017).
In the limit , corresponding to through equation (28), equation (30) has the limiting solution
| (31) |
and hence the isolation mass is reached at radius
| (32) |
We can furthermore make use of and to infer . That gives now the simple relation
| (33) |
The length over which the protoplanet migrates before reaching pebble isolation mass is therefore a steeply increasing function of the starting position. In the same limit () the reached pebble isolation mass becomes simply , by inserting in equation (28). This simple result arises because the growth track turns nearly horizontal after a significant migration distance and hence the core is close to its maximum mass when it finally reaches pebble isolation mass.
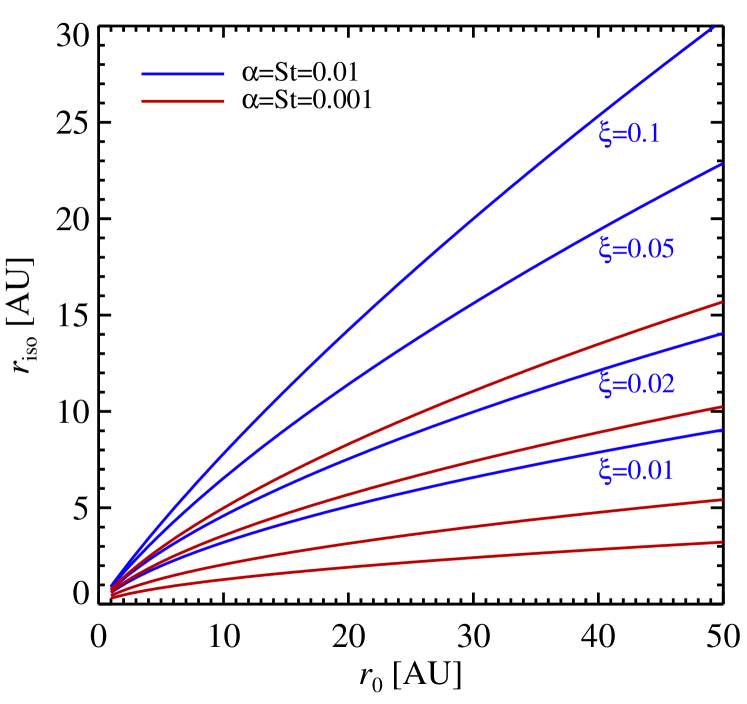
In Figure 2 we plot the calculated distance of reaching isolation mass, , as a function of the starting position, , for different values of and . The distance is obtained from the full solution of equation (29). For a core to reach isolation mass in the 5–10 AU region, the protoplanet must generally start beyond 20 AU, for nominal values of . Nearly in-situ core assembly by pebble accretion requires much higher values of .
3 Growth tracks including gas accretion
We now include the effect of gap formation and gas accretion on planetary growth tracks. We turn to numerical integration, since the reduction of the migration rate and gas accretion rate by gap formation render the governing equations much more complex than in the previous section.
3.1 Type I migration and relative gap height
Kanagawa et al. (2018) performed a suite of 2-D simulations to measure the torque on embedded planets of a wide range of masses. They found that the torque is well-described by the classical Type I torque, which gives rise to the migration rate expression given in equation (3), multiplied by the relative gap height,
| (34) |
Here is the torque prefactor, is the surface density in the gap, is the unperturbed surface density and () is the natural torque scaling. The surface density at the bottom of the gap is fitted well by the expression (Duffell & MacFadyen, 2013; Fung et al., 2014; Kanagawa et al., 2015; Fung & Chiang, 2016)
| (35) |
where
| (36) |
This implies that the migration rate, , falls as above the gap transition mass (defined as the mass for which ). The gap transition mass and the pebble isolation mass are actually closely related concepts. While the gap transition mass measures the mass required to make a relative gap height of 0.5, the pebble isolation mass measures the first appearance of a point of zero pressure gradient at the outside of the planetary gap. The latter criterion is slightly easier to fulfill, as a relative gap height of around 0.85 is sufficient to invert the pressure gradient in the simulations of Bitsch et al. (2018b) (we inferred this relative gap height from their Figure A.1).
To check the robustness of the relative gap height needed for pebble isolation, we performed additional 1-D simulations of an accretion disc with an embedded planet, varying the turbulent viscosity. The torque from the planet was mimicked using the torque profile of D’Angelo & Lubow (2010), based on their 3-D simulations. The simulations were run until the relative gap height reached equilibrium between the gap-opening torque and the viscous momentum transport (, , yr for , , , respectively). The results are shown in Figure 3 and confirm that the pebble isolation mass is reached at a relative gap height of 0.85. We find a general scaling that the gap transition mass, i.e. the mass of 50% relative gap height, is 2.3 times the pebble isolation mass. The measured gap transition mass agrees well with the relative gap height scaling in equations (35) and (36), particularly that the gap transition mass scales with the square root of .
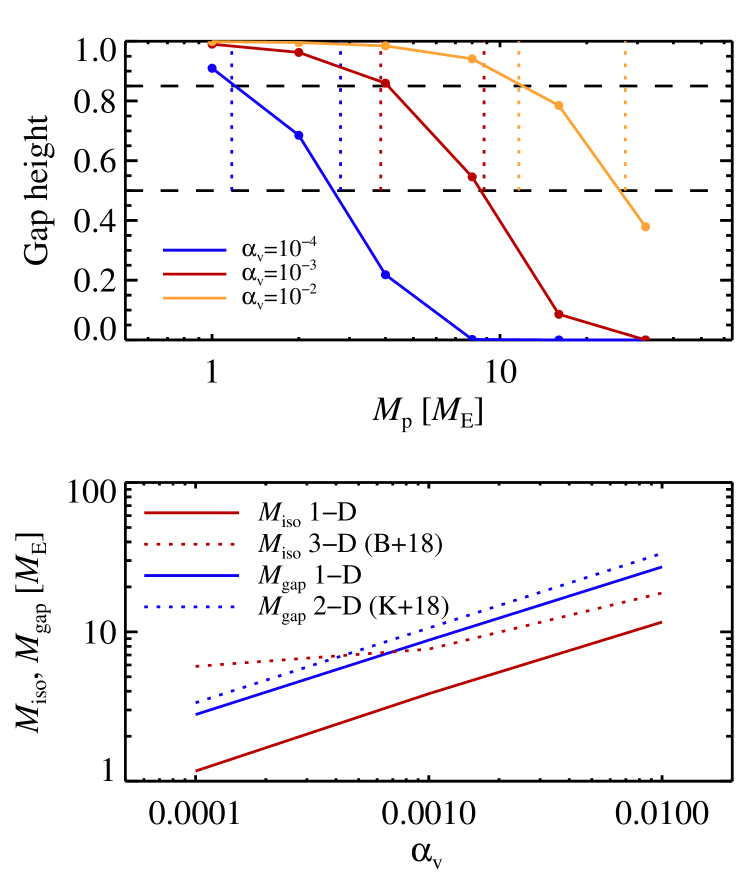
We nevertheless encountered some discrepancy between the -dependence of the pebble isolation mass inferred from our simulations and those of Bitsch et al. (2018b). At high and medium ( and ) our 1-D pebble isolation mass is approximately a factor two lower than the 3-D pebble isolation mass of Bitsch et al. (2018b). It is nevertheless well-known that gaps formed by a 1-D torque prescription become artificially deeper than what is found in 2-D and 3-D simulations (Hallam & Paardekooper, 2017). For low () the pebble isolation mass of by Bitsch et al. (2018b) furthermore showed a weak logarithmic scaling with (equation 25), while our 1-D pebble isolation mass maintains its proportionally to the square root of , similar to the scaling of the gap transition mass with (equations 35 and 36). This difference could be due to (1) Rossby wave instabilities triggered at the gap edge at low in 3-D simulations or (2) that the simulations of Bitsch et al. (2018b) were run only for 1,000 orbital time-scales at the planet position. The 2-D simulations of Ataiee et al. (2018) also show a somewhat weaker dependence of the pebble isolation mass on than the square root dependence that we find in Figure 3. Identifying the actual reason for the discrepancy will require a dedicated study beyond the scope of the current paper. In our nominal model we will therefore set the pebble isolation mass according to Bitsch et al. (2018b) and the gap transition mass to 2.3 times the pebble isolation mass. This yields a modified migration equation
| (37) |
where is the classical Type I migration rate and is the pebble isolation mass given in equation (25). We will also show results in Section 3.8 where we (a) use from the 2-D simulations of Kanagawa et al. (2018) and from the 3-D simulations of Bitsch et al. (2018b) or (b) use from the 2-D simulations and .
Reaching first the pebble isolation mass and shortly after the gap transition mass thus signify three important mile-stones for the growth of a protoplanet: (a) the end of the accretion of pebbles, (b) the beginning of gas contraction and (c) the transition to a slow-down in the migration caused by the deepening gap.
3.2 Gas accretion
The gas accretion rate of a protoplanet embedded in a protoplanetary disc is highly uncertain. Even the term accretion is, in our opinion, slightly misleading, as the mass increase takes place in the form of a contraction of the envelope due to entropy reduction by radiative heat loss. Klahr & Kley (2006) demonstrated that the circumplanetary disc formed in some isothermal simulations is replaced by a hot, hydrostatic gas blob in simulations including compressive heating and radiative transfer. Ikoma et al. (2000) performed 1-D simulations of the envelope contraction and found run-away contraction where the energy loss, and hence contraction rate, is accelerated at higher envelope masses. D’Angelo & Bodenheimer (2013) presented extensive simulations of the gas contraction onto low-mass cores and found, as in earlier 1-D work, that the contraction is accelerated at higher core mass (the same trend was observed in Lambrechts & Lega, 2017). Lambrechts et al. (2018) measured the gas contraction rate in hydrodynamical simulations with radiative transfer, for planetary cores of up to Jupiter-mass. They found that the accretion rate is orders of magnitude lower than the mass flux passing through the Hill radius, as most of this gas is transported out again on horse-shoe orbits and more complex streamlines.
We use here the gas accretion prescription proposed in Ida et al. (2018), taking into account both the Kelvin-Helmholtz-like contraction of the envelope and the feeding of gas from the protoplanetary disc into the Hill sphere of the protoplanet. The contraction of the gaseous envelope is assumed to commence after the core reaches pebble isolation mass, at a rate motivated by Ikoma et al. (2000),
| (38) |
Here is the opacity of the envelope, which we discuss further below. This accretion rate will become larger than what the protoplanetary disc can supply for high planetary masses. Tanigawa & Tanaka (2016) used isothermal, global simulations to demonstrate that gas enters the Hill sphere at a rate
| (39) | |||||
This equation is derived in the companion paper by Ida et al. (2018) – we note here that the simpler form, , shows that the equation can be decomposed into the full flux into the Hill sphere multiplied by the squared ratio of the Hill radius to the scale-height. The latter reflects an empirical finding that that the protoplanet increases its ability to accrete the gas streamlines that enter the Hill radius as the mass increases (Tanigawa & Tanaka, 2016).
The prefactor in equation (39) can be converted to solar units to compare with the disc accretion rate, . If the planet contracts rapidly enough to absorb the entire gas flow into the Hill radius, then we must therefore limit the accretion rate to the global gas accretion rate (see Lubow & D’Angelo, 2006, for a discussion of this limit). We therefore set the gas accretion rate of the planet equal to
| (40) |
Ikoma et al. (2000) found that the Kelvin-Helmholtz gas accretion rate increases inversely proportionally to the opacity (equation 38). Bitsch & Johansen (2016) calculated an opacity of micron-sized ice particles in the range . For core accretion by pebble accretion, we expect that the accreted gas will be completely pebble-free beyond the pebble isolation mass (Lambrechts et al., 2014). Small dust can nevertheless pass the planet barrier together with the accreted gas, constituting maybe 10% of the total content of solids. That gives a nominal opacity in the range . The opacity could be even lower if the grains in the envelope coagulate and sediment (Mordasini, 2014). We adopt here a standard opacity value of .
3.3 Protoplanetary disc model
The growth rates reported in Ikoma et al. (2000) were measured at a single value of the gas surface density and gas temperature at the outer boundary. Hence the dependence of the accretion rates on the gas surface density and temperature is not known. If the gas contraction is indeed limited by the ability of the envelope to cool, then the outer boundary condition may not matter much (as found by Piso & Youdin, 2014; Lee & Chiang, 2015). This, in turn, implies that mass accretion wins more easily over migration when the gas disc is depleted compared to the primordial value, since the initial gas accretion rate is relatively unaffected by the protoplanetary disc surface density, while the migration rate is proportional to the surface density333The reduced migration rate at low gas column densities is an important component of the model of super-Earth formation in depleted gas discs presented in Lee & Chiang (2016)..
The dependence of the migration rate on the gas surface density, combined with the non-dependence of the Kelvin-Helmholtz contraction rate on the surface density, therefore necessitates a specific disc evolution model to integrate the growth tracks. We adopt here a nominal viscous accretion disc model where evolves from to over 3 Myr (typical for solar-mass stars, see Hartmann et al., 2016). Following Hartmann et al. (1998), the accretion rate onto the star evolves as
| (41) |
where is the power-law index of the turbulent viscosity, , and the characteristic time-scale, , is
| (42) |
Here is the initial characteristic disc size and is the value of the viscosity at that radius. Knowing the temperature power law index results in ( for ). We proceed by choosing to yield the desired starting and ending mass accretion rate over an assumed disc life-time of 3 Myr. In Section 3.7 we present planet formation results for protoplanetary discs with initially smaller sizes and hence a steeper temporal decay of their mass accretion rates.
We take into account in the numerical simulations that the pebble accretion rate is lowered when the pebble scale-height is higher than the pebble accretion radius, following the method described in Johansen et al. (2015). Johansen & Klahr (2005) demonstrated in MHD simulations that the turbulent viscosity and the turbulent diffusion coefficient are approximately equal; we therefore for simplicity assume in our simulations.
3.4 Growth tracks with gas accretion
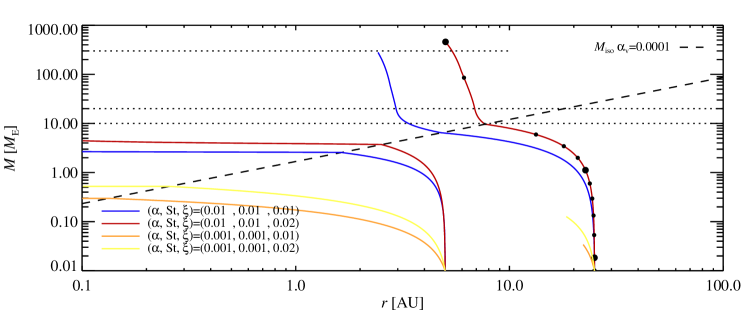
The integration of the growth track bundles from Figure 1 including gas accretion are shown in Figure 4. We start the growth tracks at Myr and integrate until the disc is assumed to dissipate after Myr. To demonstrate the effect of the starting time, we start one growth track (with and starting at ) at . The core growth tracks before reaching pebble isolation mass are relatively unaffected by the slow-down of the migration rate towards the gap transition mass (and follows the analytical solution that we derived in Section 2, even when we include here that the initial pebble accretion is reduced in 3-D). However, after reaching the pebble isolation mass, the two growth tracks starting at 25 AU with turn quickly upwards, as the migration rate falls inversely proportional to the planetary mass. This results in gas accretion length scales that are much shorter than the core accretion length scale. In contrast to this, the growth tracks starting at 5 AU reach an isolation mass of . At those core masses, Kelvin-Helmholtz contraction is very slow, according to equation (38), and these planets migrate towards the star with little success at accreting gas.
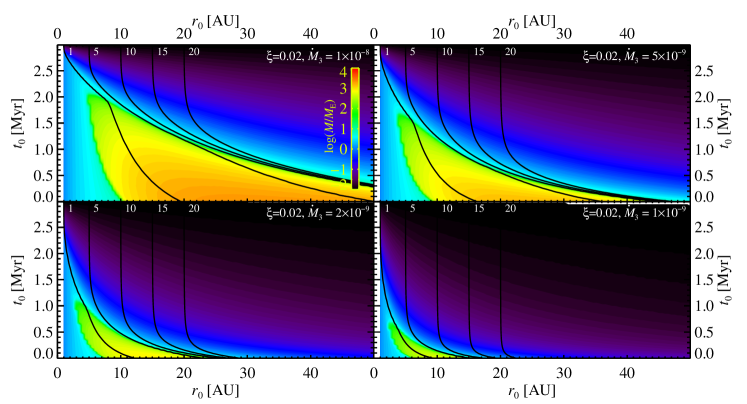
In Figure 5 we show the final positions of protoplanets starting at 1 to 50 AU distance from the star in the protoplanetary disc and starting times between 0 and 3 Myr, for four values of the pebble-to-gas flux ratio . The slow-down of migration in the gas accretion phase allows more space for migration during the core accretion stage, hence we can form gas giants at a lower pebble accretion rate than in Bitsch et al. (2015b). For nominal pebble-to-gas flux ratios of , the cores of cold gas giants with final orbits in the 5–10 AU region (analogues of Jupiter and Saturn in the Solar System) start their assembly much further out, in the 20–30 AU region. Shorter migration distances, with starting locations in the 10–15 AU region, are possible at higher pebble-to-gas flux ratios .
We find generally that our integrations produce much fewer hot and warm gas giants, with final orbits interior to 1 AU, compared to simulations that considered the traditional Type II migration (Bitsch & Johansen, 2016, 2017). This is due to the slow-down of the migration rate with the formation of a deep gap when using the Kanagawa et al. (2018) migration prescription here. Other studies have invoked photoevaporation as an effect to prevent massive planets from migrating all the way to the inner edge of the protoplanetary disc (Alexander & Pascucci, 2012; Ercolano & Rosotti, 2015); here and in Ida et al. (2018) we show that massive planets may be naturally prevented from migrating to the disc edge due to the deep gas gaps that they carve.
The core masses of our synthetic planets are nevertheless smaller than what is inferred for total content of heavy elements in the gas giants in the Solar System. The recent data on the gravitational field of Jupiter by the Juno satellite yield a total amount of heavy elements between and (Wahl et al., 2017). However, we did not include in our simulations the contribution from planetesimal pollution during the gas accretion phase. Shiraishi & Ida (2008) modelled the pollution by late planetesimal infall numerically and found accretion of up to of additional planetesimals, bringing the total amount of heavy elements more in line with observations.
The final orbits and masses for three selected starting times are shown in Figure 6. One sees how the outcome of planet formation can be broadly divided into three categories. Protoplanets starting their growth far from the star experience both little growth and little migration and end as ice planets with masses broadly between 0.1 and 2 (as also found by Bitsch et al., 2015a). As the starting position is reduced, the cores grow towards the pebble isolation mass of . This triggers rapid gas accretion and the formation of Jupiter and Saturn analogues. The total gas mass plateaus at around ; this is an effect of gap formation that limits gas accretion in our gas accretion model that follows Tanigawa & Tanaka (2016). Protoplanets that start closer than approximately 5 AU of the host star have low pebble isolation masses and hence never experience gas accretion. These form analogues of the super-Earths found around many stars (Batalha et al., 2013), although we emphasize here that the mutual dynamics of trains of such migrating super-Earths, not included here, is key to understanding the final orbits and multiplicities of super-Earth-mass migrators (Izidoro et al., 2017; Matsumura et al., 2017). Alternatively, the orbital properties of observed super-Earths has been proposed to be consistent with a lack of planetary migration (Lee & Chiang, 2017). We also ignore here the truncation of the inner disc by the magnetospheric cavity, which may play an important role in reducing or halting migration (Liu et al., 2017). Our model does not readily explain how to stop the accretion of gas at the mass of Saturn or Jupiter, unless we invoke special timing of the dissipation of the gaseous protoplanetary disc. A possible solution to this problem is that the turbulent viscosity, , is even lower than what we have assumed and that both the pebble isolation mass and gap transition mass are lower in real protoplanetary discs. An earlier onset of gap formation would be an efficient way to limit the flow of gas to the protoplanet, through equation (39).
3.5 Formation of ice giants
Forming planets with core masses equivalent to those of Uranus and Neptune in 10-20 AU orbits (as is broadly consistent with the initial condition for the later planetesimal-driven migration of the giant planets Gomes et al., 2005) is possible when a protoplanet starts slightly exterior to those that end up forming gas giants. However, the parameter space for forming ice giants is quite small, since gas accretion is rapid for those core masses. If, on the other hand, the ice giants formed by giant impacts of a higher number of 5-Earth-mass cores, as explored in Izidoro et al. (2015), then the seeds of the ice giants would be allowed to form even further from the Sun and not be in such a high risk of accreting substantial amounts of gas. Also, in our work we do not consider the release of water vapour in the gas envelope. The contraction of an envelope highly enriched in water vapour could explain the relatively small amount of hydrogen in the ice giants of the solar system (Lambrechts et al., 2014; Venturini & Helled, 2017).
3.6 Population synthesis
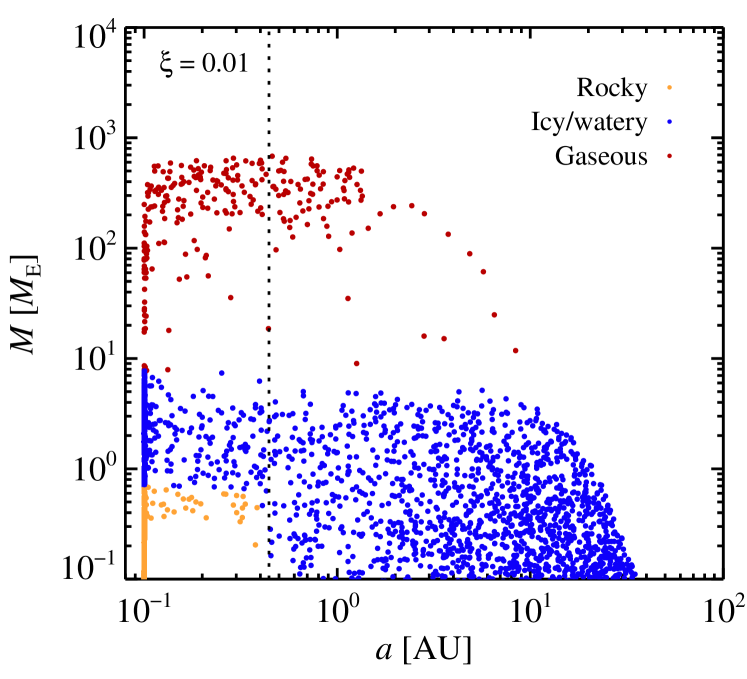
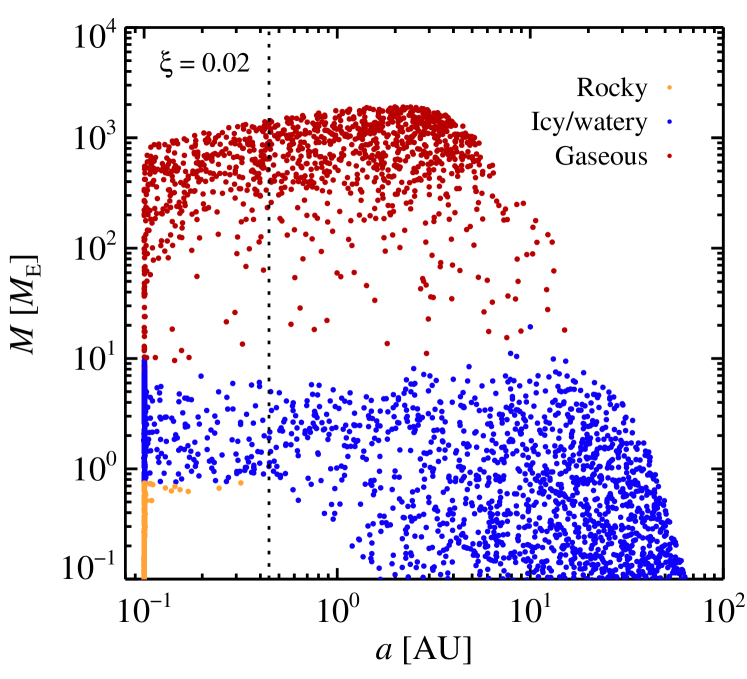
In Figure 7 we illustrate the planetary populations arising from our models by performing a population synthesis operation on the growth maps for and . We have sampled 10,000 random points in each growth map, using a logarithmic distribution of starting points and a linear distribution of starting times. We have also calculated the compositions of the planetary cores, by assuming that half of the mass of the pebbles is in the form of water ice outside of the water ice line. The water ice line is situated at around 0.45 AU in our simulations, due to the fact that we do not include viscous heating. The population synthesis demonstrates a clear dichotomy between those planets that reach the pebble isolation mass and undergo rapid gas accretion and those that stay below the pebble isolation mass. The run-away nature of early gas accretion leaves the region between 10 and 100 Earth masses relatively empty (this is known as the planet desert, see Ida & Lin, 2004).
Our pebble accretion population synthesis plots appear qualitatively similar to those presented in Bitsch & Johansen (2017) and Ndugu et al. (2018). We refer to those two papers for comparisons to the observed exoplanet populations. One notable difference is the relatively fewer gas giants that reach the inner disc edge in our simulations. This is mainly an effect of the new planetary migration prescription that we explore here. Comparing our results to Brügger et al. (2018) (who used a correction to the pebble sizes and fluxes of Bitsch et al., 2015b, resulting in very low pebble fluxes), we find very similar synthetic exoplanet populations, although the small-pebble model that we advocate here requires much lower pebble fluxes (and hence metallicities) to trigger the formation of gas giants in cold orbits. Chambers (2018) presented a comprehensive suite of population synthesis calculations and used the observed exoplanet populations to pin down the best set of model input parameters for the protoplanetary disc and the pebble sizes. He found best fits to the data for low diffusion coefficients (), which can be understood because of the positive effect of lowering the diffusion coefficient in the initial 3-D stage of pebble accretion (we discuss this point further in Section 3.8).
Lin et al. (2018) considered planet formation in an -disc model with an evolving gas and pebble component. They studied a wide range of Stokes numbers and disc viscosities and found that it is mainly possible to form gas-giant planets when . Smaller Stokes numbers maintain the global metallicity, as we also show in equation (14), but protoplanets accreting small pebbles experience a reduced pebble accretion rate both in the 2-D and 3-D Hill accretion branch. Lin et al. (2018) also reported that their synthetic planets either remain sub-Earth mass or “explode” to form gas giants. We recover this result in our own growth maps when considering only protoplanets started at . Looking at the top left panel of Figure 5, we see that seeds starting at in up to 15 AU distances migrate to the inner edge of the disc where they are stuck at a few Earth masses, while the seeds starting between 15 and 35 AU grow to warm and cold gas giants. Seeds starting even further out experience only some minor growth in-situ, due to the long growth time-scales there. In our work we keep the actual time that it takes to form cores of as a free parameter in our growth maps; the actual time that it takes to grow from planetesimals to such protoplanets is largely unknown and may be determined by the interplay between pebble accretion in the inefficient Bondi branch and mutual planetesimal-planetesimal collisions (Johansen & Lambrechts, 2017).
Super-Earths with final orbits within the water ice line in Figure 7 transition from dry to water-rich at a mass of approximately one Earth mass, as more massive migrators accrete a large fraction of their mass outside of the water ice line. This composition appears to be in contrast with the inferred rocky compositions of super-Earths (Owen & Wu, 2017). However, we have neglected in this paper the viscous heating that would increase the disc aspect ratio in the inner regions of protoplanetary discs. An increase in the disc aspect ratio leads to lower migration rates in the inner protoplanetary disc and hence slows down the icy protoplanets that penetrate from beyond the ice line. The outwards migration resulting from such viscous heating will furthermore block the inwards flow of icy protoplanets of a certain mass range (Bitsch & Johansen, 2016) – we plan to include this effect in future studies using our small Stokes number model.
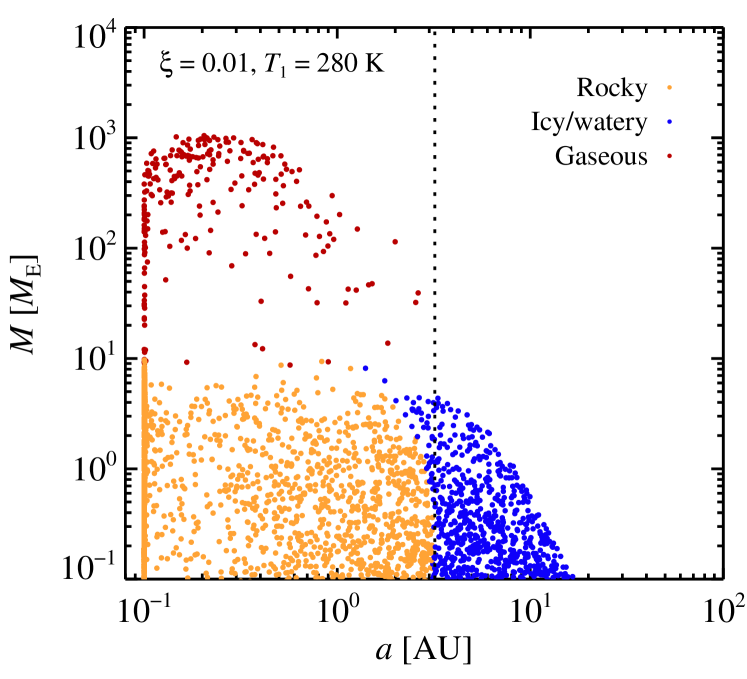
In Figure 8 we show a population synthesis calculation on a model where the temperature at 1 AU is set to the higher value K, corresponding to a sound speed of . This temperature profile corresponds to the Minimum Mass Solar Nebula model of Hayashi (1981). Through equation (23) this increase in sound speed leads to a larger maximum mass, due to the slower migration speed at an increased . The result is that terrestrial planets and super-Earths interior of the water ice line are now mainly rocky. Icy protoplanets formed exterior of the ice line either stay small, if they form late, or grow to gas giants.
3.7 Different temporal accretion profiles
We have so far analysed planet formation in a protoplanetary disc that evolves its accretion rate from to over 3 Myr. Using and our adapted temperature profile, such a temporal evolution implies that the initial disc size was AU and contained a mass of of gas and 400 of solids at a metallicity . These values are similar to what is inferred for the iconic protoplanetary disc around HL Tau (Carrasco-González et al., 2016); such massive discs are common around young Class 0 and Class I objects (Tychoniec et al., 2018). However, surveys of more evolved protoplanetary discs with ages beyond approximately 1 Myr reveal typical dust masses of between 1 and 100 around solar-mass stars (Ansdell et al., 2017). Our nominal model with an accretion rate of at 3 Myr contains 200 of solids at 1 Myr and 30 at 3 Myr, towards the high end of the survey results presented in Ansdell et al. (2017).
The temporal decline of the gas accretion rate in the -disc model is set by the viscous accretion time-scale over the initial disc size (Hartmann et al., 1998). Fixing the global viscosity coefficient at , we find for our temperature profile that protoplanetary discs starting with an accretion rate of and reaching , or after 3 Myr have initial sizes of , respectively. The initial masses of these discs are , respectively.
The resulting growth maps for a fixed pebble-to-gas flux ratio of are shown in Figure 9. Decreasing the initial disc size and mass leads to a significant decrease in the parameter space for forming gas-giant planets. Hence both the initial disc size and the metallicity are important factors in determining whether a protoplanetary disc will be able to form gas-giant planets. Manara et al. (2018) analysed the pebble masses in protoplanetary discs around young stars in the Lupus region, with ages between 1 and 3 Myr, and concluded that these masses are too low to explain the statistics of the observed exoplanet populations. They speculate that protoplanets must grow even earlier in the life-time of the protoplanetary disc while there is still plenty of pebbles to accrete. Our results agree with this picture: planetary growth is very in efficient in the first Myr and will proceed even in protoplanetary discs of initial sizes down to a few tens of AU.
3.8 Varying the model parameters
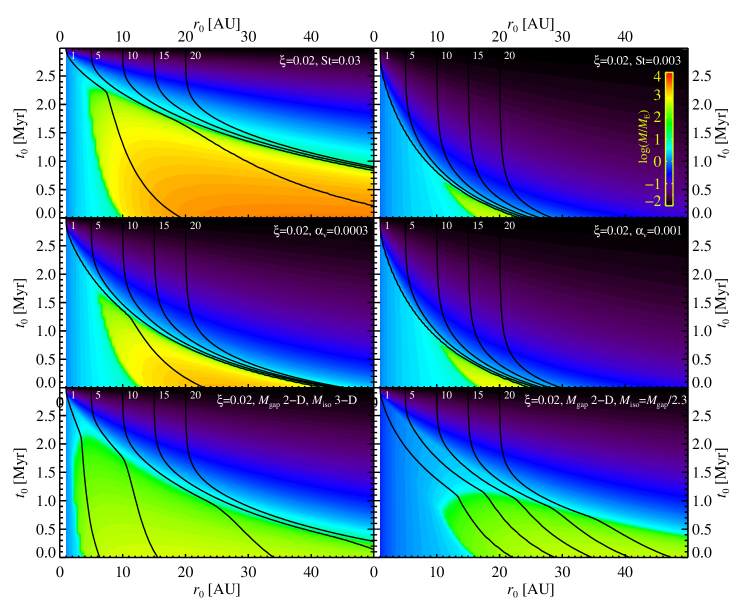
In Figure 10 we show the results of varying the parameters of our model, to probe how sensitive planet formation is to the physical properties of pebble growth, disc turbulence, and gap formation. All growth maps were calculated for , as this pebble-to-gas flux ratio shows a large dependence on the physical parameters and thus makes differences clear.
The top row of Figure 10 shows the result of varying the Stokes number. For larger Stokes number the parameter space for forming gas-giant planets increases relative to the nominal case with . This increase in Stokes number affects the initial 3-D pebble accretion stage most positively, since the accretion rate in the 3-D Hill regime is proportional to the Stokes number. Lowering the Stokes number to , on the other hand, has devastating effect on the ability of the protoplaetary disc to form gas giants. The protoplanets are stuck at 3-D growth below one Earth mass, unless they start very early.
In the middle row of Figure 10 we increase the turbulent viscosity (and the turbulent diffusion coefficient ) to and . Pinte et al. (2016) inferred from measurements of the scale-height of the pebble layer. The translation from particle layer scale height to turbulent diffusion coefficient nevertheless depends on the assumed Stokes number. The high value of (and hence of ) push planet formation to earlier times than for our nominal case of used in Figure 5.
Finally, we show in the bottom row of Figure 10 two additional experiments with gap formation. In the left panel we use the 50% gap mass from Kanagawa et al. (2018) and the pebble isolation mass from the 3-D simulations of Bitsch et al. (2018b). Taking these measurements at face value, it is clear from Figure 3 that the pebble isolation mass is actually higher than the 50% gap mass at ! Since the 50% gap mass is only determined by the relative height of the gap, while the pebble isolation mass is set by both the gap height and shape, it could be that gap edge instabilities would broaden the gap in such a way that the pebble isolation mass comes after the 50% gap mass. The result is a major reduction in planetary migration. The final planetary mass is also reduced; this is a consequence of the reduced migration, since the gas accretion rates are higher in the inner regions of the protoplanetary disc where is low, according to our adopted gas accretion model from Tanigawa & Tanaka (2016). In the right panel we assume instead that the 50% gap mass is given by Kanagawa et al. (2018), while the pebble isolation mass is 2.3 times lower. Hence the pebble isolation mass is now only of the order of one Earth mass, resulting in both reduced gas accretion rates (due to the small core mass) and reduced migration (due to the small gap mass).
4 Summary and discussion
In this paper we have addressed the question of how planetary growth is able to outperform migration. Type I migration likely operates at its full strength in the outer regions of the protoplanetary disc where planetary cores grow to form gas giants and ice giants, in contrast to the viscously heated inner regions of the protoplanetary disc where the positive corotation torques slow down or reverse the migration of super-Earth cores (Bitsch & Johansen, 2016; Brasser et al., 2017).
We derived analytical growth tracks for a protoplanet undergoing pebble accretion while migrating towards the star, under the assumptions that the pebble Stokes number is a constant both in time and in space, that the pebble mid-plane layer is sufficiently thin for pebble accretion to take place in 2-D, and that the mass flux of pebbles is a constant ratio of the radial gas flow. We used these analytical expressions to derive the radial location where the growing core reaches the pebble isolation mass. Our analytical growth tracks demonstrate that protoplanets undergo substantial migration during their growth towards the pebble isolation mass and that the location of reaching the pebble isolation mass increases as the square root of the starting location.
An important new ingredient in our model, compared to previous studies of pebble accretion and migration (Bitsch et al., 2015b; Matsumura et al., 2017), is the reduction of the migration torque due to the growing planetary gap (Kanagawa et al., 2018). We identify here the close connection between the 50% gap mass, , of Kanagawa et al. (2018) and the pebble isolation mass, , of Lambrechts et al. (2014). From numerical simulations of low-mass planets embedded in a 1-D model of a protoplanetary disc, we infer that . Reaching first the pebble isolation mass and slightly later the gap transition mass thus signifies three important events in the growth of a protoplanet: (a) the end of the accretion of pebbles, (b) the beginning of gas contraction and (c) the transition to a slow-down in the migration caused by the deepening gap. Gas accretion can therefore take place over just a few astronomical units of migration. We emphasize that the connection between the 50% gap mass and the pebble isolation mass is derived here from 1-D simulations and that dedicated 2-D and 3-D simulations will be needed in the future to measure whether this simplified relationship holds. At low viscosity () our measured pebble isolation mass is significantly lower than the measurements from 3-D simulations (Bitsch et al., 2018b); this may be either due to gap edge instabilities that are not captured in the 1-D approach (Hallam & Paardekooper, 2017) or due to the limited simulation time that can be afforded in 3-D.
We have demonstrated that protoplanets can grow to gas-giant planets in models where pebbles are relatively small, with a Stokes number of 0.01 corresponding to approximately millimeter-sized particles in the inner regions of the protoplanetary disc, and the pebble-to-gas flux ratio is in the nominal range , in contrast to the models of Bitsch et al. (2015b), Bitsch et al. (2018a) and Brügger et al. (2018) where pebbles were allowed to grow to the radial drift barrier. The radial drift of the small pebbles considered in this work is dominated by the advection with the gas accretion flow – and the gas and pebble components of the protoplanetary disc therefore drain onto the central star on an approximately similar time-scale. This way we avoid the radial drift problem where large pebbles drift out of the protoplanetary disc on a time-scale that is much shorter than the gas accretion time-scale (Brauer et al., 2007).
Our results show that the cores of cold gas giants ending in 5–10 AU orbits must generally start their assembly from planetesimals forming in the 15–30 AU region. This raises the question of why planetesimals forming at such distances would be the seeds of the gas giants. The water ice line has been demonstrated to be a preferred location for the formation of planetesimals (Ros & Johansen, 2013; Ida & Guillot, 2016; Schoonenberg & Ormel, 2017; Dra̧żkowska & Alibert, 2017). If the ice lines of more volatile species, e.g. CO (Qi et al., 2013), are equally prone to forming planetesimals, then this may explain why the cores of the gas-giants in the Solar System started as seeds far away from the Sun and subsequently migrated to their current orbits.
Acknowledgements.
The authors thank the anonymous referee whose report helped us to improve the original manuscript. We would furthermore like to thank Hidekazu Tanaka, Kazuhiro Kanagawa, Bertram Bitsch and Christoph Mordasini for inspiring discussions. AJ is grateful to the Earth-Life Science Institute (ELSI) at Tokyo Institute of Technology for hosting his research visit during March 2018. AJ further thanks the Swedish Research Council (grant 2014-5775), the Knut and Alice Wallenberg Foundation (grants 2012.0150, 2014.0017) and the European Research Council (ERC Consolidator Grant 724687-PLANETESYS) for research support. SI is supported by JSPS grant 15H02065 and MEXT grant 18H05438.References
- Alexander & Pascucci (2012) Alexander, R. D., & Pascucci, I. 2012, MNRAS, 422, L82
- Ansdell et al. (2017) Ansdell, M., Williams, J. P., Manara, C. F., et al. 2017, AJ, 153, 240
- Armitage et al. (2013) Armitage, P. J., Simon, J. B., & Martin, R. G. 2013, ApJ, 778, L14
- Ataiee et al. (2018) Ataiee, S., Baruteau, C., Alibert, Y., & Benz, W. 2018, arXiv:1804.00924
- Bai & Stone (2010) Bai, X.-N., & Stone, J. M. 2010, ApJ, 722, 1437
- Bai & Stone (2013) Bai, X.-N., & Stone, J. M. 2013, ApJ, 769, 76
- Bai (2015) Bai, X.-N. 2015, ApJ, 798, 84
- Batalha et al. (2013) Batalha, N. M., Rowe, J. F., Bryson, S. T., et al. 2013, ApJS, 204, 24
- Benítez-Llambay et al. (2015) Benítez-Llambay, P., Masset, F., Koenigsberger, G., & Szulágyi, J. 2015, Nature, 520, 63
- Benítez-Llambay & Pessah (2018) Benítez-Llambay, P., & Pessah, M. E. 2018, ApJ, 855, L28
- Béthune et al. (2017) Béthune, W., Lesur, G., & Ferreira, J. 2017, A&A, 600, A75
- Birnstiel et al. (2012) Birnstiel, T., Klahr, H., & Ercolano, B. 2012, A&A, 539, A148
- Bitsch et al. (2014) Bitsch, B., Morbidelli, A., Lega, E., Kretke, K., & Crida, A. 2014, A&A, 570, A75
- Bitsch et al. (2015a) Bitsch, B., Johansen, A., Lambrechts, M., & Morbidelli, A. 2015a, A&A, 575, A28
- Bitsch et al. (2015b) Bitsch, B., Lambrechts, M., & Johansen, A. 2015b, A&A, 582, A112
- Bitsch & Johansen (2016) Bitsch, B., & Johansen, A. 2016, A&A, 590, A101
- Bitsch & Johansen (2017) Bitsch, B., & Johansen, A. 2017, Astrophysics and Space Science Library, 445, 339
- Bitsch et al. (2018a) Bitsch, B., Lambrechts, M., & Johansen, A. 2018a, A&A, 609, C2
- Bitsch et al. (2018b) Bitsch, B., Morbidelli, A., Johansen, A., et al. 2018b, A&A, 612, A30
- Brasser et al. (2017) Brasser, R., Bitsch, B., & Matsumura, S. 2017, AJ, 153, 222
- Brauer et al. (2007) Brauer, F., Dullemond, C. P., Johansen, A., et al. 2007, A&A, 469, 1169
- Brauer et al. (2008) Brauer, F., Dullemond, C. P., & Henning, T. 2008, A&A, 480, 859
- Brügger et al. (2018) Brügger, N., Alibert, Y., Ataiee, S., & Benz, W. 2018, A&A, 619, A174
- Carrasco-González et al. (2016) Carrasco-González, C., Henning, T., Chandler, C. J., et al. 2016, ApJ, 821, L16
- Chambers (2018) Chambers, J. 2018, ApJ, 865, 30
- Chiang & Youdin (2010) Chiang, E., & Youdin, A. N. 2010, Annual Review of Earth and Planetary Sciences, 38, 493
- D’Angelo & Lubow (2010) D’Angelo, G., & Lubow, S. H. 2010, ApJ, 724, 730
- D’Angelo & Bodenheimer (2013) D’Angelo, G., & Bodenheimer, P. 2013, ApJ, 778, 77
- Dra̧żkowska et al. (2016) Dra̧żkowska, J., Alibert, Y., & Moore, B. 2016, A&A, 594, A105
- Dra̧żkowska & Alibert (2017) Dra̧żkowska, J., & Alibert, Y. 2017, A&A, 608, A92
- Duffell & MacFadyen (2013) Duffell, P. C., & MacFadyen, A. I. 2013, ApJ, 769, 41
- Dürmann & Kley (2015) Dürmann, C., & Kley, W. 2015, A&A, 574, A52
- Ercolano & Rosotti (2015) Ercolano, B., & Rosotti, G. 2015, MNRAS, 450, 3008
- Fung et al. (2014) Fung, J., Shi, J.-M., & Chiang, E. 2014, ApJ, 782, 88
- Fung & Chiang (2016) Fung, J., & Chiang, E. 2016, ApJ, 832, 105
- Fung & Lee (2018) Fung, J., & Lee, E. J. 2018, ApJ, 859, 126
- Goldreich & Tremaine (1980) Goldreich, P., & Tremaine, S. 1980, ApJ, 241, 425
- Gomes et al. (2005) Gomes, R., Levison, H. F., Tsiganis, K., & Morbidelli, A. 2005, Nature, 435, 466
- Gonzalez et al. (2017) Gonzalez, J.-F., Laibe, G., & Maddison, S. T. 2017, MNRAS, 467, 1984
- Gorti et al. (2015) Gorti, U., Hollenbach, D., & Dullemond, C. P. 2015, ApJ, 804, 29
- Hallam & Paardekooper (2017) Hallam, P. D., & Paardekooper, S.-J. 2017, MNRAS, 469, 3813
- Hartmann et al. (1998) Hartmann, L., Calvet, N., Gullbring, E., & D’Alessio, P. 1998, ApJ, 495, 385
- Hartmann et al. (2016) Hartmann, L., Herczeg, G., & Calvet, N. 2016, ARA&A, 54, 135 ‘
- Hasegawa et al. (2017) Hasegawa, Y., Okuzumi, S., Flock, M., & Turner, N. J. 2017, ApJ, 845, 31
- Hayashi (1981) Hayashi, C. 1981, Progress of Theoretical Physics Supplement, 70, 35
- Huang et al. (2018) Huang, J., Andrews, S. M., Cleeves, L. I., et al. 2018, ApJ, 852, 122
- Ida & Lin (2004) Ida, S., & Lin, D. N. C. 2004, ApJ, 604, 388
- Ida et al. (2016) Ida, S., Guillot, T., & Morbidelli, A. 2016, A&A, 591, A72
- Ida & Guillot (2016) Ida, S., & Guillot, T. 2016, A&A, 596, L3
- Ida et al. (2018) Ida, S., Tanaka, H., Johansen, A., Kanagawa, K., & Tanigawa, T. 2018, ApJ, submitted
- Ikoma et al. (2000) Ikoma, M., Nakazawa, K., & Emori, H. 2000, ApJ, 537, 1013
- Izidoro et al. (2015) Izidoro, A., Morbidelli, A., Raymond, S. N., Hersant, F., & Pierens, A. 2015, A&A, 582, A99
- Izidoro et al. (2017) Izidoro, A., Ogihara, M., Raymond, S. N., et al. 2017, MNRAS, 470, 1750
- Johansen & Klahr (2005) Johansen, A., & Klahr, H. 2005, ApJ, 634, 1353
- Johansen et al. (2009a) Johansen, A., Youdin, A., & Klahr, H. 2009a, ApJ, 697, 1269
- Johansen et al. (2009b) Johansen, A., Youdin, A. N., & Mac Low, M.-M. 2009b, ApJ, 704, L75
- Johansen et al. (2014) Johansen, A., Blum, J., Tanaka, H., et al. 2014, Protostars and Planets VI, 547
- Johansen et al. (2015) Johansen, A., Mac Low, M.-M., Lacerda, P., & Bizzarro, M. 2015, Science Advances, 1, 1500109
- Johansen & Lambrechts (2017) Johansen, A., & Lambrechts, M. 2017, Annual Review of Earth and Planetary Sciences, 45, 359
- Kanagawa et al. (2015) Kanagawa, K. D., Tanaka, H., Muto, T., Tanigawa, T., & Takeuchi, T. 2015, MNRAS, 448, 994
- Kanagawa et al. (2018) Kanagawa, K. D., Tanaka, H., & Szuszkiewicz, E. 2018, arXiv:1805.11101
- Klahr & Kley (2006) Klahr, H., & Kley, W. 2006, A&A, 445, 747
- Lambrechts & Johansen (2012) Lambrechts, M., & Johansen, A. 2012, A&A, 544, A32
- Lambrechts & Johansen (2014) Lambrechts, M., & Johansen, A. 2014, A&A, 572, A107
- Lambrechts et al. (2014) Lambrechts, M., Johansen, A., & Morbidelli, A. 2014, A&A, 572, A35
- Lambrechts & Lega (2017) Lambrechts, M., & Lega, E. 2017, A&A, 606, A146
- Lambrechts et al. (2018) Lambrechts, M., Lega, E., Morbidelli A., & Nelson, R. 2018, in preparation
- Lee & Chiang (2015) Lee, E. J., & Chiang, E. 2015, ApJ, 811, 41
- Lee & Chiang (2016) Lee, E. J., & Chiang, E. 2016, ApJ, 817, 90
- Lee & Chiang (2017) Lee, E. J., & Chiang, E. 2017, ApJ, 842, 40
- Li et al. (2009) Li, H., Lubow, S. H., Li, S., & Lin, D. N. C. 2009, ApJ, 690, L52
- Lin & Papaloizou (1979) Lin, D. N. C., & Papaloizou, J. 1979, MNRAS, 186, 799
- Lin et al. (2018) Lin, J. W., Lee, E. J., & Chiang, E. 2018, MNRAS, 480, 4338
- Liu et al. (2017) Liu, B., Ormel, C. W., & Lin, D. N. C. 2017, A&A, 601, A15
- Liu & Ormel (2018) Liu, B., & Ormel, C. W. 2018, arXiv:1803.06149
- Lodders (2004) Lodders, K. 2004, ApJ, 611, 587
- Lubow & D’Angelo (2006) Lubow, S. H., & D’Angelo, G. 2006, ApJ, 641, 526
- Lyra et al. (2008) Lyra, W., Johansen, A., Klahr, H., & Piskunov, N. 2008, A&A, 479, 883
- Lyra et al. (2009) Lyra, W., Johansen, A., Klahr, H., & Piskunov, N. 2009, A&A, 493, 1125
- Lyra et al. (2010) Lyra, W., Paardekooper, S.-J., & Mac Low, M.-M. 2010, ApJ, 715, L68
- Madhusudhan et al. (2017) Madhusudhan, N., Bitsch, B., Johansen, A., & Eriksson, L. 2017, MNRAS, 469, 4102
- Manara et al. (2018) Manara, C. F., Morbidelli, A., & Guillot, T. 2018, A&A, 618, L3
- Matsumura et al. (2017) Matsumura, S., Brasser, R., & Ida, S. 2017, A&A, 607, A67
- Menu et al. (2014) Menu, J., van Boekel, R., Henning, T., et al. 2014, A&A, 564, A93
- Morbidelli et al. (2015) Morbidelli, A., Lambrechts, M., Jacobson, S., & Bitsch, B. 2015, Icarus, 258, 418
- Mordasini (2014) Mordasini, C. 2014, A&A, 572, A118
- Mulders & Dominik (2012) Mulders, G. D., & Dominik, C. 2012, A&A, 539, A9
- Muñoz Caro & Schutte (2003) Muñoz Caro, G. M., & Schutte, W. A. 2003, A&A, 412, 121
- Musiolik et al. (2016a) Musiolik, G., Teiser, J., Jankowski, T., & Wurm, G. 2016a, ApJ, 818, 16
- Musiolik et al. (2016b) Musiolik, G., Teiser, J., Jankowski, T., & Wurm, G. 2016b, ApJ, 827, 63
- Ndugu et al. (2018) Ndugu, N., Bitsch, B., & Jurua, E. 2018, MNRAS, 474, 886
- Okuzumi et al. (2012) Okuzumi, S., Tanaka, H., Kobayashi, H., & Wada, K. 2012, ApJ, 752, 106
- Ormel & Cuzzi (2007) Ormel, C. W., & Cuzzi, J. N. 2007, A&A, 466, 413
- Ormel & Klahr (2010) Ormel, C. W., & Klahr, H. H. 2010, A&A, 520, A43
- Ormel et al. (2017) Ormel, C. W., Liu, B., & Schoonenberg, D. 2017, A&A, 604, A1
- Owen & Wu (2017) Owen, J. E., & Wu, Y. 2017, ApJ, 847, 29
- Paardekooper et al. (2010) Paardekooper, S.-J., Baruteau, C., Crida, A., & Kley, W. 2010, MNRAS, 401, 1950
- Pérez et al. (2012) Pérez, L. M., Carpenter, J. M., Chandler, C. J., et al. 2012, ApJ, 760, L17
- Pinte et al. (2016) Pinte, C., Dent, W. R. F., Ménard, F., et al. 2016, ApJ, 816, 25
- Piso & Youdin (2014) Piso, A.-M. A., & Youdin, A. N. 2014, ApJ, 786, 21
- Popovas et al. (2018) Popovas, A., Nordlund, Å., Ramsey, J. P., & Ormel, C. W. 2018, MNRAS, 479, 5136
- Pringle (1981) Pringle, J. E. 1981, ARA&A, 19, 137
- Qi et al. (2013) Qi, C., Öberg, K. I., Wilner, D. J., et al. 2013, Science, 341, 630
- Rafikov (2002) Rafikov, R. R. 2002, ApJ, 572, 566
- Ros & Johansen (2013) Ros, K., & Johansen, A. 2013, A&A, 552, A137
- Safronov (1969) Safronov, V. S. 1969, Evoliutsiia doplanetnogo oblaka. (English transl.: Evolution of the Protoplanetary Cloud and Formation of Earth and the Planets, NASA Tech. Transl. F-677, Jerusalem: Israel Sci. Transl. 1972)
- Schoonenberg & Ormel (2017) Schoonenberg, D., & Ormel, C. W. 2017, A&A, 602, A21
- Shiraishi & Ida (2008) Shiraishi, M., & Ida, S. 2008, ApJ, 684, 1416
- Tanaka & Ida (1999) Tanaka, H., & Ida, S. 1999, Icarus, 139, 350
- Tanaka et al. (2002) Tanaka, H., Takeuchi, T., & Ward, W. R. 2002, ApJ, 565, 1257
- Tanigawa & Tanaka (2016) Tanigawa, T., & Tanaka, H. 2016, ApJ, 823, 48
- Testi et al. (2003) Testi, L., Natta, A., Shepherd, D. S., & Wilner, D. J. 2003, A&A, 403, 323
- Trotta et al. (2013) Trotta, F., Testi, L., Natta, A., Isella, A., & Ricci, L. 2013, A&A, 558, A64
- Tychoniec et al. (2018) Tychoniec, Ł., Tobin, J. J., Karska, A., et al. 2018, ApJS, 238, 19
- van Boekel et al. (2017) van Boekel, R., Henning, T., Menu, J., et al. 2017, ApJ, 837, 132
- Venturini & Helled (2017) Venturini, J., & Helled, R. 2017, ApJ, 848, 95
- Wahl et al. (2017) Wahl, S. M., Hubbard, W. B., Militzer, B., et al. 2017, Geochim. Res. Lett., 44, 4649
- Wilner et al. (2005) Wilner, D. J., D’Alessio, P., Calvet, N., Claussen, M. J., & Hartmann, L. 2005, ApJ, 626, L109
- Weidenschilling (1977) Weidenschilling, S. J. 1977, MNRAS, 180, 57
- Youdin & Goodman (2005) Youdin, A., & Goodman, J. 2005, ApJ, 620, 459
- Zsom et al. (2010) Zsom, A., Ormel, C. W., Güttler, C., Blum, J., & Dullemond, C. P. 2010, A&A, 513, A57
Appendix A Life-time of the pebble component of protoplanetary discs
Protoplanetary discs are efficient at converting dust to pebbles, due to their high gas densities and weak turbulence. Testi et al. (2003) and Wilner et al. (2005) inferred the presence of cm-sized pebbles in protoplanetary discs around CQ Tau and TW Hya, respectively, from the spectral energy distribution. Many other protoplanetary discs have been resolved at cm wavelengths, including AS 209 (Pérez et al., 2012), CQ Tau (Trotta et al., 2013) and HL Tau (Carrasco-González et al., 2016), to reveal mm-sized pebbles in the outer parts of the discs and cm-sized pebbles in the inner regions. Ansdell et al. (2017) presented extensive survey results on dust masses of protoplanetary discs observed with ALMA and found generally 1-100 Earth masses of mm-sized pebbles remaining in relatively evolved discs around solar-type stars with ages in excess of one million years.
The presence of pebbles in protoplanetary is difficult to reconcile with the short drift time-scales of pebbles (Brauer et al., 2007). Lambrechts & Johansen (2014) proposed that the delayed growth from dust to pebbles in the low-density environment of the protoplanetary disc beyond 100 AU provides a mechanism to maintain a long life-time of the pebble disc. The mass flux of pebbles is determined not by the radial drift of the large pebbles close to the star, but by the time-scale to grow to drifting sizes in the outer disc. However, their model did not incorporate the exponentially tapered outer regions of the protoplanetary disc, which form as a natural consequence of outwards angular momentum transport (Pringle, 1981).
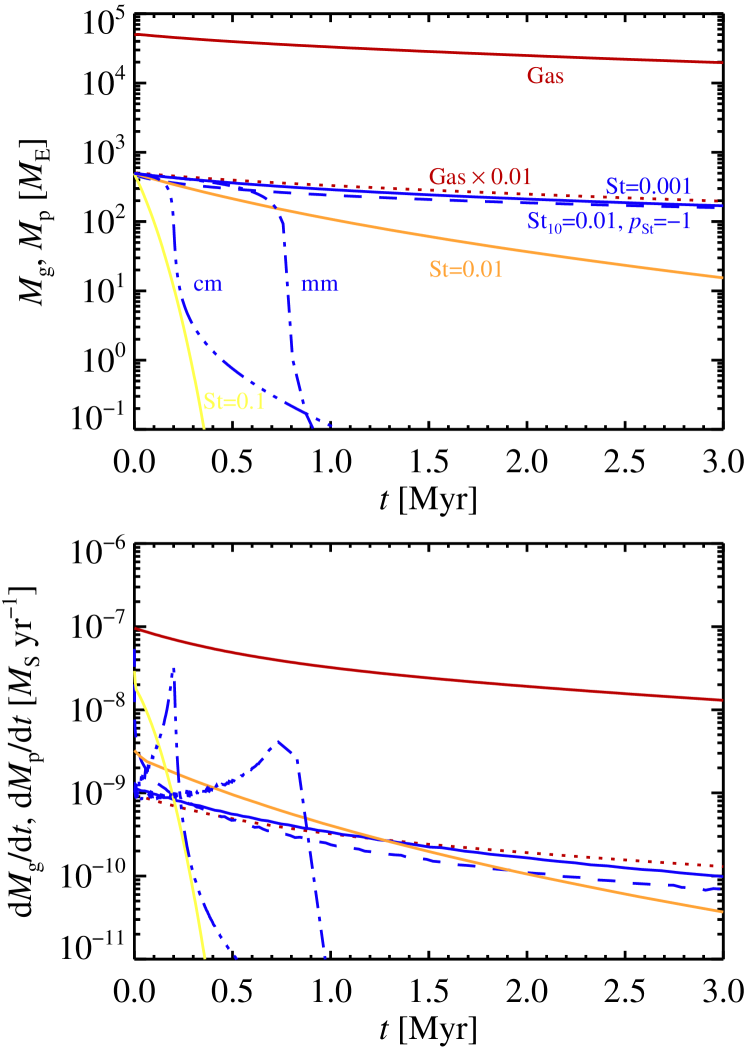
We explore here the evolution of drifting pebbles in an -model of a protoplanetary disc. We let the gas evolve according to the analytical viscous disc equations given in Hartmann et al. (1998) and simulate the motion of 20,000 pebble superparticles, with the mass of each pebble swarm set to give an initial dust-to-gas ratio everywhere. In Figure 11 we show the total gas and pebble masses (top panel) and mass accretion rates (bottom panel) for a disc that evolves from to over 3 Myr. We adopt for the disc evolution, so that the disc has an initial size of AU. We use six models for the pebble sizes: (i) constant Stokes number , (ii) constant Stokes number , (iii) constant Stokes number , (iv) constant pebble size , (v) constant pebble size and (vi) variable Stokes number . The gas mass in these -disc models falls only slowly with time; this is due to the power-law nature of the temporal evolution of the accretion rate. Protoplanetary discs may need FUV photoevaporation to dissipate these viscously spreading outer regions (Gorti et al., 2015).
The simulations presented in Figure 11 with mm-sized pebbles, cm-sized pebbles or pebbles with are quickly drained out of the protoplanetary disc, in much less than one million years. The pebble fluxes are initially very high, with reaching values above 0.1. While such mass fluxes could certainly lead to very high pebble accretion rates, the rapid depletion of pebbles appears in conflict with observations of – of pebbles in evolved protoplanetary discs around solar-mass stars (Ansdell et al., 2017).
The models with , or power-law Stokes number are more successful at maintaining the pebbles for the life-time of the protoplanetary disc. Here the low drift rates of the small pebbles, as well as the outwards drift of pebbles in the viscously expanding outer regions of the protoplanetary disc, keep the pebble flux at a level of around 1% of the gas flux. The model with at 10 AU and falling inversely proportionally to the distance could have its physical foundation in a turbulent that increases in the outer disc, limiting the particle growth there (as proposed in Ida et al., 2016). For this model we also limited the smallest particle size to one micron.
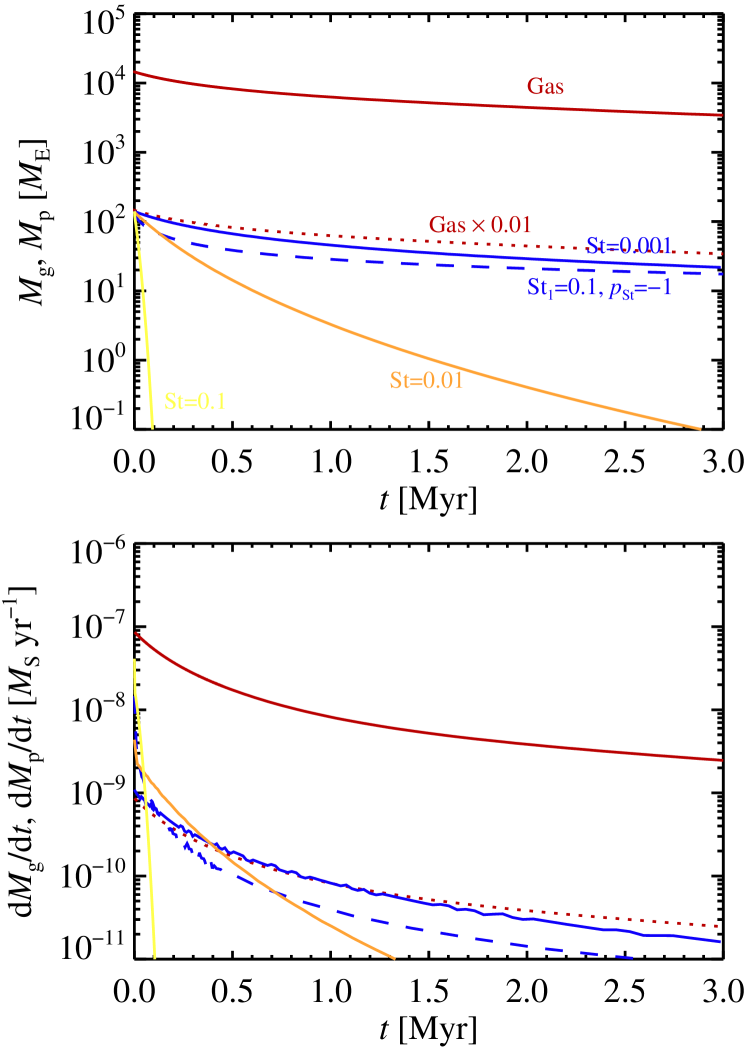
In Figure 12 we show the gas and pebble evolution for an initial disc size of . The initial disc mass is thus only , towards the low end for the distribution of masses of embedded Class 0 and Class I objects (Tychoniec et al., 2018). Even small pebbles with only survive for less than 1 Myr in such a small disc. Tiny pebbles with nevertheless follow the gas accretion profile closely, as does the model with a Stokes number that decreases with distance.
While the realism of the -model that we use here for the gas is debatable in light of modern disc-wind models for accretion (Bai & Stone, 2013; Béthune et al., 2017), overall we find that the presence of pebbles in protoplanetary discs for million years may be determined by the limited growth of particles in the outer regions of the protoplanetary disc that acts as a drift bottleneck. Such small and cold dust far from star would be hard to detect but may reveal its presence in scattered light images of protoplanetary discs that often extends to sizes much larger than at mm wavelengths (e.g. van Boekel et al., 2017).
Appendix B Analytical expression for the growth track time
In this Appendix we derive the time associated with the analytical growth track derived in Section 2. We replace the pebble surface density in equation (1) by equation (13) and split out the specific dependence on and to obtain
| (43) | |||||
We need now a model for the evolution of the protoplanetary disc. We use the standard -disc evolution model of Section 3. The turbulent viscosity follows the power-law
| (44) |
Here the power-law index can be written as
| (45) |
The gas accretion onto the star evolves as (Hartmann et al., 1998)
| (46) |
where the non-dimensional time is
| (47) |
the characteristic time is
| (48) |
and is the initial disc size and the viscosity at that location. We now insert the inverse solution for the growth track, , and separate the variables and to yield the equation
| (49) |
We integrate both sides to yield
| (50) |
We now divide the equation by the solution at , , to give the simpler expression
| (51) |
Note that may be complex if the planet never reaches . The solution can easily be solved for for a given , which can be converted to using the viscous disc expression from equation (47). The analytical expression for is obtained by inserting in equation (50).
If we assume for simplicity that is constant, then we can replace the complicated function of appearing on the right-hand-side of equation (50) by . In that case (setting also) we have for the simple expression
| (52) | |||||
The time-evolution of the growth track follows in the limit as . We can scale the time-scale to migrate to the star, , to typical disc values,
| (53) | |||||
The relevant value of for the given parameters can be inserted from equation (23). However, we note that depends weakly on the maximum mass, as . Hence the parameter dependencies in equation (23) are much weaker than those explicit in equation (53) above. One can also approximately use as the time to reach the isolation mass, as the isolation mass and the maximum mass are both reached after significant migration when . Under all circumstances does give an upper limit to the time of reaching the isolation mass.