SCExAO/CHARIS Near-IR High-Contrast Imaging and Integral Field Spectroscopy of the HIP 79977 Debris Disk
Abstract
We present new, near-infrared (1.1–2.4 ) high-contrast imaging of the bright debris disk surrounding HIP 79977 with the Subaru Coronagraphic Extreme Adaptive Optics system (SCExAO) coupled with the CHARIS integral field spectrograph. SCExAO/CHARIS resolves the disk down to smaller angular separations of (011; au) and at a higher significance than previously achieved at the same wavelengths. The disk exhibits a marginally significant east-west brightness asymmetry in band that requires confirmation. Geometrical modeling suggests a nearly edge-on disk viewed at a position angle of 114.6 east of north. The disk is best-fit by scattered-light models assuming strongly forward-scattering grains ( 0.5–0.65) confined to a torus with a peak density at 53–75 au. We find that a shallow outer density power law of -1– -3 and flare index of are preferred. Other disk parameters (e.g. inner density power law and vertical scale height) are more poorly constrained. The disk has a slightly blue intrinsic color and its profile is broadly consistent with predictions from birth ring models applied to other debris disks. While HIP 79977’s disk appears to be more strongly forward-scattering than most resolved disks surrounding 5–30 Myr-old stars, this difference may be due to observational biases favoring forward-scattering models for inclined disks vs. lower inclination, ostensibly neutral-scattering disks like HR 4796A’s. Deeper, higher signal-to-noise SCExAO/CHARIS data can better constrain the disk’s dust composition.
1 Introduction
Debris disks around young stars are signposts of massive planets (e.g. Marois et al., 2008; Lagrange et al., 2010) and critical reference points for understanding the structure, chemistry, and evolution of the Kuiper belt (Wyatt, 2008). Debris disks may be made visible by recently-formed icy Pluto-sized objects stirring and causing collisions between surrounding boulder-sized icy planetesimals. The luminosity distribution of debris disks over a range of ages then traces the evolution of debris produced by icy planet formation. (Currie et al., 2008; Kenyon & Bromley, 2008)). Similarly, massive jovian planets may create gaps in some of these debris disks and sculpt the distribution of their icy planetesimals (Mustill & Wyatt, 2009).
Resolved imaging of debris disks in scattered light has revealed dust sculpted in morphologies ranging from diffuse structures or extended torii to sharp rings; disks exhibited scattering properties ranging from neutral to strongly forward scattering (e.g. Smith & Terrile, 1984; Schneider et al., 1999, 2005, 2009; Kalas et al., 2005, 2006, 2007a; Soummer et al., 2014; Currie et al., 2015, 2017b). Furthermore, multi-wavelength imaging and spectroscopy of debris disks in scattered light provide further insights into the nature of debris disk properties. The differing grain properties of debris disks can result in a spread in intrinsic disk colors from blue (e.g. AU Mic, Fitzgerald et al., 2007), where dust is reflecting light more efficiently at shorter wavelengths compared to what it receives from the star, to red (e.g. Pic, Golimowski et al., 2006). Detailed photometric color characterization provides insights into grain properties, and low-resolution spectroscopy (even as low as R 10) probes the presence of ices and organics (e.g. Debes et al., 2008; Rodigas et al., 2014; Currie et al., 2015).
Extreme adaptive optics (ExAO) systems coupled with integral field spectrographs improve the ability to detect and characterize debris disks, especially at small angles. For example, resolved imaging and spectroscopy of the HD 115600 debris disk with the Gemini Planet Imager, the first object discovered with ExAO, revealed a sharp ring at 05, modeling for which suggested neutral-scattering and possibly icy dust and a pericenter offset caused by a hidden jovian planet (Currie et al., 2015). Milli et al. (2017) resolved the well-known HR 4796A disk at far smaller angular separations than done previously. They showed that a seemingly neutral-scattering dust ring has a strong forward-scattering peak at small angles, inconsistent with a single Henyey-Greenstein-like scattering function. Resolved imaging and spectroscopy over a longer wavelength baseline enables better constraints on the properties of other debris disks (e.g. Rodigas et al., 2015; Milli et al., 2017).
HIP 79977 is another young star whose debris disk can better understood using multi-wavelength imaging and spectroscopy with ExAO. This is an F2/3V star (1.5 ) located pc away (Gaia Collaboration, 2018) in the 10 Myr-old Upper Scorpius association (Pecaut et al., 2012). Its infrared excess was detected by the satellite, and the Spitzer Multiband Imaging Photometer associated it with a debris disk (Chen et al., 2011). Thalmann et al. (2013) used Subaru’s facility (conventional) AO188 adaptive optics system and the HiCIAO instrument at band and produced the first resolved images of its debris disk. They revealed that it was viewed nearly edge-on () and had a position angle of . The noted tangential linear polarization varying from 10 at 05 to 45 at 15. Engler et al. (2017) performed the first ExAO characterization of HIP 79977, observing it at visible wavelengths ( nm, nm) using the SPHERE-ZIMPOL polarimeter. They measured a polarized flux contrast ratio for the disk of in that band and an increase in the thickness of the disk at larger radii, which they explained by the blow-out of small grains by stellar winds. They found a best-fitting inclination of and a position angle of .
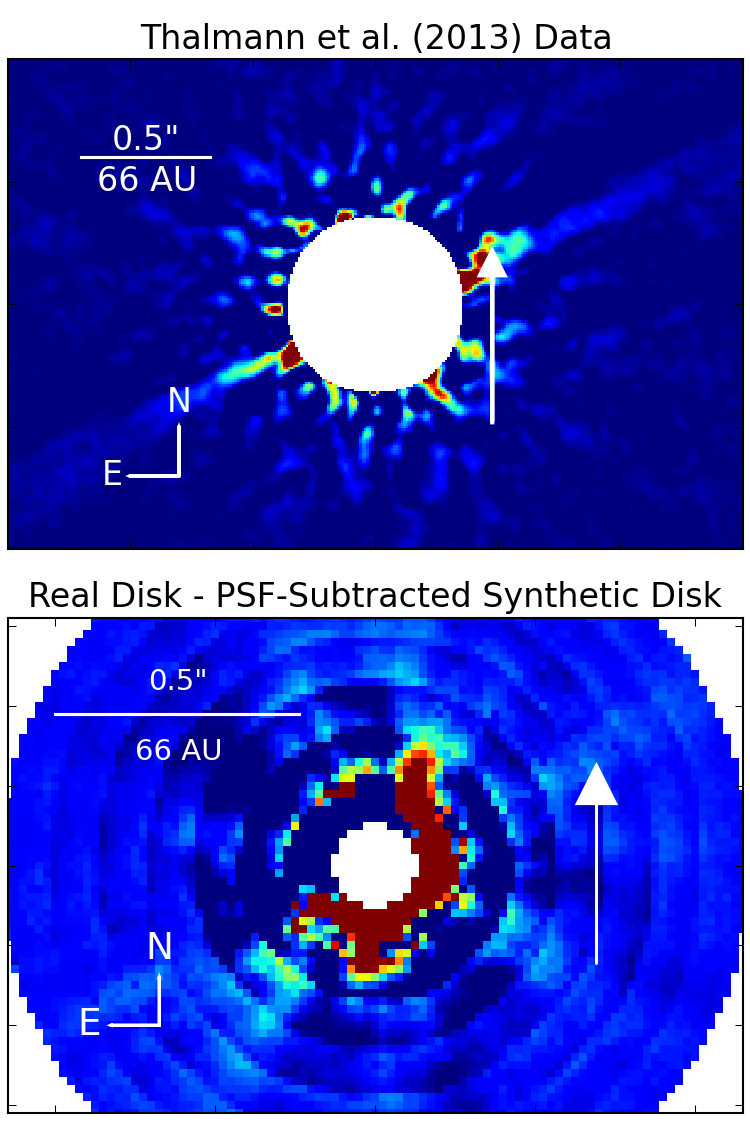
These previous studies showed tension in some derived debris disk properties (e.g. the disk radius) and allowed a wide range of parameter space for others (e.g. the disk scattering properties). No substellar companions were decisively detected in either publication. However, Thalmann et al. (2013) did find a marginally significant point-like residual emission in their reduced image after subtracting a model of the debris disk’s emission.
In this paper, we present the first near-IR resolved ExAO images of the HIP 79977 debris disk, using the Subaru Coronagraphic Extreme Adaptive Optics systems coupled with the CHARIS integral field spectrosgraph. SCExAO/CHARIS data probe inner working angles (015–02) comparable to those from SPHERE polarimetry reported in Engler et al. (2017) and significantly smaller than that presented in Thalmann et al. (2013). Additionally, we present the first near-IR color analysis of the disk.
The paper is organized as follows: in Section 2, we describe the observations and the pipeline through which the data was reduced and then PSF-subtracted; in Section 3, we describe the basic morphology of the disk; then, in Section 4.1 we discuss the process through which we generated synthetic disks and propagated them through the same pipeline as the actual data in order to understand how the PSF subtraction attenuated the disk features; we provide the results of this forward modeling in Section 4.2; finally, we describe the -, -, and -band colors of the disk.
2 SCExAO/CHARIS Data
2.1 Observations and Data Reduction
We targeted HIP 79977 on UT 14 August 2017 (Program ID S17B-093, PI T. Currie) with Subaru Telescope’s SCExAO (Jovanovic et al., 2015b) instrument coupled to the CHARIS integral field spectrograph, which operated in low-resolution (), broadband (1.13–2.39 ) mode (Peters et al., 2012; Groff et al., 2013). SCExAO/CHARIS data were obtained using the Lyot coronagraph with the 217 mas diameter occulting spot. Satellite spots, attenuated copies of the stellar PSF, were generated by placing a checkerboard pattern on the deformable mirror with a 50 nm amplitude and alternating its phase between and (Jovanovic et al., 2015a). These spots were used for image registration and spectrophotometric calibration; their intensity relative to the star111The spot intensity calibration changed following the observations described in this paper, so this equation may not match what is provided elsewhere. was given by
| (1) |
Exposures consisted of 86 co-added 60 frames (82 science frames, 4 sky frames) obtained in pupil tracking/angular differential imaging (ADI, Marois et al., 2006) mode over 92 minutes and covering a total parallactic angle rotation of . Conditions were excellent; seeing was 035-040 at 0.5 and the wind speed was 3 m s-1. Although we did not obtain a real-time estimate of the Strehl ratio, the raw contrasts at 02–075 later estimated from spectrophotometrically calibrated data were characteristic of those obtained with -band Strehls of 70–80% (Currie et al., 2018a).
To convert raw CHARIS files into data cubes, we employed the CHARIS Data Reduction Pipeline (CHARIS DRP, Brandt et al., 2017). After generating a wavelength solution from monochromatic ( = 1.550 ) lenslet flats, the pipeline extracted data cubes using the least squares method described by Brandt et al. (2017), yielding a nominal spaxel scale of 00164 and 105 radius field of view. Subsequent processing steps – e.g. image registration and spectrophotoemtric calibration – followed those from Currie et al. (2018a).
For PSF subtraction, we utilized the Karhunen-Loève Image Projection (KLIP)-based algorithm of Soummer et al. (2012) in angular differential imaging-only mode as employed in Currie et al. (2014, 2017a), where PSF subtraction is performed in annular regions with a rotation gap to limit signal loss from self-subtraction of astrophysical sources. Key algorithm parameters – the width of annulus over which PSF subtraction is performed (r), the rotation gap (), the number of principal components () – were varied to explore which combination maximized the total SNR of the disk in sequence-combined, wavelength-collapsed images. While the detection of the HIP 79977 debris disk was robust across the entire range of parameter space, the signal to noise of the spine of the disk was maximized with a setting with r = 2 pixels, , and full width half maxima (FWHM) and then merging the wavelength channels using a robust mean with outlier rejection instead of a median combination. As described later, for computational efficiency and simplicity, we performed a second reduction with a larger annular width of r = 6 pixels (/D at 1.55 ). Reductions retaining a slightly different number of principal components or value for the rotation gap yielded comparable results.
2.2 Detection of the HIP 79977 Debris Disk
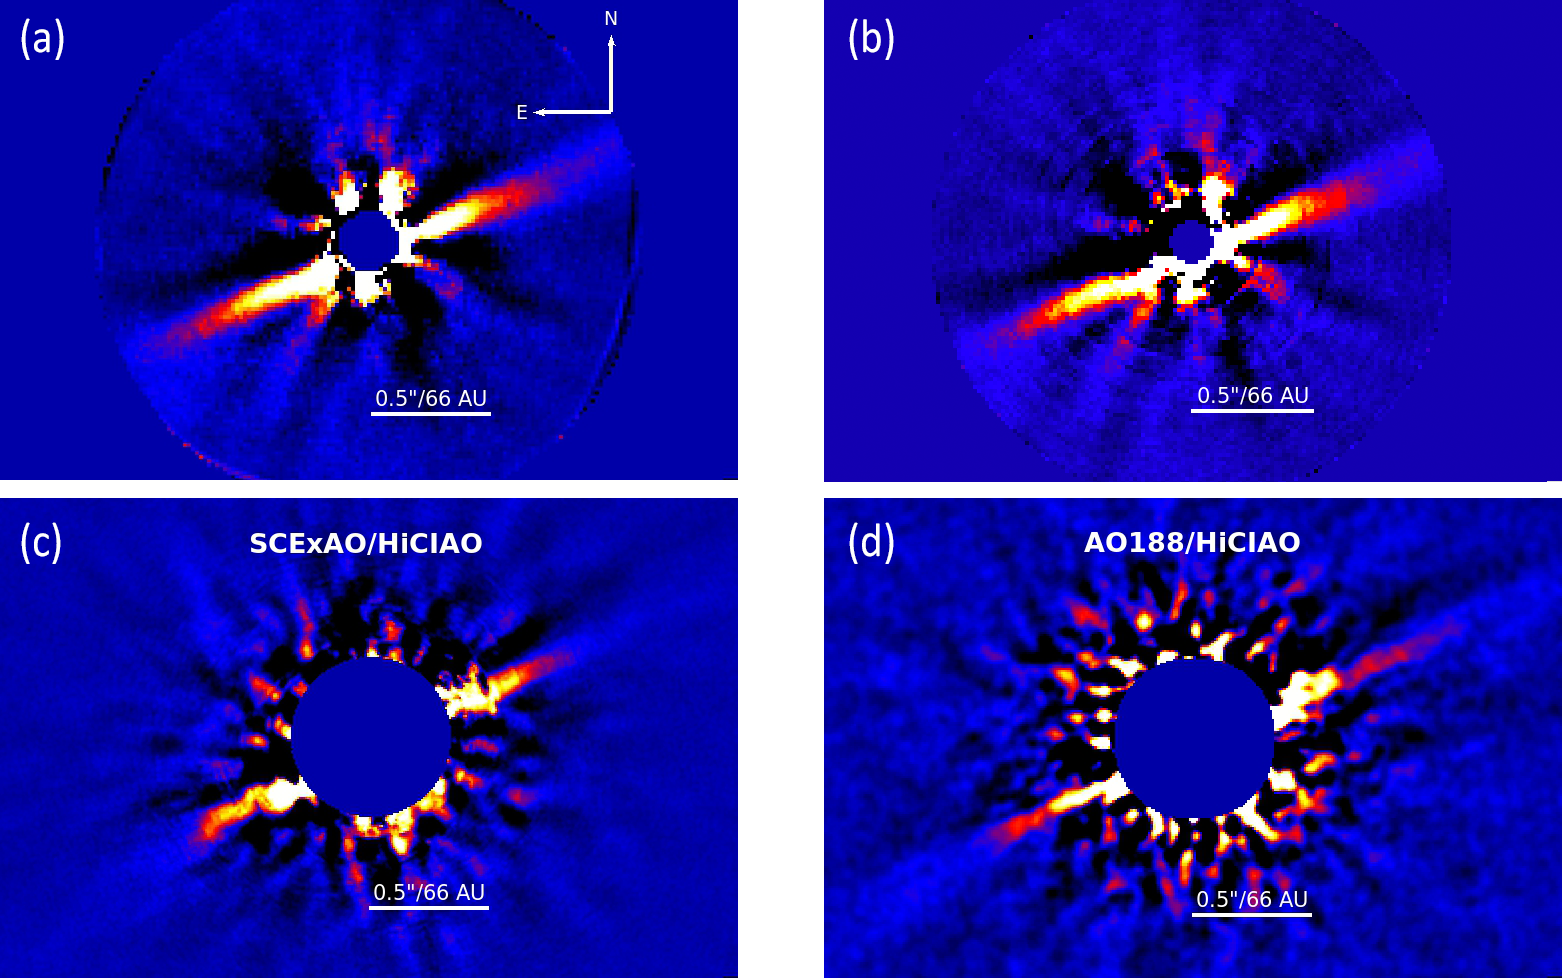
Figures 1a and 1b show the results of these two reductions of the CHARIS data. Figures 1c and 1d contextualize the performance gain of SCExAO/CHARIS compared to earlier observations. The disk is plainly visible down to an inner working angle of 011 in 1a and 1b. Figure 1c shows data collected on UT 17 July 2016 (Program UH-12B, PI K. Hodapp) using SCExAO (suboptimally tuned and providing lower Strehl than that of the recent data) and the HiCIAO instrument at band. Although the July 2016 SCExAO/HiCIAO image has a larger field of view than the SCExAO/CHARIS image, it exhibits far stronger residuals interior to about 03–05. Figure 1d shows the AO188 (Subaru’s facility AO system, Minowa et al., 2010) + HiCIAO data previously published by Thalmann et al. (2013), and this has even stronger residuals, particularly at smaller angular separations, due to its much poorer AO correction.
Figure 2 shows the sequence-combined, wavelength-collapsed disk image scaled by the stellocentric distance squared, and analogous images obtained from combining channels covering the (channels 1–5; 1.16–1.33 m), (channels 8–14; 1.47–1.80 m), and (channels 16–21; 1.93–2.29m) passbands. This image used the first set of KLIP parameters described above. The disk is plainly visible in each image. We computed the signal-to-noise per resolution element using the standard practice of replacing each pixel with the sum within a FWHM-sized aperture, computing the radial profile of the robust standard deviation of this summed image in the wavelength-collapsed image, dividing the two images, and correcting for small sample statistics (Currie et al., 2011). The disk is detected at a SNR/resolution element (SNRE) 3 exterior to 025 and peaks at SNRE 9.1, 8, 9.1, and 5.8 in the broadband, , , and images, respectively222We achieved comparable results using a different algorithm, A-LOCI, using local masking as implemented in Currie et al. (2012, 2017b).. These estimates are conservative as we do not mask the disk signal when computing the noise profile. For our second reduction the SNRE values along the disk spine are slightly smaller at small angles but otherwise comparable, peaking at 9.6, 9, 8.4, and 5.6 in the broadband, , , and images, respectively.
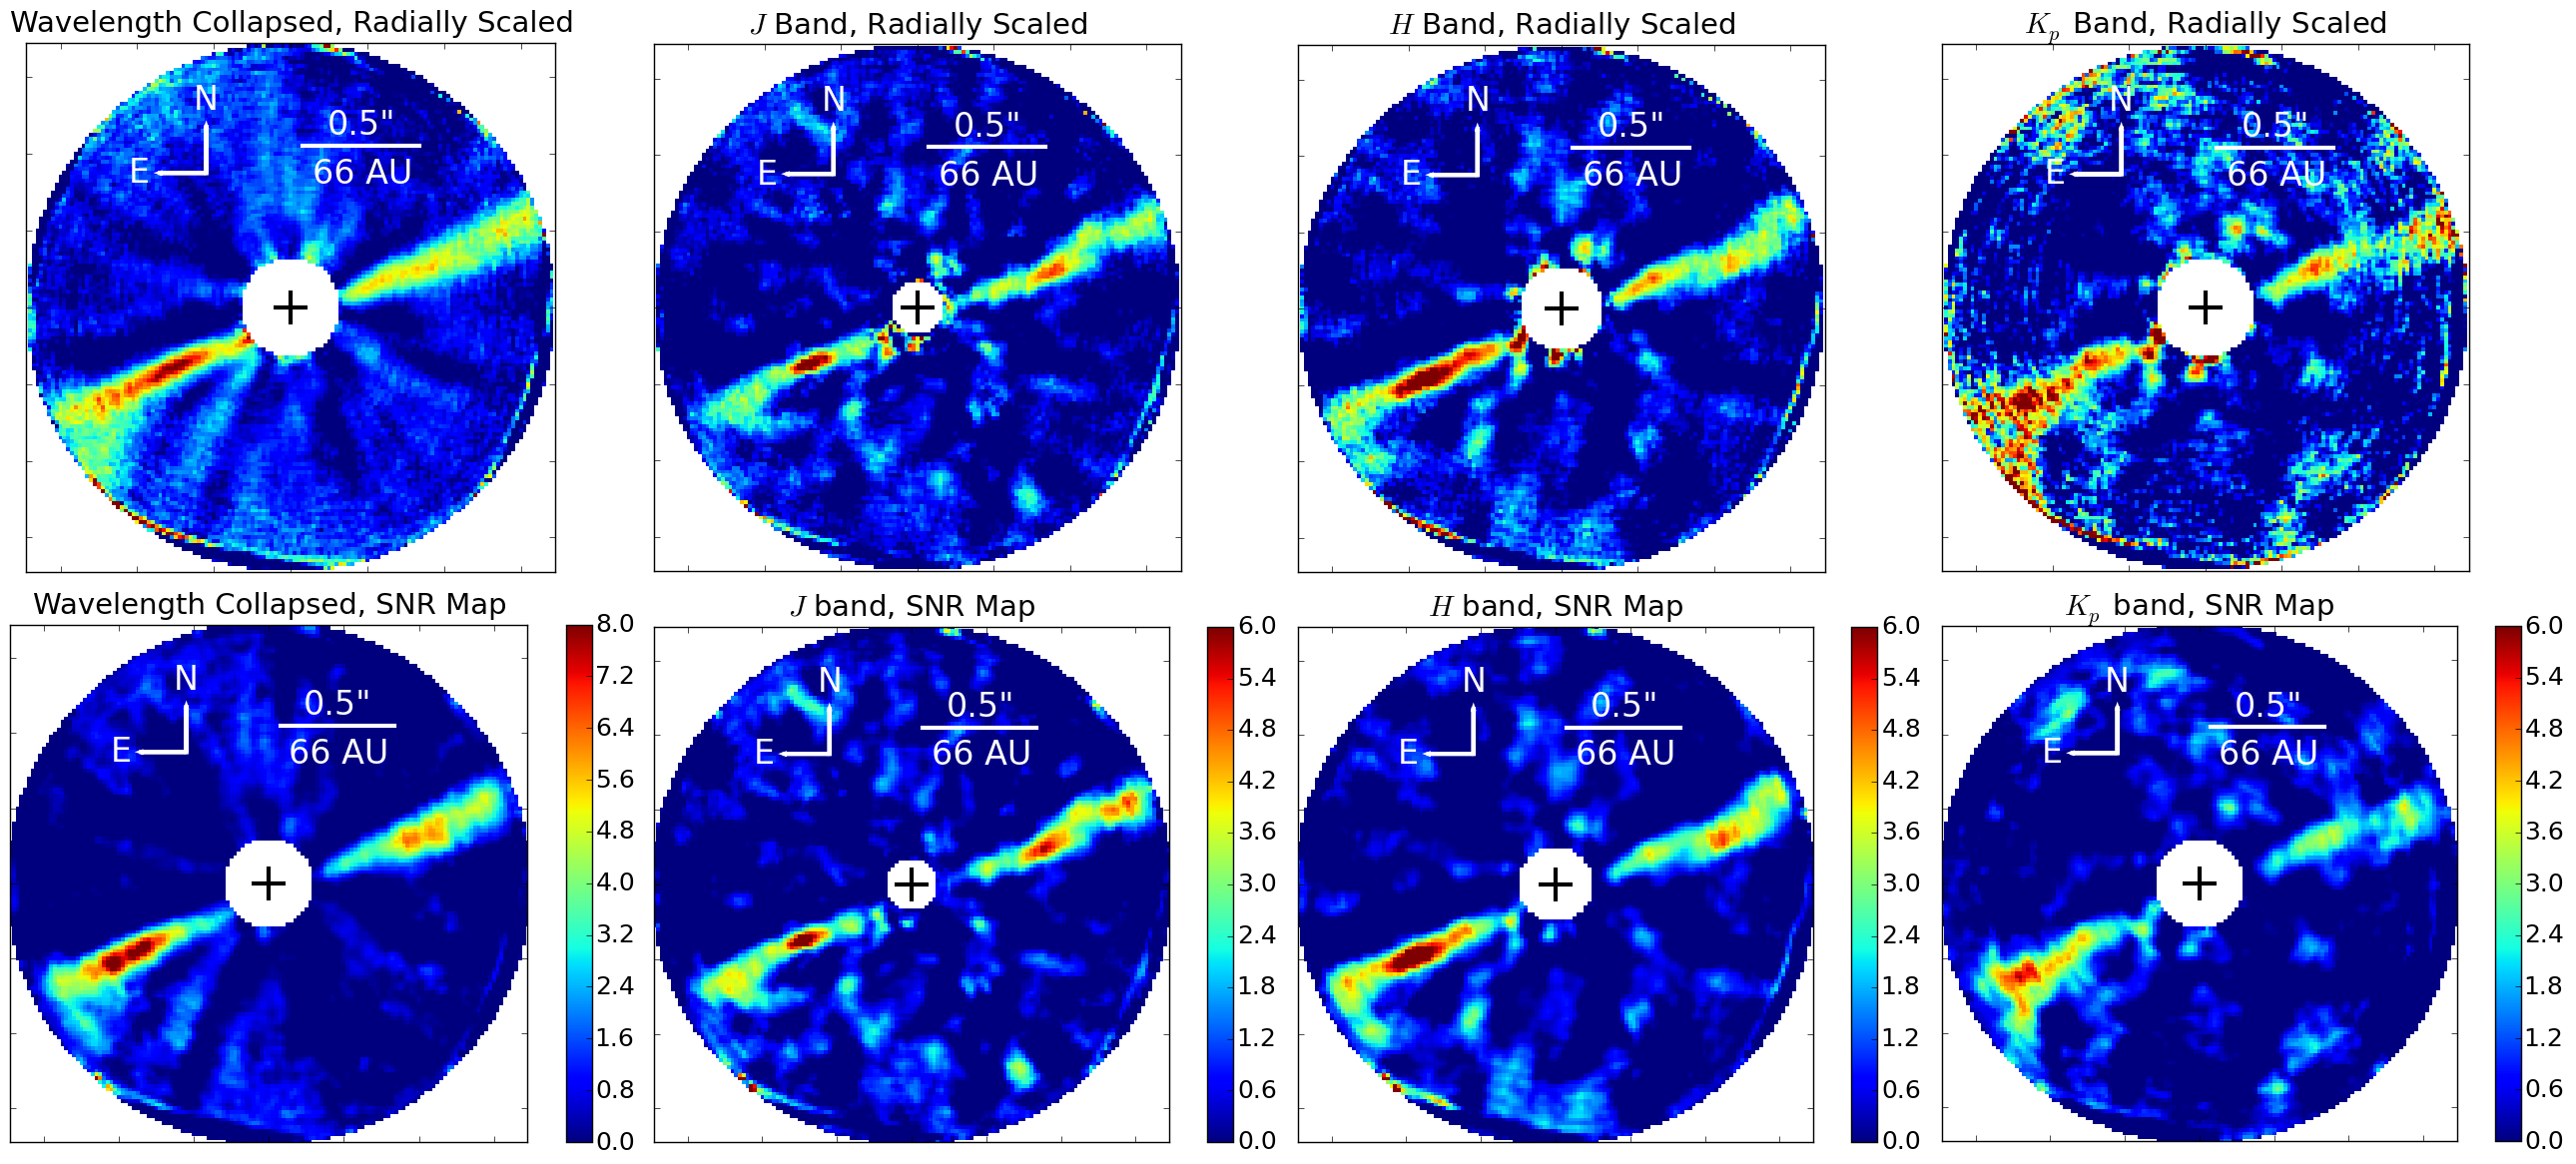
For both reductions, the final images and SNR maps may reveal some evidence for a wavelength dependent brightness asymmetry between the eastern and western sides. In the wavelength-collapsed image, the eastern side of the disk appears about 50% brighter and is detected at a higher significance ( vs. along the disk spine beyond 05). From comparing images obtained over different passbands, and band seem to be responsible for most of this brightness asymmetry.
3 Geometry of the HIP 79977 Debris Disk
Our images clearly trace the major axis of the HIP 79977 debris disk. To estimate the disk’s position angle, we follow previous analysis performed for HD 36546 (Currie et al., 2017b) and for Pic (Lagrange et al., 2012), determining the trace of the disk spine from the peak brightness as a function of separation (“maximum spine” fitting) and from fitting a Lorentzian profile. Our procedure used the mpfitellipse package to estimate the disk spine from disk regions between 015 and 075, where the pixels are weighted by their SNRE, and explored a range of thresholds in SNRE (0–3) to define the spine.
Precise astrometric calibration for CHARIS is ongoing and preliminary results will be described in full in a separate early-science paper focused on Andromedae b (Currie et al. 2018, in prep.). Briefly, we obtained near-infrared data for HD 1160 from SCExAO/CHARIS in September 2017 and Keck/NIRC2 in December 2017. At a projected separation of 80 au, the low-mass companion HD 1160 B should not experience significant orbital motion (Nielsen et al., 2012; Garcia et al., 2017); Keck/NIRC2 is precisely calibrated, with a north position angle uncertainty of 0.02o and post-distortion corrected astrometric uncertainty of 0.5 mas (Service et al., 2016). Thus, we pinned the SCExAO/CHARIS astrometry for HD 1160 B to that for Keck/NIRC2 to calibrate CHARIS’s pixel scale and north position angle offset. These steps yielded a north PA offset of east of north and a revised pixel scale of 00162. While the differences between the default and revised pixel scale lead to astrometric offsets are inconsequential for this paper (10 mas near the edge of CHARIS’s field of view), the north position angle (PA) offset for CHARIS is necessary for an accurate estimate of the position angle for the disk’s major axis.
After considering CHARIS’s north PA offset, Lorentzian profile fitting yields a position angle of . “Maximum spine” fitting yields nearly identical results but with larger error bars: . These values are consistent with previous estimates from Engler et al. (2017) and Thalmann et al. (2013). For the rest of the paper, we adopt a position angle of .
4 Modeling of the HIP 79977 Debris Disk
4.1 Methodology
4.1.1 Forward-Modeling of the Annealed Disk Due to PSF Subtraction
To assess the morphology of the HIP 79977 debris disk, we forward-modeled synthetic disk images spanning a range of properties through empty data cubes, using the same eigenvalues and eigenvectors used in the reduction of our on-sky data (e.g. Soummer et al., 2012; Pueyo, 2016). Our specific implementation, following the formalism in Pueyo (2016), is described and justified in detail below.
The residual signal of a planet or disk in a target image with spatial dimensions x and an intrinsic signal A(x) after KLIP processing is nominally equal to the astrophysical signal in the target image minus its projection on the KLIP basis set constructed from references images from up to k = 1 principal components, :
| (2) |
Here, ZkKL is the Karhunen-Loev́e transform of the reference image library R with eigenvalues and eigenvectors :
| (3) |
When the astrophysical signal in a given image is not contained in reference images used for subtraction or is negligible, then annealing is due to oversubtraction – confusion of the astrophysical signal with speckles – and is fully described by a straightforward application of Equation 2. As described in Pueyo (2016), however, the presence of an astrophysical signal in the reference image library itself causes self-subtraction of the source in the target image and perturbs ZkKL by an amount KL. Self-subtraction can further be subdivided into two contributions. Direct self-subtraction scales linearly with the astrophysical signal () and inversely with the square-root of the unperturbed eigenvalues: KL /. Indirect self-subtraction is inversely proportional to the eigenvalues: KL /.
Pueyo (2016) qualitatively discuss the typical cases where oversubtraction and the two different types of self-subtraction (direct and indirect) dominate for point sources. For small values and an astrophysical signal that is small compared to the speckles over the region where principal component analysis is performed, oversubtraction usually is the primary source of annealing. For intermediate values, direct self-subtraction usually dominates. For large , closer to a full-rank covariance matrix, indirect self-subtraction becomes the most important term. However, the relative contribution of each of these terms for a given value depends on the nature of the astrophysical source to be detected (e.g. planet, sharply defined disk, diffuse disk) and other algorithm settings. For example, using a larger rotation gap can remove more astrophysical signal from the reference library, reducing the influence of self-subtraction at a given .
Previous measurements of the HIP 79977 disk further help identify the important biases/sources of annealing for our HIP 79977 data set. In our reductions, the number of removed KL modes (2) is small compared to the size of the reference library (82 ). In most channels, the disk is 5% of the brightness of the local speckles. Furthermore, we perform PSF subtraction in annular regions. Over the angular separations modeled (016–075), results from Engler et al. (2017, see their Fig. 6b) imply that the nearly edge-on disk is present in no more than 20% of the pixels at each angular separation. Our rotation gap criterion (1 PSF footprint) further reduces self-subtraction. As a result, the perturbed KL modes KL are far smaller than the unperturbed ones dominated by signal from the speckles: the indirect self-subtraction term is negligible. Thus, in performing forward-modeling we consider oversubtraction and direct self-subtraction only.
4.1.2 Scattered Light Disk Models
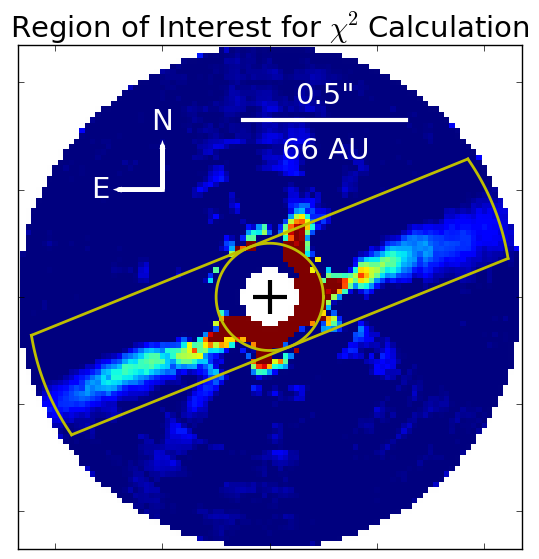
Synthetic scattered light disk models were drawn from the GRaTeR code developed in Augereau et al. (1999), convolved with the SCExAO/CHARIS instrumental PSF, and inserted into empty data cubes with the same position angles as the real data. We then forward-modeled the annealing of each model disk in each wavelength channel due to KLIP PSF subtraction as described above and compared the wavelength-collapsed image of the residual disk model to the real data. The fidelity of each model disk to the data is determined in the subtraction residuals binned (by the instrument PSF size of 004, which corresponds to the area of 7 pre-binned pixels) over a region of interest defining the trace of the disk and any self-subtraction footprints (see Figure 3). This evaluation region encloses 237 binned pixels (Ndata).
The set of acceptably-fitting solutions have chi-squared values of (see Thalmann et al., 2013). At the 95% confidence limit, this criterion equals .
Because we performed KLIP PSF subtraction in annuli (not the entire field at once) and in each of the 22 wavelength channels separately (not single-channel camera data), exploring 106 models covering a large parameter space as in Engler et al. (2017) would be extremely computationally expensive. Rather, we leverage on inspection of the SCExAO/CHARIS wavelength-collapsed final image, our disk geometry modeling, and previous results from Engler et al. (2017) to focus on a smaller parameter space range.
Inspection of the final CHARIS image shows that the disk is detected only on the near side, out to an angular separation of 05–06 before gradually fading in brightness at wider separations. Our fitting to the geometry of the disk reaffirms the position angle of 114.6o we adopted in Section 3. Thus, our parameter space generally explores disks with moderate to strong forward-scattering, a sharp inner cutoff to the belt, and a shallower decay in dust density beyond the fiducial radius.
We varied six parameters in our search for the disk that best reproduced the on-sky data. First, the Henyey-Greenstein parameter (Henyey & Greenstein, 1941) probes the visible extent of the dust’s phase scattering function. While it lacks a pure physical motivation and is known to fail at very small scattering angles for at least some debris disks (Milli et al., 2017)333These angles correspond to the semiminor axis of the HIP 79977 debris disk, which is too close to the star to be accessible with our data., it is widely adopted in debris disk modeling literature and thus helps cast our results within the context established by other debris disks. The H-G parameter ranges from to ; corresponds to neutral scattering, indicates perfect backward scattering, and indicates dust that scatters light solely forward.
Second, we varied values of the fiducial radius of the disk, inside of which () describes the power law for the increase in dust particle number density and outside of which () describes the power law for its decrease. These three variables, which were the second through fourth fitted parameters, combine to give the radial distribution profile :
| (4) |
where is the distance from the center of the disk. The vertical profile is given by
| (5) |
where is the distance above the disk midplane. is the scale height at radius and is given by
| (6) |
where is the scale height at and is the disk’s flare index. and were the fifth and sixth parameters in our grid search.
We tested models with , corresponding to moderate to strong forward scattering. Based on visual estimates of the disk images, we produced model disks with fiducial radii of au. The parameters and determine the power laws for the inner and outer radial emission profiles, respectively, and we selected values that produced disks with relatively sharp inner cutoffs and slow radial decays. We sampled disks with a scale height at the fiducial radius in the range of au; values outside this range would not be consistent with the self-subtracted images. We adopt our value for the disk position angle determined in Section 3. and used our available computing resources to probe a greater variety of the other parameters. Values outside these parameter ranges produced synthetic disks whose morphology differed greatly from the on-sky results. The left two columns of Table 1 list each parameter and the associated range in parameter space explored. A total of 20,480 disks were considered.
Our nominal search considered only circular disks with no star offset, which was the same approach taken by Engler et al. (2017). As stated previously, because the position angle and inclination were tightly constrained by Engler et al. (2017) and Thalmann et al. (2013) and our spine fitting reaffirmed their values, we adopted a position angle of and an inclination of . Lieman-Sifry et al. (2016) analyzed ALMA data and also measured a position angle and inclination consistent with this.
| Parameter | Values tested | Value for | Acceptably-fitting |
|---|---|---|---|
| best model | values | ||
| Radius of belt (au) | [43, 53, 64, 69, 75, 80, 86, 91] | 53 | [53, 64, 69, 75] |
| Inner radial index | [3, 4, 5, 6] | 6 | [3, 4, 5, 6] |
| Outer radial index | [-1, -1.5, -2, -2.5, -3, -3.5, -4.5, -5.5] | -1.5 | [-1, -1.5, -2, -2.5, -3] |
| Vertical scale height (au) | [0.5, 1.1, 1.6, 2.1, 3.2] | 3.2 | [0.5, 1.1, 1.6, 2.1, 3.2] |
| Flare index | [1, 2] | 1 | [1, 2] |
| H-G parameter | [0.3, 0.4, 0.5, 0.55, 0.6, 0.65, 0.7, 0.8] | 0.6 | [0.5, 0.55, 0.6, 0.65] |
Note. — We adopted values for inclination , eccentricity , and position angle in accordance with those measured by Engler et al. (2017). and are not round numbers because they were initially chosen based on the distance to HIP 79977 provided by van Leeuwen (2007), which was refined by Gaia Collaboration (2018), causing the scale to change by . If one value of a parameter fell below the acceptably-fitting threshold for at least one model, it was included here. Figure 6 shows which parameters values most frequently produced acceptably-fitting models.
4.2 Results
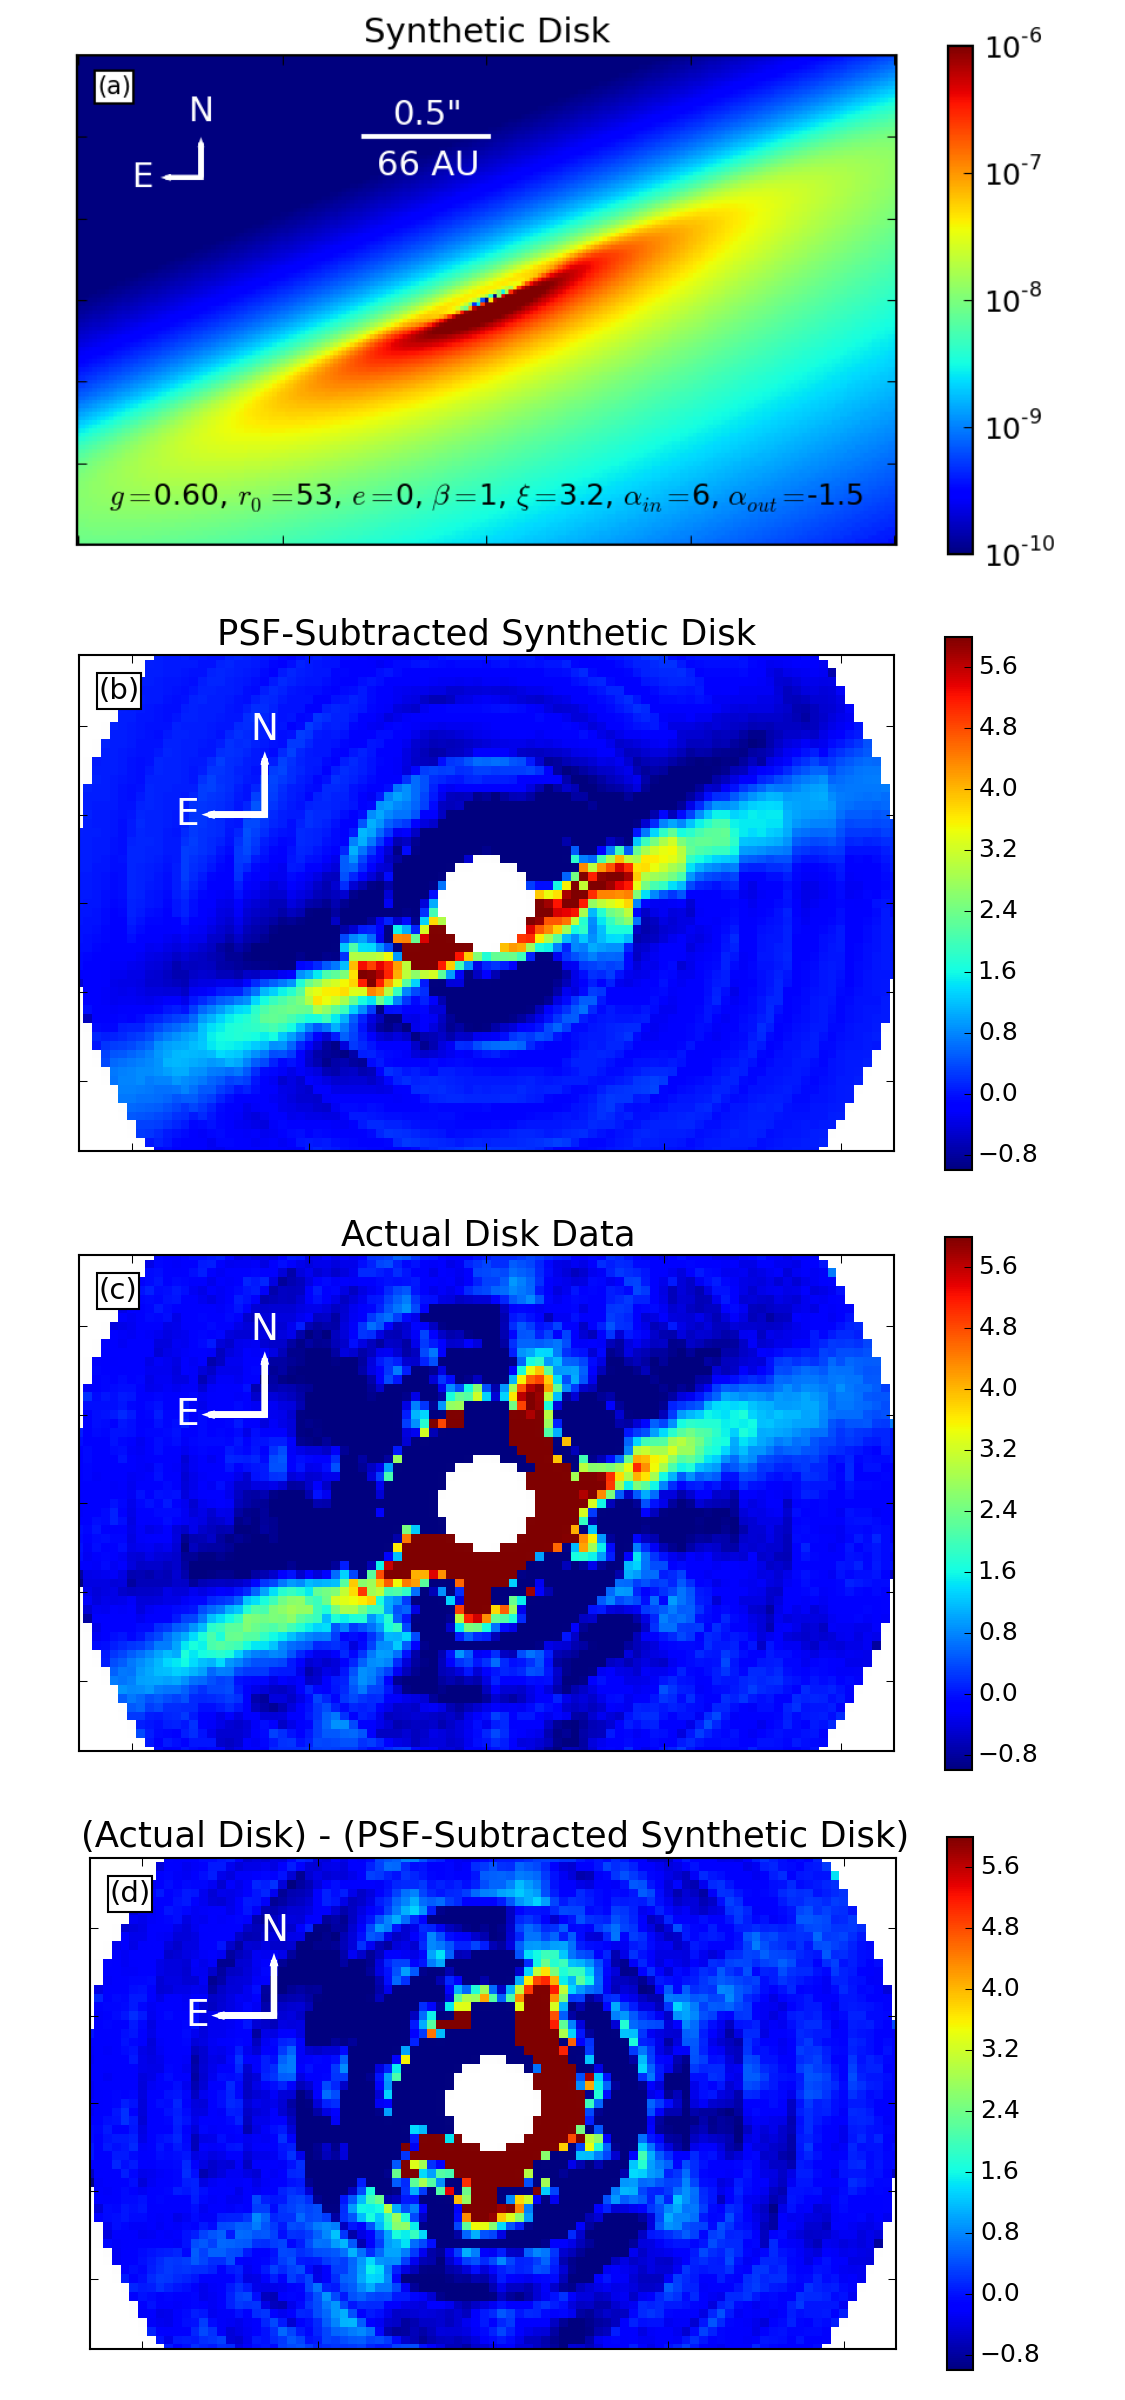
Of the 20,480 synthetic disks, 132 produced residuals of and therefore were acceptably fitting. The best model, which we defined as the model yielding the smallest , produced 1, suggesting that the best-fit models meaningfully reproduce the data. The three panels of Figure 4 show the best-fitting synthetic disk before and after PSF subtraction and the resulting residuals after it was subtracted from the on-sky data. This disk model had , indicating moderately strong forward scattering, a fiducial radius of au, a flare index of , a disk scale height at the fiducial radius of au, and dust emission with an inner power law of and outer power law of .
The range of parameters covered by the acceptably-fitting models is summarized in the fourth column of Table 1. We produced contour maps of the average fit quality for every value of every parameter against every value of every other parameter. An example map, showing the average for each value of and averaged across the other parameters, is shown in Figure 5. These maps helped us ensure that we were sampling a reasonable range of values for each parameter. Additionally, histograms of the parameter values that produced these acceptably-fitting models are shown in Figure 6.
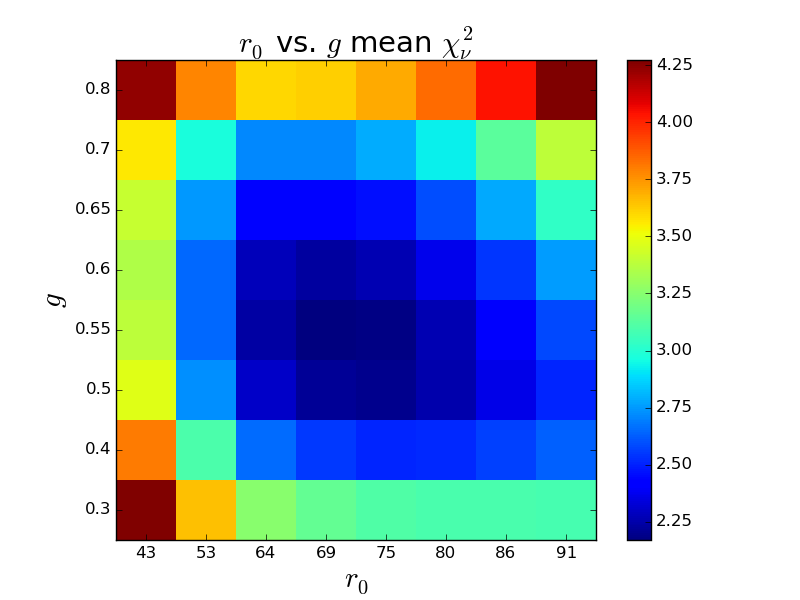
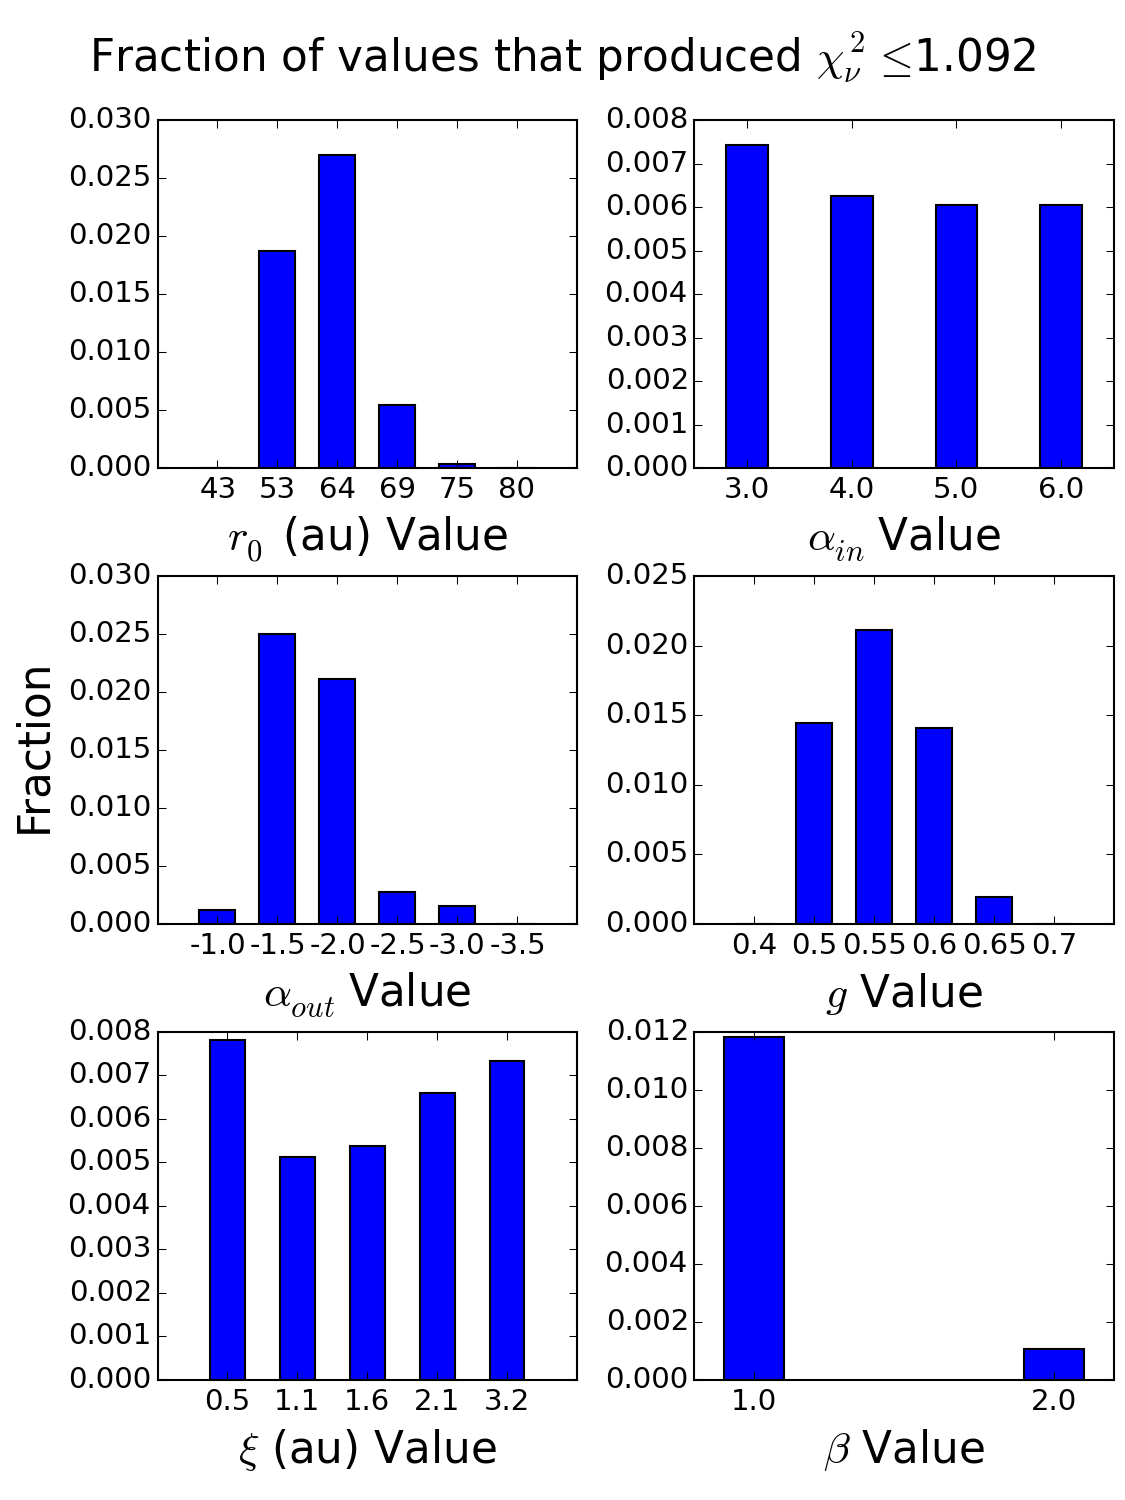
Our modeling yielded improved constraints on the disk’s radius and its scattering properties. As shown in Figure 5, there is a clear minimum in around and au. As shown in Figure 6, the family of acceptably-fitting solutions has a small spread around these values. Our contour plots showed a strong preference for , indicating that the disk has low flaring.
On the other hand, the acceptably-fitting models covered the full range of considered values of , indicating that is not further constrained by our model fitting beyond what was done in (Engler et al., 2017). This is likely because there was inadequate disk available between the inner working angle and the fiducial radius for the fitting to occur.
Our assumption that the disk is circular and has zero stellar offset is affirmed by the fact that , which indicates that (within errors) the model accurately reproduces the data. We did try forward modeling a small number of synthetic disks with low eccentricity or small stellar offset but other parameters identical to those of the best-fitting disk, and the residuals were the same or slightly worse than those from the best-fitting circular disks.
We find numerically a good match between the wavelength-collapsed image and forward-modeled non-eccentric disk models, which show no brightness asymmetry. However, as evidenced by Figure 2, the HIP 79977 disk appears to exhibit asymmetrical brightness. The east side of the disk is clearly brighter than the west side in band, and less clearly so in others. This brightness asymmetry may also be present in SCExAO/HiCIAO band data from 2016 (Figure 1c). This suggests that it may not be an artifact of the data or processing. Plausible causes of the disk asymmetry are discussed in Section 6.
5 HIP 79977 Disk Surface Brightness Profile and Colors
Next, we computed the surface brightness profile of the HIP 79977 disk in the , , and bands. We began by using the satellite speckles (the PSF core was hidden by a coronagraph, but the flux of the satellite speckles was given by Equation 1) and knowledge of the star’s spectral type to spectrophotometrically calibrate the data cube. Second, we rotated the image so that the disk’s spine was approximately horizontal and then fitted modified Gaussian functions along the disk in order to find the spine’s location with greater precision. We then fit a fourth-order polynomial to these positions in order to smooth them and used this fit as the trace of the disk in the subsequent steps. Next, we merged the appropriate spectral channels to produce images equivalent to , , and bands and calculated a nominal surface brightness in each band along the disk’s spine at radial intervals of one PSF footprint. Uncertainties were calculated using the technique described in Section 2. We divided the post-PSF-subtraction best-fitting synthetic model disk by the pre-PSF-subtraction version in order to produce a map of the attenuation that occurred during the PSF subtraction. The PSF subtraction attenuated the disk spine by typically , and the attenuation increased with vertical displacement from the disk. Finally, we scaled the nominal surface brightnesses by to the attenuation map.
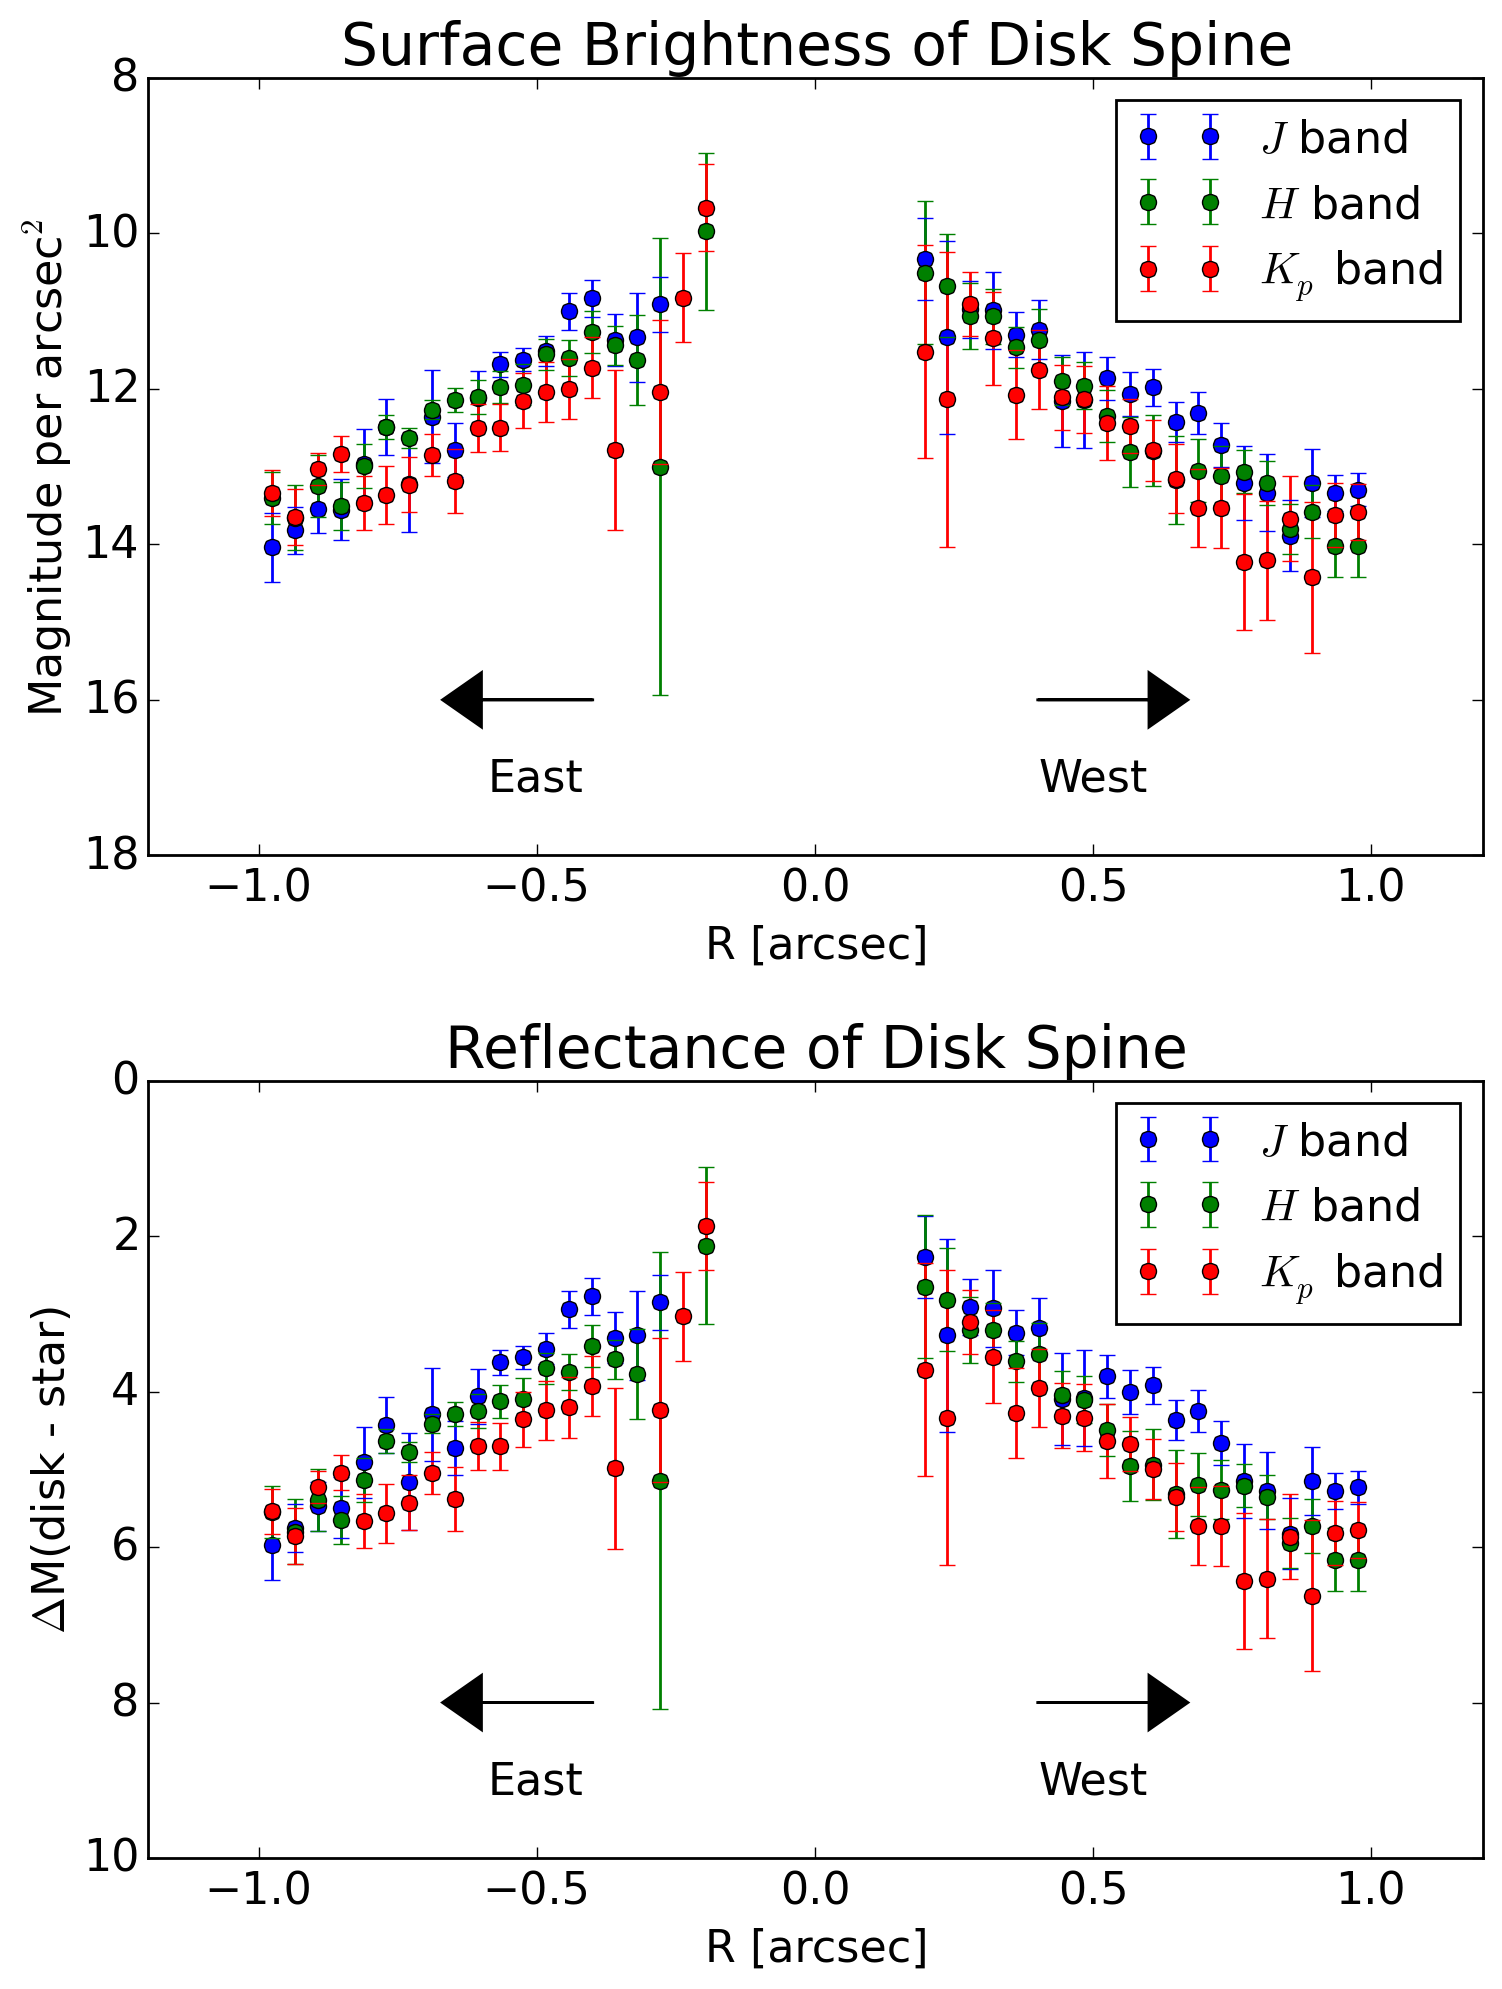
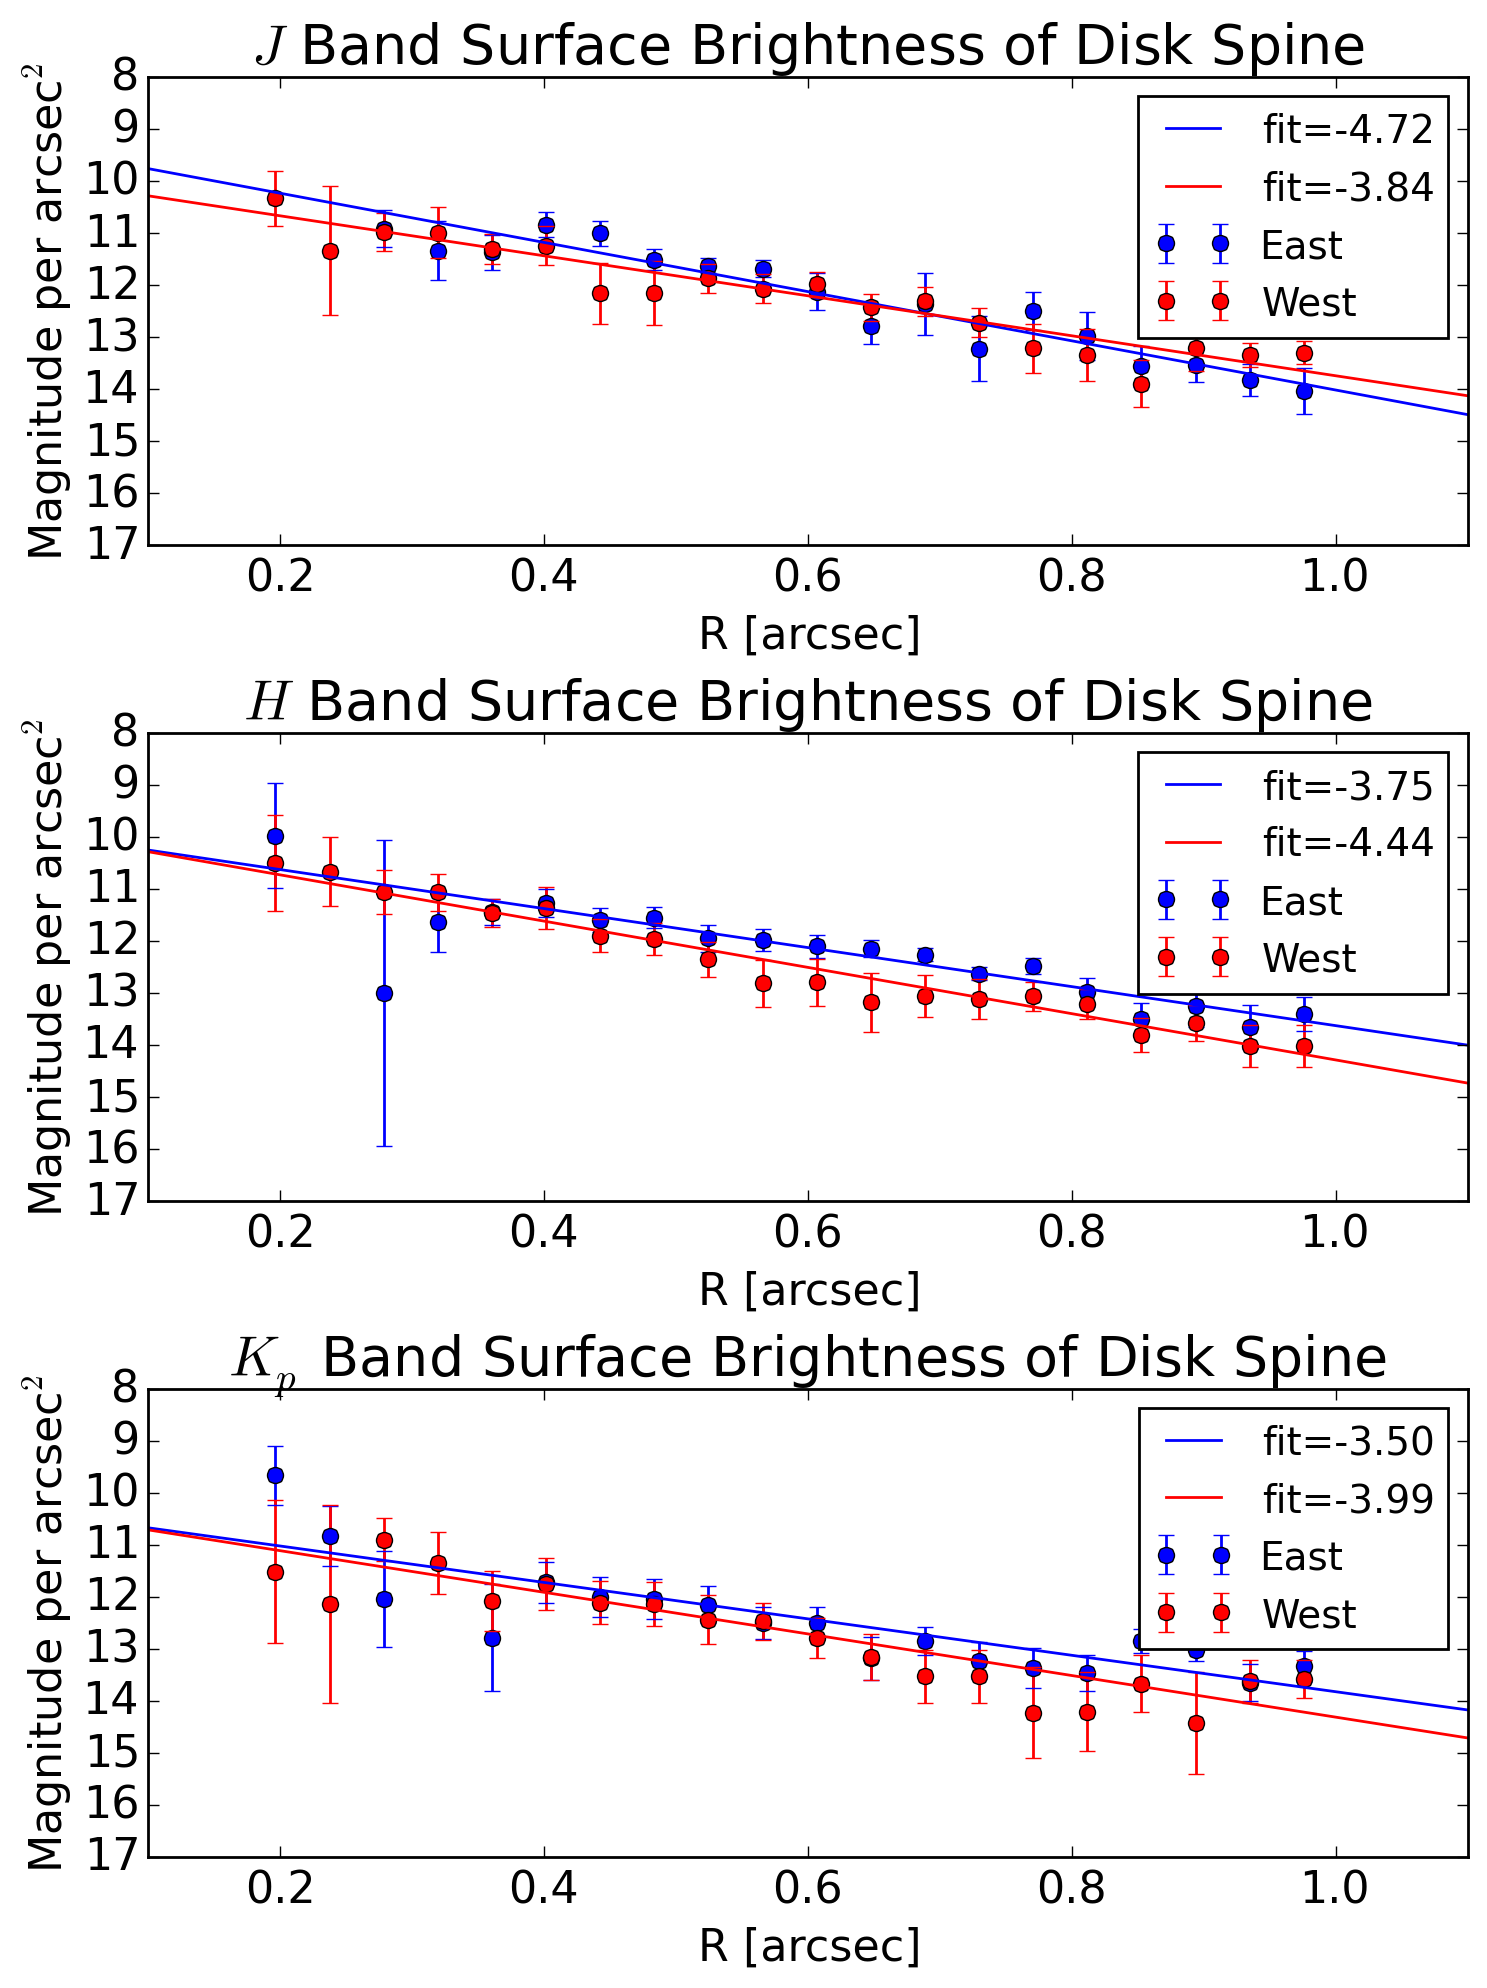
Figures 7 and 8 show the surface brightnesses/reflectance on the east and west sides of the disk for the three color bands. The uncertainties decrease significantly at radial separations of 025. These measurements extend the surface brightness measurements inward from those calculated by Thalmann et al. (2013). The reflectance of the disk (surface brightness magnitudes - star’s magnitudes) is slightly ( magnitude) blue at most radial separations. Figure 8 clearly shows the excess band brightness of the east side of the disk compared to that of the west side. This asymmetry appears present at band at a smaller inner separation and is marginal but plausible at band at a larger separation. The disk’s surface brightness radial profile can be well fit with a power law with an exponential decay term of .
6 Discussion
Our improved signal to noise and inner working angle compared to those of previous work enabled us to better constrain HIP 79977’s disk parameters. Our fitted parameters agreed with those derived by Engler et al. (2017) within except for the fiducial radius, which differs by (this takes into account the different distance they assumed). While our picture of the disk qualitatively agrees with much of that from the discovery paper (Thalmann et al., 2013), we exclude some of the parameter space for dust scattering that they find (e.g. = 0.4) and find a larger disk radius than they adopted in their paper ( au).
Thalmann et al. (2013) also note a candidate point source-like emission peak located 05 from the star, which appeared after subtracting their best-fit disk model. They posited that, if confirmed, this peak could be a localized clump of debris or thermal emission from a planet444SCExAO is a rapidly evolving platform that achieved a significant performance gain in the months after our data were taken (O. Guyon, T. Currie, 2018 unpublished). Thus, we defer discussion of limits on direct planet detections for a future HIP 79977 paper reporting new, substantially better data.. While our rereduction of the Thalmann et al. data likewise show this emission, it does not appear in the SCExAO/CHARIS data (Figure 9) nor in the 2016 SCExAO/HiCIAO data. Given that both SCExAO data sets yield significantly deeper contrasts, we conclude that the emission peak seen in AO188 data is likely residual speckle noise whose brightness highlights the stiff challenges in interpreting high-contrast imaging data where significant residual noise remains.
| Star Name | Other | Age | H-G Parameter | Inclination | References | |
|---|---|---|---|---|---|---|
| Name | (Myr) | (au) | ||||
| HD 146897 | HIP 79977 | 11 | 53 | 0.6 | 84.6 | Thalmann et al. (2013), this work |
| GSC 0739-00759 | - | 23 | 70 | 0.50 | 83 | Sissa et al. (2018) |
| HD 15115 | HIP 11360 | 100 | 90 | 0.25 | 86.2 | Kalas et al. (2007b), Mazoyer et al. (2014) |
| HD 36546 | HIP 26062 | 3-10 | 85 | 0.85 | 75 | Currie et al. (2017b) |
| HD 39060 | Pic | 23 | 24–140 | 0.74 | 85.2 | Smith & Terrile (1984), |
| Millar-Blanchaer et al. (2015) | ||||||
| HD 95086 | HIP 53524 | 17 | 100–300 | - | Chauvin et al. (2018) | |
| HD 106906 | HIP 59960 | 13 | 65 | 0.6 | 85.3 | Lagrange et al. (2016) |
| HD 109573 | HR 4796A | 10 | 77 | –aaNote that a Henyey-Greenstein scattering function fails to reproduce this disk’s scattering phase function (Milli et al., 2017). See Discussion. | 76.5 | Schneider et al. (1999), Milli et al. (2017) |
| HD 110058 | HIP 61782 | 17 | 32 | - | 90? | Kasper et al. (2015) |
| HD 111520 | HIP 62657 | 17 | 40-75 | - | 88? | Draper et al. (2016) |
| HD 114082 | HIP 64184 | 16 | 26-31bbWahhaj et al. (2016) reported values for three different data reductions, and we summarized their range of outcomes. Also, instead of parameterizing the disk with , inside and outside of which the disk drops off in brightness, they assumed constant brightness between and , with falloff outside this range, and fit for both parameters. We reported their mean ring thickness . | 0.07-0.23bbWahhaj et al. (2016) reported values for three different data reductions, and we summarized their range of outcomes. Also, instead of parameterizing the disk with , inside and outside of which the disk drops off in brightness, they assumed constant brightness between and , with falloff outside this range, and fit for both parameters. We reported their mean ring thickness . | 82.3 | Wahhaj et al. (2016) |
| HD 115600 | HIP 64995 | 15 | 48 | 0 | 79.5 | Currie et al. (2015) |
| HD 120326 | HIP 67497 | 16 | 59, 130ccBonnefoy et al. (2017) detected two rings around HIP 67497 and modeled for both of them. | 0.82, -ccBonnefoy et al. (2017) detected two rings around HIP 67497 and modeled for both of them. | 80 | Bonnefoy et al. (2017) |
| HD 129590 | HIP 72070 | 10-16 | 59 | 0.43 | 75 | Matthews et al. (2017) |
| HD 131835 | HIP 73145 | 15 | 90 | 0.15 | 75.1 | Hung et al. (2015), Feldt et al. (2017) |
| HD 181327 | HIP 95270 | 23 | 88 | 0.3ddIn their discovery paper, Schneider et al. (2006) reported that HD 181327 had au and . Later data modeled by Schneider et al. (2014) found au and surface brightness asymmetries that were not well parameterized by a Henyey-Greenstein scattering function (see also Stark et al., 2014). | 31.7 | Schneider et al. (2006), |
| Schneider et al. (2014) | ||||||
| HD 197481 | AU Mic | 23 | 40-50 | eeAu Mic has been extensively studied since Graham et al. (2007). However, publications since then then have stopped fitting for and and have instead focused on characterization of finer structures in the disk (e.g. Boccaletti et al., 2018). | 90? | Kalas et al. (2004), Graham et al. (2007) |
| TWA 7 | CE Ant | 10 | 25 | 0.63 | 13 | Choquet et al. (2016), Olofsson et al. (2018) |
| TWA 25 | V1249 Cen | 7-13 | 78 | 0.7 | 75 | Choquet et al. (2016) |
Note. — References are given for the first peer-reviewed publication of resolved optical/NIR imaging of the disk and the most recent paper that fitted for and . We report the age and best-fitting values of and from the second cited paper, unless there has only been one publication, in which case we use its values.
Table 2 casts the derived dust scattering properties and radius for HIP 79977’s debris disk within the context of other scattered light resolved debris disks around young (5–30 Myr old) stars that have been observed at near-infrared wavelengths. Our derived value of the Henyey-Greenstein parameter () falls in the middle to upper end of the range observed for other debris disks resolved in scattered light around 5–30 Myr old stars. The fiducial radius of the HIP 79977 disk is fairly typical of values measured for other debris disks. Taking both parameters together, the location and dust scattering properties of the HIP 79977 disk appear most similar to that for HD 106906 (Lagrange et al., 2016), GSC 07396-00759 (Sissa et al., 2018), and TWA 25 (Choquet et al., 2016). In particular, HD 106906’s disk is likewise best modeled (within the Henyey-Greenstein formalism) by strongly forward-scattering dust and exhibits a clear east-west brightness asymmetry, similar to what our data hint at for HIP 79977.
However, HIP 79977’s derived dust scattering parameter need not imply that its dust is intrinsically more forward-scattering than that of other young, resolved debris disks. Early studies employing a single Henyey-Greenstein scattering function implied neutral dust grains ( 0.16 Schneider et al., 2009; Thalmann et al., 2011). However, more recent analysis based on extreme-AO observations probing small scattering angles showed that the disk’s scattering function is not well-fit by a single Henyey-Greenstein parameterization but by a weighted combination of a strongly forward-scattering and strongly backward-scattering H-G component (Milli et al., 2017). Further improvements to scattering phase functions may require departures from standard Mie theory, e.g. Distribution of Hollow Spheres (e.g. Milli et al., 2017).
Furthermore, as shown in Hughes et al. (2018), the derived H-G value strongly correlates with the range of probed scattering angles: the closer to the forward-scattering peak probed by the data, the higher the derived value. Indeed, all of the ostensibly strongly forward-scattering disks listed in Table 2 are highly inclined, where such small angles are accessible. If there is little intrinsic difference in the scattering properties of young debris disks, then a single scattering phase function (e.g. Hong, 1985) should be able to reproduce the available data. On the other hand, higher quality data for other ostensibly neutral scattering disks like HD 115600 (Currie et al., 2015) should likewise reveal a forward-scattering component inconsistent with the Henyey-Greenstein formalism.
The disk flux in our images is scattered primarily by dust grains that are micron-sized and larger. Grains much smaller than our observing wavelengths scatter light isotropically, whereas larger grains preferentially forward scatter light (Hughes et al., 2018). Therefore, if the disk was dominated by grains with sizes smaller than a micron, we would not expect to have observed the forward scattering that we did. On the other hand, grains smaller than the observing wavelength scatter light in the Rayleigh regime and should produce blue colors, which is nominally more consistent with our results. The quality of our data limits our ability to make further inferences about the dust properties; the disk’s dust properties could be better constrained by resolved spectra with higher signal to noise than our observations or multi-band polarimetric analysis.
A possible brightness asymmetry appears in at least H band and seems plausible from the 2016 HiCIAO data (Figure 1c) and is broadly consistent with the ALMA dust continuum image probing much larger grains, which may show a slight asymmetry as well (see Figure 1 in Lieman-Sifry et al., 2016). However, it will require confirmation with additional data sets of greater depth. If confirmed, there are several plausible physical explanations for this emission asymmetry. An eccentric disk could the east side of the disk closer to us and appear brighter, although our forward-modeling suggests that the disk is consistent with having zero eccentricity thus far. Alternatively, brightness asymmetries visible in a single band could identify compositional gradients across the disk (Debes et al., 2008); collisions of the debris in the disk could produce lumpiness and anisotrophies of brightness, and these would fade away on the dynamical timescale of the disk. While Engler et al. (2017) did not identify this brightness asymmetry, their data were at optical wavelengths and in polarized intensity.
The surface brightness power law measured in Section 5 is consistent with the disk model proposed by Strubbe & Chiang (2006). They suggest that at the fiducial radius , micron-size grains are produced by the collisions of parent bodies with circular orbits. Outward of this radius lie grains large enough to remain gravitationally bound to the star but having orbits that have become eccentric due to stellar winds and radiation pressure from the star. This model produces a surface brightness profile that drops off beyond the fiducial radius as , where . This agrees with our measured value of .
Since the acquisition of the data presented in this paper, SCExAO has achieved significant performance improvements, reaching in excess of 90% Strehl at 1.6 for bright stars (Currie et al., 2018b). Thus, future, deeper SCExAO/CHARIS observations of HIP 79977 will enable a more robust characterization of the HIP 79977 disk’s morphology and access the inner 025 with higher signal to noise. Multi-wavelength photometry obtained from these data can identify color gradients in the disk possibly traceable to different dust properties (e.g. Debes et al., 2008). These photometric points, complementary imaging, and spatially-resolved spectra can provide crucial insights into how the morphology and composition of HIP 79977’s debris disk compare to the Kuiper belt and other debris disks probing the epoch of icy planet formation (e.g. Currie et al., 2015; Rodigas et al., 2015; Milli et al., 2017).
References
- Augereau et al. (1999) Augereau, J. C., Lagrange, A. M., Mouillet, D., Papaloizou, J. C. B., & Grorod, P. A. 1999, A&A, 348, 557
- Boccaletti et al. (2018) Boccaletti, A., Sezestre, E., Lagrange, A. M., et al. 2018, ArXiv e-prints, arXiv:1803.05354
- Bonnefoy et al. (2017) Bonnefoy, M., Milli, J., Ménard, F., et al. 2017, A&A, 597, L7
- Brandt et al. (2013) Brandt, T. D., McElwain, M. W., Turner, E. L., et al. 2013, ApJ, 764, 183
- Brandt et al. (2017) Brandt, T. D., Rizzo, M., Groff, T., et al. 2017, Journal of Astronomical Telescopes, Instruments, and Systems, 3, 048002
- Chauvin et al. (2018) Chauvin, G., Gratton, R., Bonnefoy, M., et al. 2018, ArXiv e-prints, arXiv:1801.05850
- Chen et al. (2011) Chen, C. H., Mamajek, E. E., Bitner, M. A., et al. 2011, ApJ, 738, 122
- Choquet et al. (2016) Choquet, É., Perrin, M. D., Chen, C. H., et al. 2016, ApJ, 817, L2
- Currie et al. (2017a) Currie, T., Brittain, S., Grady, C. A., Kenyon, S. J., & Muto, T. 2017a, Research Notes of the American Astronomical Society, 1, 40
- Currie et al. (2008) Currie, T., Kenyon, S. J., Balog, Z., et al. 2008, ApJ, 672, 558
- Currie et al. (2015) Currie, T., Lisse, C. M., Kuchner, M., et al. 2015, ApJ, 807, L7
- Currie et al. (2011) Currie, T., Burrows, A., Itoh, Y., et al. 2011, ApJ, 729, 128
- Currie et al. (2012) Currie, T., Debes, J., Rodigas, T. J., et al. 2012, ApJ, 760, L32
- Currie et al. (2014) Currie, T., Muto, T., Kudo, T., et al. 2014, ApJ, 796, L30
- Currie et al. (2017b) Currie, T., Guyon, O., Tamura, M., et al. 2017b, ApJ, 836, L15
- Currie et al. (2018a) Currie, T., Kasdin, N. J., Groff, T. D., et al. 2018a, Publications of the Astronomical Society of the Pacific, 130, 044505
- Currie et al. (2018b) Currie, T., Brandt, T. D., Uyama, T., et al. 2018b, AJin press
- Debes et al. (2008) Debes, J. H., Weinberger, A. J., & Schneider, G. 2008, ApJ, 673, L191
- Draper et al. (2016) Draper, Z. H., Duchêne, G., Millar-Blanchaer, M. A., et al. 2016, ApJ, 826, 147
- Engler et al. (2017) Engler, N., Schmid, H. M., Thalmann, C., et al. 2017, A&A, 607, A90
- Feldt et al. (2017) Feldt, M., Olofsson, J., Boccaletti, A., et al. 2017, A&A, 601, A7
- Fitzgerald et al. (2007) Fitzgerald, M. P., Kalas, P. G., Duchêne, G., Pinte, C., & Graham, J. R. 2007, ApJ, 670, 536
- Gaia Collaboration (2018) Gaia Collaboration. 2018, VizieR Online Data Catalog, I/345
- Garcia et al. (2017) Garcia, E. V., Currie, T., Guyon, O., et al. 2017, ApJ, 834, 162
- Golimowski et al. (2006) Golimowski, D. A., Ardila, D. R., Krist, J. E., et al. 2006, AJ, 131, 3109
- Graham et al. (2007) Graham, J. R., Kalas, P. G., & Matthews, B. C. 2007, ApJ, 654, 595
- Groff et al. (2013) Groff, T. D., Peters, M. A., Kasdin, N. J., et al. 2013, in Proc. SPIE, Vol. 8864, Techniques and Instrumentation for Detection of Exoplanets VI, 88640H
- Henyey & Greenstein (1941) Henyey, L. G., & Greenstein, J. L. 1941, ApJ, 93, 70
- Hong (1985) Hong, S. S. 1985, A&A, 146, 67
- Hughes et al. (2018) Hughes, A. M., Duchene, G., & Matthews, B. 2018, ArXiv e-prints, arXiv:1802.04313
- Hung et al. (2015) Hung, L.-W., Duchêne, G., Arriaga, P., et al. 2015, ApJ, 815, L14
- Jovanovic et al. (2015a) Jovanovic, N., Guyon, O., Martinache, F., et al. 2015a, ApJ, 813, L24
- Jovanovic et al. (2015b) Jovanovic, N., Martinache, F., Guyon, O., et al. 2015b, PASP, 127, 890
- Kalas et al. (2007a) Kalas, P., Duchene, G., Fitzgerald, M. P., & Graham, J. R. 2007a, ApJ, 671, L161
- Kalas et al. (2007b) Kalas, P., Fitzgerald, M. P., & Graham, J. R. 2007b, ApJ, 661, L85
- Kalas et al. (2005) Kalas, P., Graham, J. R., & Clampin, M. 2005, Nature, 435, 1067
- Kalas et al. (2006) Kalas, P., Graham, J. R., Clampin, M. C., & Fitzgerald, M. P. 2006, ApJ, 637, L57
- Kalas et al. (2004) Kalas, P., Liu, M. C., & Matthews, B. C. 2004, Science, 303, 1990
- Kasper et al. (2015) Kasper, M., Apai, D., Wagner, K., & Robberto, M. 2015, ApJ, 812, L33
- Kenyon & Bromley (2008) Kenyon, S. J., & Bromley, B. C. 2008, ApJS, 179, 451
- Lagrange et al. (2010) Lagrange, A.-M., Bonnefoy, M., Chauvin, G., et al. 2010, Science, 329, 57
- Lagrange et al. (2012) Lagrange, A.-M., Boccaletti, A., Milli, J., et al. 2012, A&A, 542, A40
- Lagrange et al. (2016) Lagrange, A. M., Langlois, M., Gratton, R., et al. 2016, A&A, 586, L8
- Lieman-Sifry et al. (2016) Lieman-Sifry, J., Hughes, A. M., Carpenter, J. M., et al. 2016, ApJ, 828, 25
- Marois et al. (2006) Marois, C., Lafrenière, D., Doyon, R., Macintosh, B., & Nadeau, D. 2006, ApJ, 641, 556
- Marois et al. (2008) Marois, C., Macintosh, B., Barman, T., et al. 2008, Science, 322, 1348
- Matthews et al. (2017) Matthews, E., Hinkley, S., Vigan, A., et al. 2017, ApJ, 843, L12
- Mazoyer et al. (2014) Mazoyer, J., Boccaletti, A., Augereau, J. C., et al. 2014, A&A, 569, A29
- Millar-Blanchaer et al. (2015) Millar-Blanchaer, M. A., Graham, J. R., Pueyo, L., et al. 2015, ApJ, 811, 18
- Milli et al. (2017) Milli, J., Vigan, A., Mouillet, D., et al. 2017, A&A, 599, A108
- Minowa et al. (2010) Minowa, Y., Hayano, Y., Oya, S., et al. 2010, in Society of Photo-Optical Instrumentation Engineers (SPIE) Conference Series, Vol. 7736, Society of Photo-Optical Instrumentation Engineers (SPIE) Conference Series, 3
- Mustill & Wyatt (2009) Mustill, A. J., & Wyatt, M. C. 2009, MNRAS, 399, 1403
- Nielsen et al. (2012) Nielsen, E. L., Liu, M. C., Wahhaj, Z., et al. 2012, ApJ, 750, 53
- Olofsson et al. (2018) Olofsson, J., van Holstein, R. G., Boccaletti, A., et al. 2018, ArXiv e-prints, arXiv:1804.01929
- Pecaut et al. (2012) Pecaut, M. J., Mamajek, E. E., & Bubar, E. J. 2012, ApJ, 746, 154
- Peters et al. (2012) Peters, M. A., Groff, T., Kasdin, N. J., et al. 2012, in Proc. SPIE, Vol. 8446, Ground-based and Airborne Instrumentation for Astronomy IV, 84467U
- Pueyo (2016) Pueyo, L. 2016, ApJ, 824, 117
- Rodigas et al. (2014) Rodigas, T. J., Debes, J. H., Hinz, P. M., et al. 2014, ApJ, 783, 21
- Rodigas et al. (2015) Rodigas, T. J., Stark, C. C., Weinberger, A., et al. 2015, ApJ, 798, 96
- Schneider et al. (2005) Schneider, G., Silverstone, M. D., & Hines, D. C. 2005, ApJ, 629, L117
- Schneider et al. (2009) Schneider, G., Weinberger, A. J., Becklin, E. E., Debes, J. H., & Smith, B. A. 2009, AJ, 137, 53
- Schneider et al. (1999) Schneider, G., Smith, B. A., Becklin, E. E., et al. 1999, ApJ, 513, L127
- Schneider et al. (2006) Schneider, G., Silverstone, M. D., Hines, D. C., et al. 2006, ApJ, 650, 414
- Schneider et al. (2014) Schneider, G., Grady, C. A., Hines, D. C., et al. 2014, AJ, 148, 59
- Service et al. (2016) Service, M., Lu, J. R., Campbell, R., et al. 2016, PASP, 128, 095004
- Sissa et al. (2018) Sissa, E., Olofsson, J., Vigan, A., et al. 2018, ArXiv e-prints, arXiv:1804.02882
- Smith & Terrile (1984) Smith, B. A., & Terrile, R. J. 1984, Science, 226, 1421
- Soummer et al. (2012) Soummer, R., Pueyo, L., & Larkin, J. 2012, ApJ, 755, L28
- Soummer et al. (2014) Soummer, R., Perrin, M. D., Pueyo, L., et al. 2014, ApJ, 786, L23
- Stark et al. (2014) Stark, C. C., Schneider, G., Weinberger, A. J., et al. 2014, ApJ, 789, 58
- Strubbe & Chiang (2006) Strubbe, L. E., & Chiang, E. I. 2006, ApJ, 648, 652
- Thalmann et al. (2011) Thalmann, C., Janson, M., Buenzli, E., et al. 2011, ApJ, 743, L6
- Thalmann et al. (2013) Thalmann, C., Janson, M., Buenzli, E., et al. 2013, AJ, 763, L29
- van Leeuwen (2007) van Leeuwen, F. 2007, A&A, 474, 653
- Wahhaj et al. (2016) Wahhaj, Z., Milli, J., Kennedy, G., et al. 2016, A&A, 596, L4
- Wyatt (2008) Wyatt, M. C. 2008, ARA&A, 46, 339