Variations between Dust and Gas in the Diffuse Interstellar Medium. 3. Changes in Dust Properties
Abstract
We study infrared emission of 17 isolated, diffuse clouds with masses of order , to test the hypothesis that grain property variations cause the apparently low gas-to-dust ratios that have been measured in those clouds. Maps of the clouds were constructed from WISE data and directly compared to the maps of dust optical depth from Planck. The mid-infrared emission per unit dust optical depth has a significant trend toward lower values at higher optical depths. The trend can be quantitatively explained by extinction of starlight within the clouds. The relative amounts of PAH and very small grains traced by WISE, compared to large grains tracked by Planck, are consistent with being constant. The temperature of the large grains significantly decreases for clouds with larger dust optical depth; this trend is partially due to dust property variations but is primarily due to extinction of starlight. We updated the prediction for molecular hydrogen column density, taking into account variations in dust properties, and find it can explain the observed dust optical depth per unit gas column density. Thus the low gas-to-dust ratios in the clouds are most likely due to ‘dark gas’ that is molecular hydrogen.
1 Introduction
The nature and content of interstellar clouds can be measured through various tracers including the 21-cm line of atomic hydrogen, far-infrared emission of dust, microwave emission lines of CO, ultraviolet and optical absorption lines, extinction by dust, and -rays. These diverse tracers reveal material with the range of physical conditions and geometrical observing conditions in which they apply, leading to an overall understanding of the transition in the interstellar medium between low-density ionized gas, diffuse atomic gas, translucent clouds, dark clouds, and giant molecular clouds (Snow & McCall, 2006). The relative amount of atomic and molecular material in the diffuse and translucent clouds, where H2 molecules form on dust grain surfaces with column density limited by destruction from ultraviolet photons in the interstellar radiation field (Hollenbach et al., 1971), remains uncertain at the factor of 2 level because H2 is not readily directly observed (Bolatto et al., 2013). We initiated a study of isolated, approximately degree-sized, approximately , interstellar clouds that allow clear separation between the cloud and the unrelated diffuse interstellar medium and that have a range of brightnesses and locations across the sky. We showed in Paper 1 (Reach et al., 2015) that such clouds have a wide range of gas-to-dust ratios. To explain them, we asserted three hypotheses:
-
(1)
The amount of gas was underestimated due to the presence of extensive molecular hydrogen not accounted for by the 21-cm observations of .
-
(2)
The amount of gas was underestimated due to the 21-cm line being optically thick.
-
(3)
The amount of dust was overestimated by the submm opacity because of variations in the dust properties.
In all cases we retain the ansatz that the actual gas-to-dust mass ratio remains constant, which is quite likely because there are no evident local sources of dust in the clouds nor mechanisms to separate the gas from dust. Recent theoretical work supports that interstellar grains remain closely coupled to the gas even in molecular clouds (and even neglecting magnetic fields), with only rare grains larger than 1 m sized grains experiencing significant segregation (Tricco et al., 2017). We fully expect that all three hypotheses are active, and our goal is to measure the relative importance of each. Paper 1 showed a simple analytical calculation (from Reach et al., 1994) for the formation of molecular hydrogen and showed that hypothesis (1) could match the observations with no free parameters. In Paper 2 (Reach et al., 2017), we showed, from 21-cm absorption observations toward radio continuum sources behind the clouds, that an apparently low gas-to-dust ratio could not be fully explained by cold atomic gas, because there is not enough opacity measured in the 21-cm line. While there is clearly some cold, atomic gas that explains a small part of the high specific opacity, Paper 2 effectively ruled out hypothesis (2). In this paper, we test hypothesis (3).
The initial sample for comparison between far-infrared dust and H I gas distribution defined in Paper 1; that sample was restricted to the Arecibo declination range. We maintained that sample for Paper 2, which again used Arecibo 21-cm observations (of absorption this time). For this paper, we expand the sample to have a more diverse set of clouds for studying potential dust property variations. The supplemental clouds are from Heiles et al. (1988), where isolated, degree-sized clouds were identified from inspection of the IRAS 100 m images and the all-sky H I images at half-degree resolution. To further diversify the sample, we added DIR015+54, which has a distinctively warmer dust temperature than other high-latitude clouds, despite having no internal heating source (Reach et al., 1998).
For all clouds, we used maps of the dust opacities at resolution from the Planck (Tauber et al., 2010) survey, specifically the ‘thermal dust’ foreground separation (Planck Collaboration et al., 2014a), to compare to mid-infrared emission maps from the Wide Field Infrared Survey Explorer (WISE) all-sky survey (Wright et al., 2010), specifically the WISE Image Atlas served through the Infrared Science Archive.
2 Properties of Large Grains
Models for interstellar grain optical properties and size distribution have been developed to simultaneously fit the UV/optical/near-infrared extinction and the thermal emission from diffuse interstellar lines of sight. Recent models include that of Li & Draine (2001) that comprises solid particles of ‘astronomical silicate’ and carbonaceous material supplemented by polycyclic aromatic hydrocarbons (PAHs), and that of Jones et al. (2013) that comprises silicate and carbonaceous particles with mantles of varying depth. When tuned to match a single environment, the models can match the observations and provide largely self-consistent assessments of abundances of elements that compose the grains, together with predicted observables at a wide range of wavelengths.
To utilize dust models in environments other than where they were fitted requires assuming dust properties remain unchanged. This can be tested observationally. Some of the first submm observations of interstellar clouds by PRONAOS showed that the apparent dust emissivity is significantly (factor-of-three) enhanced in molecular clouds compared to the diffuse interstellar material (Stepnik et al., 2003). In the well-characterized Taurus molecular cloud, far-infrared observations with Spitzer and submm observations with Planck showed a factor-of-two increase in specific opacity in the molecular regions compared to atomic regions (Flagey et al., 2009; Planck Collaboration et al., 2011b). Planck Collaboration et al. (2011a) studied 14 large high-latitude fields, comparing dust emission to dedicated observations of the 21-cm line with the Green Bank Telescope, and they found significant variation. Variations in dust properties were conclusively demonstrated by Planck Collaboration et al. (2014c), who showed that even in low column density, high-latitude lines of sight, where there are no variations of radiation field due to extinction or local heating sources, there is a clear trend of specific dust opacity versus temperature. The quantity that is directly observable is the specific opacity, which is the optical depth per unit gas column density,
| (1) |
where is the optical depth at a convenient reference frequency of 353 GHz (equivalent to a wavelength of 850 m), and is the gas column density (from H I 21-cm line observations and, where available, CO observations converted to H2 column density and doubled). The value of is derived by correlation between dust and gas observations scaled to identical spacial scales. To convert the specific opacity to other frequencies requires scaling by the frequency, which in the far-infrared and submm is normally expressed as a power law
| (2) |
even though in reality materials could have a more complex frequency dependence of absorption cross-section. The dust models mentioned above were developed to match the specific opacity in the diffuse interstellar medium; the model of Li & Draine (2001) matches the observed, typical specific opacity with a gas-to-dust mass ratio of 124 and usage of the elements in accord with cosmic abundances and observed depletions of those elements into grains.
Now that the Planck results have been studied by multiple groups and validated, the interstellar dust models will need to be updated. The empirical trends that will drive the most significant updates include the trend of specific opacity with dust temperature (Planck Collaboration et al., 2014c, 2011a) and the discrepancy in the ratio of far-infrared to visible optical depth (Planck Collaboration et al., 2016). The former directly affects the inferred amount of gas for a given amount of dust, and the latter would affect the temperatures of the grains, which absorb visible-UV light and emit in the far-infrared. A first systematic evaluation of the models by Fanciullo et al. (2015) already shows that the observational results cannot be explained by a uniform dust properties, even with variable illumination by the interstellar radiation field.
In Paper 1, we measured the specific opacities of a set of high-latitude clouds with high-resolution 21-cm observations from Arecibo. For convenience, we converted the specific opacities into gas-to-dust ratios using the Li & Draine (2001) model:
| (3) |
In this paper we prefer the model-independent observable , but as equation 3 shows, the gas-to-dust ratios are readily converted back to .
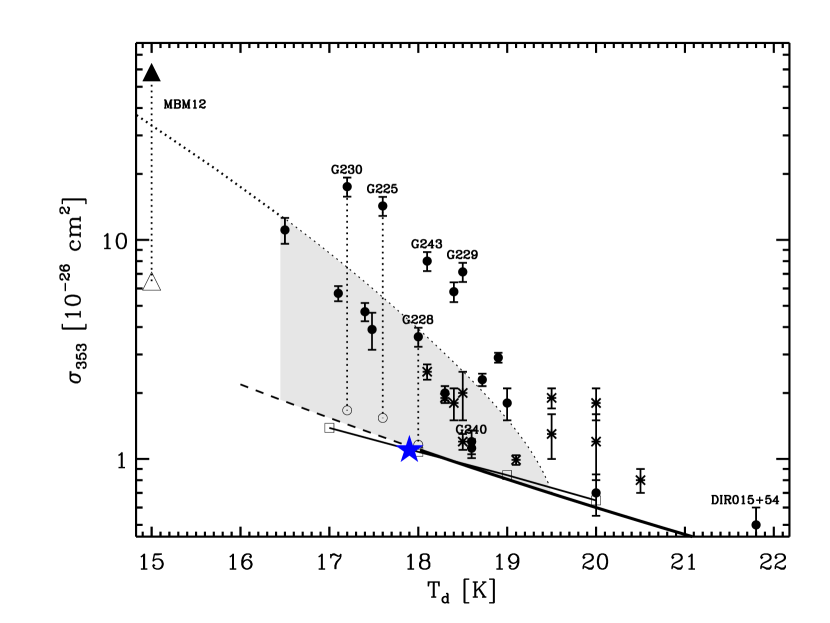
Figure 1 shows the specific opacity for the clouds versus their dust temperature. The specific opacities are adapted from the gas-to-dust ratios in Paper 1 as per equation 3. The dust temperatures were measured for all clouds by fitting a modified blackbody to the surface brightness from IRAS and Planck at frequencies 3000 to 353 GHz (wavelengths 100 to 850 m) as described in Planck Collaboration et al. (2014b). The main results from Papers 1 and 2 were measurement of the change in apparent gas-to-dust ratio and demonstration that coherent regions in interstellar clouds have either either ‘dark’ gas or dust property evolution toward higher specific opacity at low temperatures.
We now compare the cloud observations to recently-published trends in specific opacity due to grain property variations. Figure 1 shows that the apparent trends toward higher specific opacity at lower temperature are in the same general sense for our cloud sample (symbols) as the trend for the diffuse ISM (straight lines). But the apparent trend is significantly more pronounced for our isolated cloud sample than for the diffuse ISM: clouds at low temperature have significantly higher emissivity, as seen by the symbols appearing far above the straight lines. The diffuse ISM does not contain gas colder than approximately 18 K, so to make a direct comparison we extrapolated the dust property variation trend to lower temperatures (straight dashed line). Both of these lines show the trend predicted for regions that have the same total power emission but have dust properties that vary with temperature; such regions would have constant . The approximate power-law fit to the diffuse ISM for is
| (4) |
It is evident the coldest clouds in our sample have specific opacities a factor of few higher than the extrapolated trend of dust properties derived in the diffuse interstellar medium. We therefore conclude that the recently-observed variations in dust properties as a function of temperature explain some but not all of the apparently high specific opacity in isolated high-latitude clouds.
In Paper 1, we demonstrated that a simple analytical model for H2 formation can explain the apparently higher specific opacity in colder clouds. We can now update this calculation (which was our Hypothesis 1 to explain the enhanced specific opacity) taking into account the independently observed trends in dust properties in the diffuse ISM (which could be a lower limit for our Hypothesis 3). The H2 formation model in Paper 1 approximately matched the observations, with essentially no free parameters. Figure 1 shows the updated predictions, where we simply took the model from Paper 1 and scaled the dust specific opacity at each temperature to match equation 4. We did not change the H2 formation rate on grain surfaces as a function of dust properties, though we anticipate such an effect theoretically; a prediction for this effect awaits future laboratory-result-motivated theoretical work. From Figure 1, the model for H2 formation remains consistent with the observations, with the variation in dust properties being a smaller effect than formation of molecular hydrogen.
While the apparent ‘dark gas’ can be plausibly explained by formation of H2 (Hypothesis 1), we must remain open-minded to the possibility that dust property variations could explain even more of the opacity changes, if those dust property variations are much more extreme in our clouds than observed in the diffuse ISM—for example by runaway dust coagulation. In that case, we expect the PAH and very small grains could be coagulated onto the larger grains in the cloud cores. This effect can be directly tested using mid-infrared observations, which is the subject of the next section.
3 Abundance of Small Grains
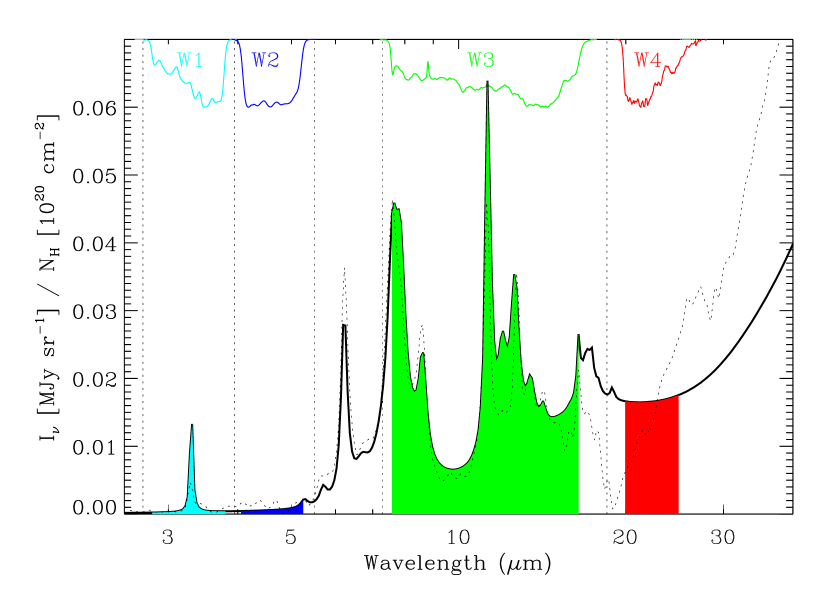
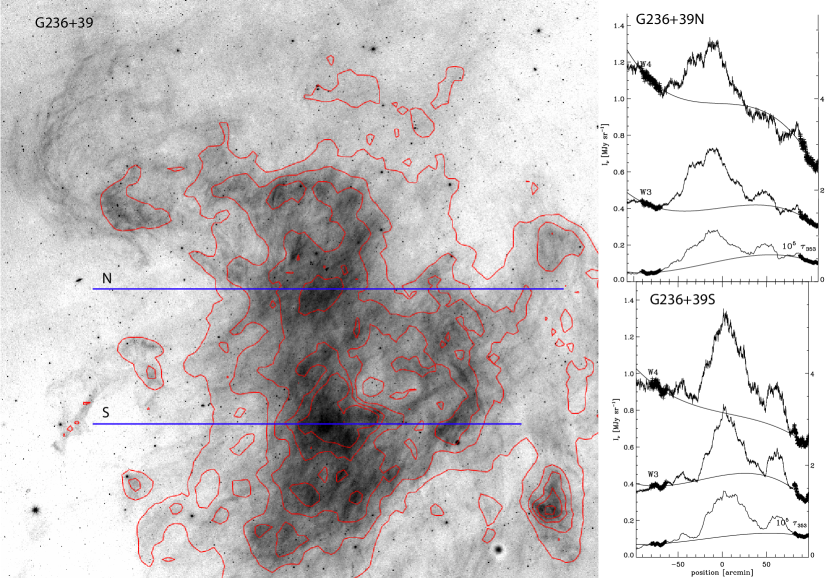
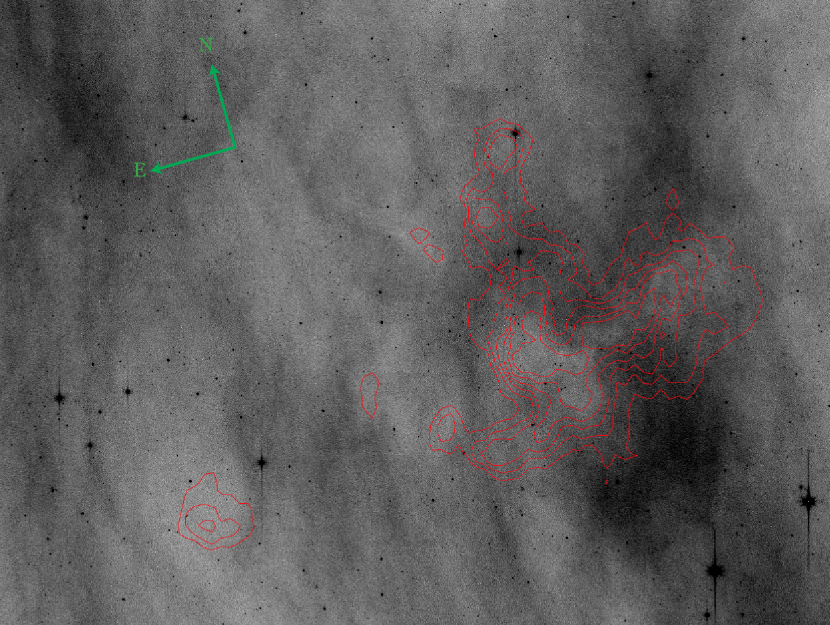
The mid-infrared surface brightness of interstellar clouds is due to non-equilibrium emission from transiently heated particles, as explained e.g. by Draine & Anderson (1985). At wavelengths shorter than 18 m, interstellar emission is predominantly from macromolecules including polycyclic automatic hydrocarbons (PAHs). Figure 2 shows a nominal interstellar spectrum from a dust model tuned to match the observations of the diffuse interstellar emission, as well as the spectrum of reflection nebula NGC 7023, taken from the Infrared Space Observatory archive. The PAH features at 3.3, 6.2, 7.7, 8.6, 11.3, 12.6, and 16–18 m are readily evident, as is the rapid rise toward longer wavelengths due to transiently heated, very small grains (VSGs). To assess the variations in PAH and VSG abundances in interstellar clouds, we will use data from the Wide Field Infrared Explorer (WISE), which surveyed the entire sky in four broad wavebands. Figure 2 shows which part of the interstellar spectrum is sampled by each of the bands. The W1 band contains the 3.3 m PAH feature; W2 has relatively little emission; W3 contains multiple PAH features; and W4 is dominated by steeply rising emission from very small grains (VSG). Because stars and galaxies are so bright and densely populate the sky at the shorter wavelengths, we concentrate on the W3 and W4 bands, which address our primary concern on grain abundance. Both W1 and W2 also contain contributions from ‘cloud shine’ due to scattering of the interstellar radiation field by large particles (Foster & Goodman, 2006; Andersen et al., 2013). Given the difficulty of separating the diffuse emission from stars and galaxies in W1 together with the need to distinguish ‘cloud shine’ from the PAH emission, we do not utilize W1 in this study despite the presence of the 3.28 m feature in that band. Figure Set 3 shows the WISE band 3 images of each cloud, and the clouds are readily evident as being well traced by WISE. The relatively high angular resolution of WISE reveals new details, such as intricate, filamentary structures, which we intend to study in future, detailed studies of individual clouds.
In this paper we concentrate on the comparison between WISE and Planck, with the latter having an angular resolution of . The WISE and Planck images are compared in detail in Figure Set 3. It is evident that WISE and Planck reveal similar cloud morphologies and dynamic ranges of infrared surface brightness and optical depth, making them ideal for studying dust property variations within clouds and from cloud to cloud. The need for expanding the survey beyond that used in Paper 1 is also evident. The clouds from Paper 1 included some in the ecliptic plane (e.g. G254+63), for which the variations in the mid-infrared Solar System dust emission are as large as those of the interstellar clouds. All such clouds can be discerned in the WISE images, though their surface brightness is measured only approximately. The clouds we added to the sample from HRK, on the other hand, were generally brighter and more cleanly separated from unrelated structures.
For each cloud, we extracted the surface brightness along a slice that extends from well outside, through the central concentration, and well out the other side of the cloud. A polynomial baseline was then fitted to the regions outside the cloud in order to remove unrelated interstellar emission. In some cases, this extended emission may indeed be related to the cloud as a diffuse envelope, but we nonetheless remove it in order to generate an identically-determined, differential measurement of the cloud brightness. Figure Set 3 shows the surface brightness profiles in dust optical depth, , and WISE band 3 (W3) and band 4 (W4) brightness. The fine details of the clouds are not considered in this study; differences seen in the brightness profiles are at least partially due to the difference in angular resolution between WISE and Planck.
For each cloud, we correlated the baseline-subtracted WISE surface brightness profile and Planck optical depth profile. Table 1 compiles the results. In all cases the WISE band 4 and 3 brightness correlate very tightly with each other, and slopes, W4/W3 in Table 1, have statistical uncertainty less than 1%. The total uncertainty in W4/W3 is set by the WISE calibration accuracy of 6% at 22 m. The slope of the correlations between WISE surface brightness and large-grain optical depth is the emissivity,
| (5) |
we use MJy sr units for the WISE surface brightnesses at 12 m and 22 m to obtain and , respectively. As should be expected W4/W3 and are similar, with values in the range 0.8–1.5. These quantities were derived by completely different methods, so on a cloud-by-cloud basis there is a standard deviation between the methods of 25%. For the cloud color we recommend the more-precise W4/W3.

| Cloud | aaColumn density of the cloud, based on the Planck optical depth, and cm-2 H-1, and distance 100 pc | bbEstimated average gas density in the cloud, assuming line-of-sight depth is the same as the sky-plane extent, and a distance of 100 pc for each cloud. | W4/W3 | Figure | |||
|---|---|---|---|---|---|---|---|
| (1020 cm-2) | (K) | (cm-3) | ( MJy sr-1) | (MJy sr-1) | |||
| DIR015+54 | 1.1 | 20.6 | 22 | 1.31 | 3.1 | ||
| G86+59 | 1.2 | 20.3 | 23 | 0.70 | 3.2 | ||
| G90.0+38.8 | 20 | 17.9 | 1000 | 1.10 | 3.3 | ||
| G94.8+37.6 | 10 | 18.3 | 550 | 1.29 | 3.3 | ||
| G94-36 | 21 | 16.8 | 160 | 1.45 | 3.4 | ||
| G108-53 | 27 | 16.7 | 600 | 0.92 | 3.5 | ||
| G135+54 | 4.0 | 19.8 | 86 | 1.64 | 3.6 | ||
| G198+32 | 16 | 17.8 | 200 | 0.79 | 3.7 | ||
| G225.6-66.4 | 18 | 17.4 | 1900 | 1.50 | 3.8 | ||
| G229.0-66.1 | 2.5 | 18.3 | 430 | 0.76 | 3.8 | ||
| G230.1-28.4 | 12 | 17.5 | 550 | 1.09 | 3.9 | ||
| G228.0-28.6 | 14 | 18.1 | 390 | 1.18 | 3.9 | ||
| G236+39S | 6.4 | 18.1 | 240 | 1.12 | 3.10 | ||
| G236+39N | 6.6 | 18.7 | 160 | 1.29 | 3.10 | ||
| G243-66 | 6.2 | 18.3 | 130 | 1.06 | 3.11 | ||
| G249+73 | 15 | 19.0 | 200 | 1.90 | 3.12 | ||
| G254+63 | 7.9 | 19.1 | 160 | 1.41 | 3.13 | ||
| MBM 12 | 130 | 14.2 | 2100 | … | to 0.5 | … | 5 |
3.1 Small grains in a dark cloud: MBM 12
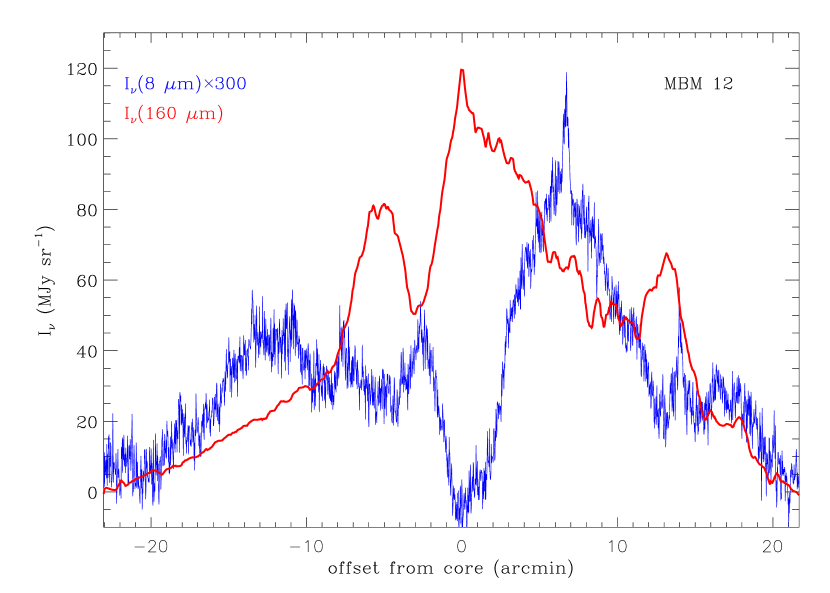
To extend the range of interstellar environments, and to enable comparison to studies large and small grain properties in molecular clouds, we add a dark cloud that has high-quality mid- and far-infrared observations from Spitzer. MBM 12 was discovered in the Palomar plates and confirmed as molecular using mm-wave CO emission (Magnani et al., 1985). This cloud was observed by L. Magnani using Spitzer on 2007 Sep 11 using the InfraRed Array Camera (IRAC; Fazio et al., 2004) and 2007 Sep 23 using the Multiband Infrared Photometer for Spitzer (MIPS; Rieke et al., 2004). The 8 m and 160 m images were obtained from the Spitzer Heritage Archive. Figure 5 compares these images toward the MBM 12 cloud core. The anti-correspondence between the mid and far infrared images is striking. While the 160 m image is relatively straightforward, with a general rise toward the cloud core (including a small number of broad peaks) where the molecular cores are found in CO images (Pound et al., 1990), the 8 m image is filamentary and dispersed with the cloud core evident as a ‘shadow’ where there is no emission.
To measure the dust emission properties quantitatively, and convert to a common scale with our WISE and Planck study, we use the spatial profile shown in Figure 6. Three distinct portions of the cloud can be identified. The cloud ‘edges’ are the low-column density regions near the edge of the image but with significant mid and far infrared emission. The ‘halos’ are the regions with the brightest 8 m emission. The ‘core’ is the center of the cloud, which corresponds in 160 m emission and other column density tracers including CO. In each portion we measure the typical 160 m surface brightness and ratio of 8 m to 160 m brightness. For the cloud core, there is no evident emission so we measure the upper limit. These values are reported in the first columns of Table 2. To compare to the WISE and Planck wavelengths used for the other clouds, we convert units as follows. The 160 m optical depth is determined by dividing the observed brightness by the Planck function evaluated at dust temperature estimated from the Planck images; then the 353 GHz optical depth is determined using a dust emissivity index of 1.75. The dust temperature and inferred optical depth are reported in Table 2. The IRAC brightness was converted to equivalent WISE 12 m surface brightness using a nominal ISM model emission spectrum (Li & Draine, 2001). The resulting emissivity is in the last column of Table 2.
Comparing to the translucent clouds that form our cloud sample, it is clear that the dark cloud MBM 12 is distinct. First, the far-infrared surface brightness and inferred optical depth of MBM 12 is significantly higher than our clouds. Only the cloud edges overlap with our cloud sample, and even these edges only overlap with the brightest parts of our sample clouds. In terms of mid-infrared emissivity, MBM 12 is low throughout. The cloud halos have mid-infrared emissivities that overlap with the weakest our sample clouds. The cloud core is lower by 2 orders of magnitude.
| Portion | |||||
|---|---|---|---|---|---|
| (MJy sr-1) | (K) | ( MJy sr-1) | |||
| Edge | 15. | 0.0033 | 17.0 | 1.6 | 0.17 |
| Halo | 35. | 0.014 | 15.6 | 6.2 | 0.46 |
| Core | 120. | 14.2 | 28 |
4 Discussion
Having compiled the measured mid and far infrared brightness ratios for the clouds, we now discuss what are the systematic trends and implications for dust property evolution in clouds. For context, a plausible scenario for explaining variations in dust properties is an evolution of the mantles of the grains (Jones et al., 2013). The dust evolution would include coagulation of carbonaceous material onto larger grains in colder regions as one process, and the opposite effects of fragmentation and mantle evaporation. Ysard et al. (2015) showed that the range of specific dust opacity could be explained by changes in dust mantle properties, in particular carbonaceous material accumulating onto larger grains and adding an extra 60 ppm of carbon in solid form. Köhler et al. (2015) showed that the timescale for VSG to accumulate onto big grains was less than yr, and they suggest the trends in dust properties are due to the local gas density, which sets timescales and material availability for accretion and coagulation.
4.1 Comparison between grains in isolated clouds and the diffuse ISM
The observational results clearly show a decrease in the emissivity of mid-infrared emission at higher column densities. First, we compare the cloud brightness to the diffuse, low-column-density ISM using the high-latitude sky averages measured by Arendt et al. (1998) found from COBE/DIRBE data: and 0.030 MJy sr-1 per 1020 cm-2 at 12 m and 25 m, respectively. The optical depth per unit H atom in the diffuse ISM is cm2/H (extrapolating using from the 250 m value of Boulanger et al., 1996). We make a slight correction from the DIRBE to WISE wavelengths using the NGC 7023 reflection nebula spectrum, for which WISE(12 m)/DIRBE(12 m)=1.060 and WISE(22 m)/DIRBE(25 m)=0.92 taking into account the spectral responses of the wide-band filters. Then, using only these empirical values, the intensity per unit optical depth for the diffuse ISM is =2.5 and 2.3 MJy sr-1 for the WISE 12 and 22 m bands, respectively. Comparing to Figure 4, the clouds often have higher and than the diffuse ISM.
The mid-infrared color ratios of the clouds from the WISE observations have an average and standard deviation . For comparison, the model of Li & Draine (2001) that matches COBE/DIRBE observations of the mid-infrared diffuse interstellar medium has a value 1.69 for that same ratio. A wide range of mid-infrared colors was found in a study of somewhat larger clouds, using IRAS data, focused on the CO-bright regions, where Verter et al. (2000) found with the cloud fluxes in Jy. Converting from the IRAS wavelengths to those of WISE to get reduces those numbers by only 6%. Thus it appears our sample of clouds has a fairly narrow range of mid-infrared colors that is within the wider range spanned by large clouds and slightly lower than the diffuse interstellar medium. The mid-infrared color is sensitive to the relative amount of PAH and very small grains in the dust distribution. The relatively narrow range of colors in our cloud sample shows that the relative amounts of these two types of grains appears to remain approximately constant from cloud to cloud.
The mid-infrared emissivity of our sample clouds appears to be significantly higher than for dark clouds. We showed above that MBM 12 is 2 orders of magnitude lower in emissivity, and that there are large variations in the mid-infrared emissivity within that cloud. This seems in keeping with the results of (Verter et al., 2000) and (Bernard et al., 1993) who showed order-of-magnitude variations in PAH content compared to larger grains. Our translucent cloud sample has a narrower range of mid-infrared emissivities, which appear to be reasonably constant within a cloud, in contrast to the wide range of values and variations within dark clouds. The most dramatic difference is that PAH appear to be absent from the center of MBM 12.
4.2 Large grain temperatures and radiation field
We can address the trend of large grain properties within the cloud sample in a manner similar to that done in the previous section for the PAH and small grains. For the dust temperature, we assume the interstellar radiation field heats the diffuse medium to 20 K (typical of the diffuse ISM), then the radiation field decreases from the interstellar average by the same factor as for the PAH and small grains. In principle the optical depth relevant to the big grain heating can be different from that for the PAH, e.g. if the latter were only heated by UV photons. We will take the initial assumption that all grains are heated by photons with the same characteristic optical depth, specifically that of visible photons. If the large grain far-infrared emissivity scales as a power-law with exponent , equating emission and absorption
| (6) |
where the optical depth for absorption, , in angle brackets, is averaged respectively over the visible wavelengths of heating photons and the far-infrared wavelengths of cooling photons. Then we expect the dust temperature
| (7) |
where is the temperature for grains heated by the unextinguished interstellar radiation field at ,
| (8) |
and is the value of in the diffuse medium where .

If the dust properties are independent of depth into the cloud, then the extinction of the radiation field is determined solely by the dust optical depth. To a crude approximation, the radiation field decreases with depth into the cloud as
| (9) |
where we used , using the V-band (0.55 m) absorption as representative of visible-light heating photns, in the dust model of Draine & Li (2007). Figure 7 shows the attenuation factor (derived from the dust temperature using eq. 7) versus cloud optical depth, . The dashed line is simply eq. 9, which is just the effect of extinction, with the radiative transfer treated as absorption, neglecting details of scattering for simplicity. There is significant scatter in Figure 7 with respect to the simple fit. Some of this is due to neglect of radiative transfer (scattering), some due to grain property or local interstellar radiation field variations, and some is due to treating the clouds as single points rather than taking into account their properties versus depth, which would require a detailed study of each cloud. The ‘positive’ deviants in Figure 7 have big grains that are warmer than expected. These include the anomalously warm cloud DIR015+54. The ‘negative’ deviants include colder clouds, and we verified that all clouds below the dashed line in Figure 7 have at least some molecular gas detected via millimeter-wave CO emission lines (Reach et al., 1994).
Could the trend be caused by a change in the properties of the grains? Referring to eq. 7, and assuming for the moment there is no extinction of the radiation field, the observed trend of dust temperatures could occur if increases as the cloud optical depth increases. Specifically must increase by 50% for clouds with (equivalently, ), and must increase by 150% for clouds with (equivalently, ). For denser clouds with , must be fully 6 times higher than its diffuse ISM value. To explain the dust temperatures (Fig. 7), either is increasing, or decreasing, for clouds with greater optical depth. If is increasing, then we would expect relatively higher far-infrared dust opacities per unit column density in the higher optical depth clouds, which can be measured by comparing to for a wide range of clouds. Figure 8 shows that there is indeed a correlation such that there is somewhat more far-infrared optical depth per unit gas column density for the clouds with higher optical depth. This is another version of the primary effect we explore in this series of papers, where there is relatively more dust per unit gas for higher-column-density clouds. But the apparent increase in FIR opacity is not large enough; the changes in dust temperature due to changes in appear to cause only a small part of apparent excess dust.

If we were to ascribe all the grain temperature variation to changes in , then optical and ultraviolet measurements of starlight extinction would show corresponding trends in extinction per unit column density. But has been well measured from starlight extinction and ultraviolet H column densities. For example, in the FUSE and Copernicus survey reported by Rachford et al. (2002), there is a linear correlation between extinction and the total column density, over a range of extinctions from 0.15 to 3.2, corresponding to from to . That means that the optical depth to absorption of starlight per unit gas column density does not change, and it cannot explain the variation in dust temperatures. We conclude that the big grain temperature changes in our clouds are largely due to changes in the radiation field, not due to dust property variations.
4.3 Direct comparison between PAH and big grain abundance
The emission from PAH is via excitation by single photons, followed by cascade through all the infrared modes, so the mid-infrared brightness is proportional to the UV-visible radiation field strength and the column of PAH:
| (10) |
where is the abundance of PAH. The true gas-to-dust ratio, which is dominated by that of large grains, should be uniform in the ISM because most of the heavy-element abundance is locked in grains and cannot vary significantly from place to place. Thus we assume the abundance of large grains is constant, and the dust optical depth traces the total column. In that case, the emissivity of PAH depends on the radiation field and PAH abundance:
| (11) |
Assuming the large grain properties are uniform, we can use the observed the dust temperature to measure using eq. 7 with and K.

Figure 9 directly compares the observables
| (12) |
versus The observations are consistent with a constant value, shown by the dashed line, showing there is little room for variation in the abundance of PAH. Using the standard deviation of , we find that remains constant within 60%. The results for the abundance of very small grains, traced by the WISE 22 m emission, are identical, showing is also constant to within 60%. Thus we can accept a null hypothesis that the relative abundance of PAH and very small grains remains approximately constant within the clouds, and the apparent decrease in brightness is due to extinction of the radiation field.
4.4 Transition from diffuse to dark clouds
Our study applies to local clouds and takes advantage of WISE and Planck observations that clearly resolve them. A study of nearby, dense clouds with bright CO emission showed some have halos of mid-infrared emission that are explained by increases, by factors of few, in PAH and very small grain abundances in some cloud halos, even when taking into account radiative transfer of starlight into clouds (Bernard et al., 1993). Not all clouds show the strong mid-infrared limb-brightening of the Chamaeleon and Ophiuchus clouds studied by Bernard et al. (1993), so those strong variations in small grain abundances may be local effects related to the cloud history of dynamic interactions with other clouds and nearby stars. Another study of infrared emission of larger, CO-bright clouds with cold, dense cores showed that their colors may be more influenced by grain coagulation than the extinction of starlight (Ysard et al., 2012).
To assess the total amount of gas in dark and molecular clouds, it is customary to use the brightness of the conveniently-observed lowest rotational transitions of CO, then convert to the H2 column density with a scale factor (Bolatto et al., 2013). That factor has some theoretical basis if the spectral lines are optically thick, the gas temperature is constant, and the clouds are self-gravitating so the velocity dispersion determines the mass via the virial theorem. For clouds that are on the border between being diffuse and self-gravitating, these assumptions do not apply, leading to the possibility of significant molecular gas without CO (Blitz et al., 1990). Observations of the small-scale structure of CO emission in a high-latitude molecular cloud show that the velocity structure and spatial distribution of CO in fact have nothing to do with the virial theorem or distribution of H2, being instead due to intermittent turbulence (Falgarone et al., 2009). We require a tracer of the total column density that can operate in regions with column densities up to cm-1 (visible extinctions of a few). One such tracer is radio CH emission (Magnani et al., 2003), though that emission is faint and cannot be readily detected and mapped for diffuse clouds. The interaction of cosmic rays with nucleons gives rise to -rays, which can then trace the total column density of interstellar nucleons. Both the cosmic rays and -rays can propagate through long distances in the Galaxy. It is notable that the usage of -rays is completely independent of the dust and gas measurements, and it serves as a test of the capability of dust to be used as a tracer of the total column density. By comparing the -ray derived total column density to that the gas tracers, it was possible to separate the gas into the part that can be traced and the part that is inferred to exist but is ‘dark’ (Grenier et al., 2005). A Fermi study of dark clouds in the galactic anticenter measured cm2 using -rays specifically in the ‘dark’ gas (Remy et al., 2017), consistent with Figure 1 for diffuse gas. Remy et al. (2017) found a significant increase in , by a factor of 6 in dark gas with K, in locations with dense gas, indicating grain property evolution. The direction and amount of the grain property variations is in agreement with extrapolation of the trends seen in the diffuse medium and shown in Figure 1. Whether dust emission can be used as a reliable tracer of total column density in dense clouds is in question, because it is not known how repeatable and systematic are the changes in large grain dust properties that affect . For diffuse clouds, with temperatures greater than K, and where CO emission is not bright, we find that the change in dust properties is still small enough that the total column density can be determined from the dust emission.
In Figure 1, the solid points indicate the dust absorption per unit atomic gas column density, and they show a clear increase for clouds that are colder. For some clouds, we have CO observations and can use the conventional method of multiplying the CO line integral, by the factor cm-2 K-1 s, to estimate the molecular column density. Then we can calculate the dust absorption per unit total (atomic plus molecular) gas column density; those values are shown as open symbols for 4 clouds in Figure 1. If the dust properties in atomic and molecular clouds are identical and invariant, and we have correctly estimated the total gas column density, then the open symbols should fall on the same line as the atomic clouds. For the three diffuse clouds from our main sample, the open symbols do in fact fall on the line that was derived for diffuse atomic clouds. It therefore appears that, taking into account atomic and molecular gas, the true value is cm2 for clouds wuth dust temperature of 18 K. The gradual slope of the solid line in Figure 1 represents a change in dust properties, being a factor of 2 higher for colder clouds (down to dust temperatures of 15 K) and factor of 2 lower for warmer clouds (up to dust temperatures of 20.5 K).
The large, vertical deviations of the clouds in Figure 1 from the solid line can be interpreted as due to unaccounted molecular gas, or to anomalous grain properties in the clouds. The systematic trend, the agreement with the model for H2 formation, suggest the primary effect is presence of molecular gas. Note that the H2 formation model depends on the volume density of the gas and really requires an analysis that goes cloud-by-cloud and has a realistic radial density profile connecting to the diffuse ISM. For the dark cloud MBM 12, taking into account the molecular gas traced by CO does not bring its quite in line with the extrapolation of dust properties from atomic clouds. The dust absorption per unit column density appears to be another factor of 2 higher than the linear extrapolation of the dashed line in Figure 1. This could indicate that dust property variations become even more important in molecular clouds than in diffuse clouds, in the same sense and approximate magnitude as determined from -ray studies (Remy et al., 2017).
5 Conclusions
Dust grain properties vary in diffuse interstellar clouds, but that variation is insufficient to explain the observed range of dust emission per unit atomic gas column density. Within our sample of isolated, diffuse clouds the relative amounts of PAH, Very Small Grains, and Big Grains remain approximately constant to within a factor of 2. The trends in the relative amount of emission from different types of grain, and he large grain temperature differences, can be explained by a decrease of the radiation field from due to extinction of the starlight that heats the grains. In the core of a high-latitude dark cloud, there is no evidence for any PAH at all, likely due to the absence of heating photons but also consistent with absence of PAH themselves.
In Paper 1, we showed significant variations in the gas-to-dust ratio, when the gas is traced by the 21-cm line of H I. In Paper 2, we showed the H I was not significantly underestimating the atomic column density, because there is little column density of 21-cm-optically-thick, cold atomic gas. In this Paper, we find no evidence that changes in dust properties that can explain the apparently high gas-to-dust ratio (equivalently, higher specific opacity) of diffuse clouds. While there is evidence for a modest increase in the far-infrared opacity in the diffuse interstellar medium, the total range of observed gas-to-dust ratios is too large to be explained by this effect alone. An updated empirical model for H2 formation on large grain surfaces falls far short of the atomic gas-to-dust ratio, with extrapolation to low radiation fields yielding predictions consistent with a high-latitude dark cloud known to contain significant molecular gas. In terms of the hypotheses posed in the Introduction, we show that while there is a small amount of cold atomic gas (hypothesis 2) and there are modest dust property variations (hypothesis 3), the results support that diffuse clouds contain ‘dark gas’ (hypothesis 1), presumably H2, not traced by the H I, even in places with little CO emission. Where there is CO emission, the dust optical depth per unit total gas is consistent with the trend of dust optical depth per unit atomic gas in diffuse clouds. In dark clouds with extinction , where there is bright CO emission and the dust grains are cold ( K), dust property variations may be more extreme than in diffuse clouds.
References
- Andersen et al. (2013) Andersen, M., Steinacker, J., Thi, W.-F., et al. 2013, A&A, 559, A60
- Arendt et al. (1998) Arendt, R. G., Odegard, N., Weiland, J. L., et al. 1998, ApJ, 508, 74
- Bernard et al. (1993) Bernard, J. P., Boulanger, F., & Puget, J. L. 1993, A&A, 277, 609
- Blitz et al. (1990) Blitz, L., Bazell, D., & Desert, F. X. 1990, ApJ, 352, L13
- Bolatto et al. (2013) Bolatto, A. D., Wolfire, M., & Leroy, A. K. 2013, ARA&A, 51, 207
- Boulanger et al. (1996) Boulanger, F., Abergel, A., Bernard, J.-P., et al. 1996, A&A, 312, 256
- Draine & Anderson (1985) Draine, B. T., & Anderson, N. 1985, ApJ, 292, 494
- Draine & Li (2007) Draine, B. T., & Li, A. 2007, ApJ, 657, 810
- Falgarone et al. (2009) Falgarone, E., Pety, J., & Hily-Blant, P. 2009, A&A, 507, 355
- Fanciullo et al. (2015) Fanciullo, L., Guillet, V., Aniano, G., et al. 2015, A&A, 580, A136
- Fazio et al. (2004) Fazio, G. G., Hora, J. L., Allen, L. E., et al. 2004, ApJS, 154, 10
- Flagey et al. (2009) Flagey, N., Noriega-Crespo, A., Boulanger, F., et al. 2009, ApJ, 701, 1450
- Foster & Goodman (2006) Foster, J. B., & Goodman, A. A. 2006, ApJ, 636, L105
- Grenier et al. (2005) Grenier, I. A., Casandjian, J.-M., & Terrier, R. 2005, Science, 307, 1292
- Heiles et al. (1988) Heiles, C., Reach, W. T., & Koo, B.-C. 1988, ApJ, 332, 313
- Hollenbach et al. (1971) Hollenbach, D. J., Werner, M. W., & Salpeter, E. E. 1971, ApJ, 163, 165
- Jones et al. (2013) Jones, A. P., Fanciullo, L., Köhler, M., et al. 2013, A&A, 558, A62
- Köhler et al. (2015) Köhler, M., Ysard, N., & Jones, A. P. 2015, A&A, 579, A15
- Li & Draine (2001) Li, A., & Draine, B. T. 2001, ApJ, 554, 778
- Magnani et al. (1985) Magnani, L., Blitz, L., & Mundy, L. 1985, ApJ, 295, 402
- Magnani et al. (2003) Magnani, L., Chastain, R. J., Kim, H. C., et al. 2003, ApJ, 586, 1111
- Peek et al. (2011) Peek, J. E. G., Heiles, C., Douglas, K. A., et al. 2011, ApJS, 194, 20
- Planck Collaboration et al. (2011a) Planck Collaboration, Abergel, A., Ade, P. A. R., et al. 2011a, A&A, 536, A24
- Planck Collaboration et al. (2011b) —. 2011b, A&A, 536, A25
- Planck Collaboration et al. (2014a) Planck Collaboration, Ade, P. A. R., Aghanim, N., et al. 2014a, A&A, 571, A8
- Planck Collaboration et al. (2014b) Planck Collaboration, Abergel, A., Ade, P. A. R., et al. 2014b, A&A, 571, A11
- Planck Collaboration et al. (2014c) —. 2014c, A&A, 566, A55
- Planck Collaboration et al. (2016) Planck Collaboration, Ade, P. A. R., Aghanim, N., et al. 2016, A&A, 586, A132
- Pound et al. (1990) Pound, M. W., Wilson, R. W., & Bania, T. M. 1990, ApJ, 351, 165
- Rachford et al. (2002) Rachford, B. L., Snow, T. P., Tumlinson, J., et al. 2002, ApJ, 577, 221
- Reach et al. (2015) Reach, W. T., Heiles, C., & Bernard, J.-P. 2015, ApJ, 811, 118
- Reach et al. (2017) —. 2017, ApJ, 834, 63
- Reach et al. (1994) Reach, W. T., Koo, B.-C., & Heiles, C. 1994, ApJ, 429, 672
- Reach et al. (1998) Reach, W. T., Wall, W. F., & Odegard, N. 1998, ApJ, 507, 507
- Remy et al. (2017) Remy, Q., Grenier, I. A., Marshall, D. J., & Casandjian, J. M. 2017, A&A, 601, A78
- Rieke et al. (2004) Rieke, G. H., Young, E. T., Engelbracht, C. W., et al. 2004, ApJS, 154, 25
- Snow & McCall (2006) Snow, T. P., & McCall, B. J. 2006, ARA&A, 44, 367
- Stepnik et al. (2003) Stepnik, B., Abergel, A., Bernard, J.-P., et al. 2003, A&A, 398, 551
- Tauber et al. (2010) Tauber, J. A., Mandolesi, N., Puget, J.-L., et al. 2010, A&A, 520, A1
- Tricco et al. (2017) Tricco, T. S., Price, D. J., & Laibe, G. 2017, MNRAS, 471, L52
- Verter et al. (2000) Verter, F., Magnani, L., Dwek, E., & Rickard, L. J. 2000, ApJ, 536, 831
- Wright et al. (2010) Wright, E. L., Eisenhardt, P. R. M., Mainzer, A. K., et al. 2010, AJ, 140, 1868
- Ysard et al. (2015) Ysard, N., Köhler, M., Jones, A., et al. 2015, A&A, 577, A110
- Ysard et al. (2012) Ysard, N., Juvela, M., Demyk, K., et al. 2012, A&A, 542, A21