Collapse of Kondo state and ferromagnetic quantum phase transition in YbFe2Zn20
Abstract
We present the electrical resistivity data under application of pressures up to 26 GPa and down to 50 mK temperatures on YbFe2Zn20. We find a pressure induced magnetic phase transition with an onset at = 18.2 0.8 GPa. At ambient pressure, YbFe2Zn20 manifests a heavy fermion, nonmagnetic ground state and the Fermi liquid behavior at low temperatures. As pressure is increased, the power law exponent in resistivity, , deviates significantly from Fermi liquid behavior and tends to saturate with = 1 near . A pronounced resistivity maximum, , which scales with Kondo temperature is observed. decreases with increasing pressure and flattened out near indicating the suppression of Kondo exchange interaction. For , shows a sudden upward shift, most likely becoming associated with crystal electric field scattering. Application of magnetic field for broadens the transition and shifts it toward the higher temperature, which is a typical behavior of the ferromagnetic transition. The magnetic transition appears to abruptly develop above , suggesting probable first-order (with changing pressure) nature of the transition; once stabilized, the ordering temperature does not depend on pressure up to 26 GPa. Taken as a whole, these data suggest that YbFe2Zn20 has a quantum phase transition at = 18.2 GPa associated with the avoided quantum criticality in metallic ferromagnets.
I Introduction
Among the rare-earth-based intermetallic compounds, Ce and Yb -based materials have attracted much attention due to their peculiar properties Movshovich et al. (1994); Cornelius et al. (1995); Grosche et al. (1996); Mathur et al. (1998); Alami-Yadri et al. (1998); Winkelmann et al. (1999); Knebel et al. (2001a); Stewart (2001); Bud’ko et al. (2004); Coleman (2007); Nakatsuji et al. (2008); Flouquet and Harima (2012); Si and Steglich (2010); Steppke et al. (2013). The properties of these compounds are usually dominated by two characteristic energy scales: Ruderman-Kittel-Kasuya-Yosida (RKKY) Ruderman and Kittel (1954); Kasuya (1956); Yosida (1957) and Kondo Kondo (1964); Hewson (1993) interaction energies. The exchange interaction, , which determines the interaction energy between local moments and conduction electron, e-1/J, is also responsible for the coupling between local moments through the RKKY interaction, . Hence, the ground state of these compounds is determined by the competition between these two energy scales and often described by the Doniach phase diagram Doniach (1977). When the ground state in nonmagnetic and when , magnetic order can be established. The most interesting situation occurs when the two energy scales are comparable and the system can be tuned through a = 0 K magnetic instability at a quantum phase transition (QPT). Application of external pressure is one of the ways to tune the Schilling (1979); Jackson et al. (2005), bringing the material to a QPT or QCP (quantum critical point).
Often Yb is considered as a ”hole” equivalent of Ce. In contrast to Ce compounds, where magnetic ordering is suppressed by pressure, in Yb systems, increasing pressure can tune the system from a nonmagnetic state to a magnetic one Stewart (2001); Flouquet and Harima (2012). There are only a few examples of the pressure induced, nonmagnetic-to-magnetic phase transitions in Yb compounds Winkelmann et al. (1998); Nakano et al. (2004); Winkelmann et al. (1999); Alami-Yadri et al. (1998); Schöppner et al. (1986); Saiga et al. (2008); Cornelius et al. (1995); Knebel et al. (2001b); Yuan et al. (2006) and, so far, superconductivity has been reported in only two materials Nakatsuji et al. (2008); Schuberth et al. (2016).
The YbZn20 ( = Fe, Ru, Os, Co, Rh, Ir) series is a Yb-based heavy fermion system Torikachvili et al. (2007); Jia et al. (2008); Canfield et al. (2008); Jia et al. (2009); Mun et al. (2012) which belongs to the Zn20 family Nasch et al. (1997). For all six members, at high temperature, the magnetic susceptibility measurements show Curie-Weiss behavior with the effective moment close to the Yb3+ Torikachvili et al. (2007); Jia et al. (2008). In the resistivity measurements, there are no signs for the magnetic ordering down to 20 mK Torikachvili et al. (2007); Jia et al. (2008). Among this YbZn20 series, YbCo2Zn20 has the lowest and the largest Sommerfeld coefficient of the six members Torikachvili et al. (2007); Jia et al. (2008). By combining the Doniach model with this small and large Sommerfeld coefficient, one can assume that YbCo2Zn20 is close to a possible magnetic QCP. With this idea, Saiga Saiga et al. (2008) performed a high pressure resistivity measurement on YbCo2Zn20 and observed a pressure induced QCP at a critical pressure 1 GPa and antiferromagnetic (AFM) ordering at higher pressures. Apart from this, a field induced ordered phase has been observed at the ambient pressure in YbCo2Zn20, possibly due to the crystal electric field level crossing Shimura et al. (2011); Takeuchi et al. (2011a); Shimura et al. (2012); Taga et al. (2012); Takeuchi et al. (2011b); Honda et al. (2014). A pressure induced QCP has also been estimated for YbIr2Zn20 ( 5.2 GPa) and YbRh2Zn20 ( 5.2 GPa), however, for YbRh2Zn20 no pressure induced magnetic transitions have been observed so far Matsubayashi et al. (2009); Honda et al. (2010, 2012, 2013).
Several years ago, high pressure resistivity measurements were performed up to 8.23 GPa for YbFe2Zn20 Kim et al. (2013). Increasing pressure drives to lower values and enhanced the -coefficient (); a QCP of 10 GPa was inferred Kim et al. (2013). In this work, by employing a diamond anvil cell in a dilution refrigerator, we extend the pressure range up to 26 GPa and lower the base temperature to 50 mK. As a result we find a clear feature in resistivity that we identify as a magnetic phase transition in YbFe2Zn20 for 18.2 GPa. The transition temperature is about 1 K and does not change with further increase of pressures up to 26 GPa. We tentatively identify the transition as ferromagnetic in nature and associate the step-like feature in with an avoided quantum criticality QPT.
II Experimental Methods
Single crystals used for this study were grown using a high-temperature solution growth technique Canfield and Fisk (1992); Canfield and Fisher (2001) with the help of frit-disc crucible set Canfield et al. (2016). More details about the crystal growth can be found in Refs. Jia et al., 2007; Torikachvili et al., 2007; Kong et al., 2017. Temperature and field dependent resistivity measurements were carried out using a Quantum Design Physical Property Measurement System from 1.8 K to 300 K. A dilution refrigerator option was utilized to perform measurements down to 50 mK. The resistivity was measured using the van der Pauw method van der Pauw (1958); Ramadan et al. (1994) with ac-current ( = 0.005 mA, = 18.3 and 21.3 Hz) parallel to the [111] plane and a magnetic field was applied perpendicular to the current plane. A miniature diamond anvil cell Gavriliuk et al. (2009), with 300 m culets, was used to generate the pressure for the resistivity measurement and KCl powder was used as a pressure transmitting medium. The temperature gradient between the dilution refrigerator thermometer and sensor positioned on miniature diamond anvil cell close to the anvils was evaluated in a separate experiment and was found negligible with the protocol of the measurement used in this work. Single crystals with a typical dimension of 808020 m3 were loaded into the sample chamber with an inner diameter of 130 m made out of a cubic BN gasket. Pressure was applied at room temperature and ruby fluorescence, at 300 K was used to determine the pressurePiermarini et al. (1975).
III Results and Discussion
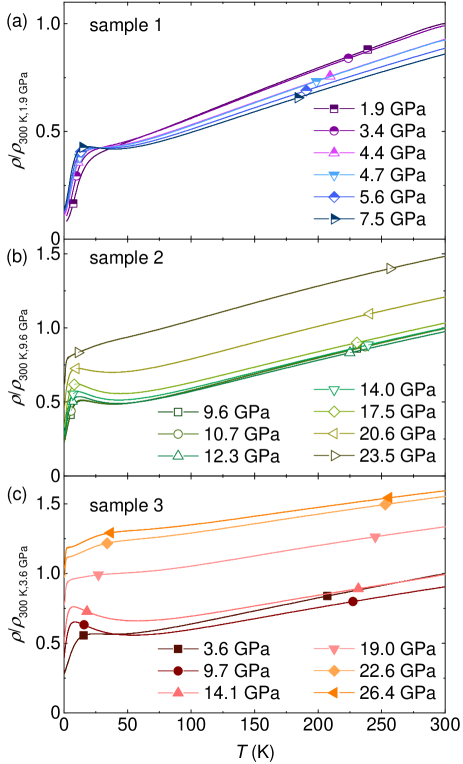
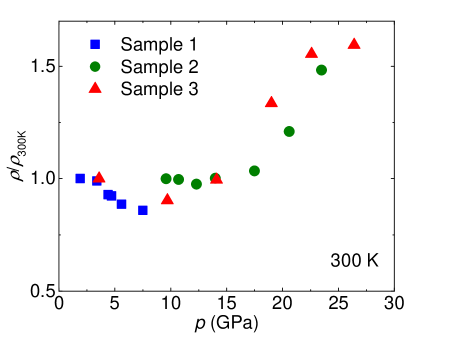
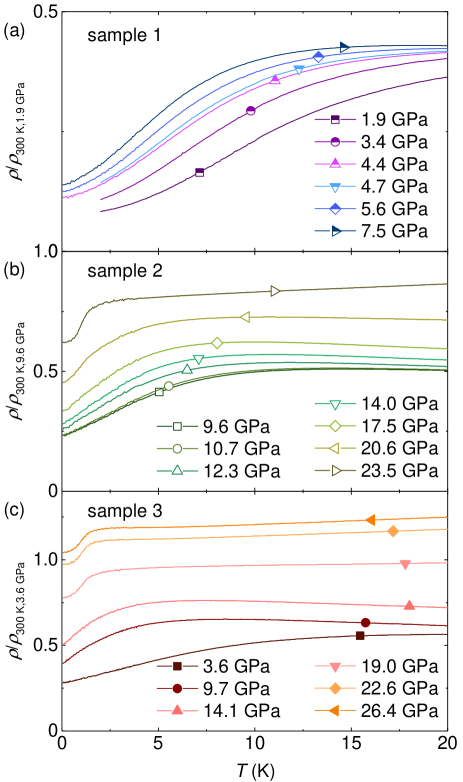
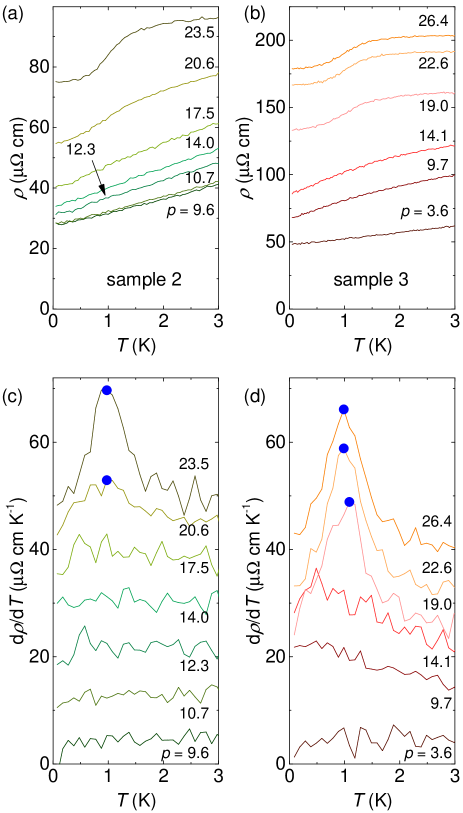
Temperature dependent resistivity measurements on three different samples of YbFe2Zn20 under pressures up to 26.4 GPa are shown in Fig. 1. For each pressure, resistivity values are normalized to the lowest pressure, 300 K resistivity value of each sample. For sample 1, when increasing the pressure, the 300 K resistivity, , is monotonically suppressed, which is similar to Ref. Kim et al., 2013. For sample 2 and 3, as indicated in Figs. 1 (b) and (c), shows a non-monotonic dependence on pressure when higher pressure values are achieved. However, for 18 GPa, shows relatively small variation with pressure, while for 18 GPa, systematically increases with pressure. Fig. 2 presents the pressure evolution of the normalized with pressure. As indicated in the figure, stays relatively flat for 18 GPa and continuously increases for 18 GPa. Fig. 3 presents a low temperature expanded view of the data presented in Fig. 1. In addition to the increased for 18 GPa there is also the clear onset of a relatively sharp, low temperature feature (Fig. 3) for 20 GPa. Whereas these are qualitative changes we will now examine these data quantitatively.
For all measured pressures, for 50 K, the resistivity data show a nearly linear temperature dependence (Fig. 1). It is worth noting that the high-temperature slope (250 K 300 K) of the resistivity decreases with increasing pressure up to about 10 GPa and then remains constant for higher pressures. Below 50 K, there is a broad shoulder in the resistivity data for 3.4 GPa that changes into a broad maximum () with pressure increasing above 3.6 GPa. The value of usually scales with the Kondo temperature, . It moves to lower temperatures with increasing pressure up to about 20 GPa and then shows a sudden increment for 20 GPa. The behavior of pressure dependence of the (for GPa) is consistent with the previous work Kim et al. (2013).
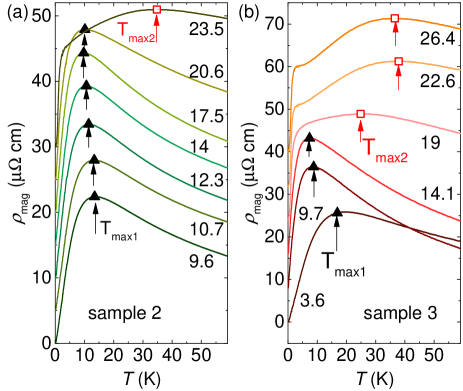
The total resistivity of the YbFe2Zn20 can be expressed as a combination of normal metallic behavior and a magnetic contribution. As mentioned above, the high-temperature resistivity shows a nearly linear temperature dependence, indicating that phonon scattering is dominant in the high temperature range. Normal metallic behavior can be approximated by considering the temperature dependent resistivity of non-magnetic LuFe2Zn20. Therefore, the magnetic contribution to the resistivity of YbFe2Zn20 can be estimated by subtracting the LuFe2Zn20 resistivity data from YbFe2Zn20 data. Since the residual resistivity values of our samples show non-monotonic increments, first we have to subtract their residual resistivity values for each data set and then normalize the high temperature ( 275 K) slope of the resistivity to that of LuFe2Zn20. This can be written as
| (1) |
Similar analysis has been used to determine the in Ref. Jia et al., 2009. data for samples 2 and 3 are shown in Figs. 4 (a) and (b) respectively. For both samples, decreases with increasing pressure up to about 20 GPa and then shows a sudden change (jump up in temperature) for higher pressures. is the temperature corresponding to this higher pressure, broad, maximum in the low temperature data. The solid black triangles and open red squares indicate the and respectively.
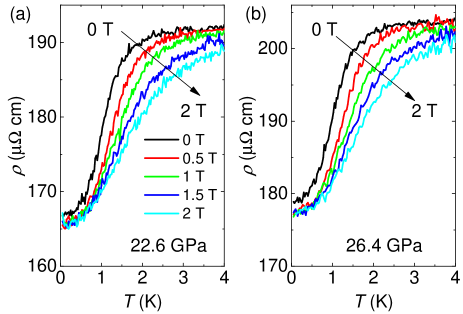
The evolution of the low temperature resistivity for samples 2 and 3 are shown in Figs. 5 (a) and (b) respectively. For and 18.2 GPa, the resistivity of both samples decreases with decreasing temperature and there is no pronounced anomaly down to 50 mK. When the pressure exceeds GPa, the resistivity shows a kink/sharp drop, suggesting a loss of spin-disorder-scattering and magnetic ordering at . The peak in the temperature derivative of the resistivity is used to determine the ordering temperature, , as shown in Figs. 5 (c) and (d). As can be seen, the peak position does not change with the pressure and remains essentially the same up to 26 GPa. From the resistivity measurements, we cannot determine the nature of the magnetic transition, however, as shown in Fig. 6, application of magnetic field broadens the kink/sharp drop of the resistivity and moves it to higher temperatures, which suggests that this is not a structural phase transition. Instead, this is typical behavior for a ferromagnetic transition.
A pressure-temperature phase diagram can be constructed and shown in Fig. 7 using the data from Figs. 4 and 5 as well as data from Ref. Kim et al., 2013. Black solid triangles and red open squares represent the data obtained from Fig. 4. The obtained from Ref. Kim et al., 2013 is represented by open green triangles.
Figs. 7 and 2 demonstrate three changes that take place as pressure increases through 20 GPa. At low temperatures ( 1 K) there is the sudden appearance of a transition that is arguably ferromagnetic. At intermediate temperatures there is the disappearance of an 10 K resistive maximum associated with the Kondo effect and the appearance of an 30-40 K resistive feature that is most likely associated with CEF splitting Cornut and Coqblin (1972); Hanzawa et al. (1985). At higher temperatures, all the way up to room temperature, there is a marked increase in resistivity that starts around 15 GPa and appears to saturate by 25 GPa. Taking these three observations together, our results strongly suggest that by 20 GPa there is a band structure change associated with the droping of the Yb-4-levels below the Fermi level. As a result, the Yb-4-levels stop being hybridized and the system enters the magnetic regime in the Doniach phase diagram.
These results can be put in the context of the Fe2Zn20 ( = Gd-Tm) series which shows a clear de Gennes scaling of its ferromagnetic ordering temperature Jia et al. (2007, 2009). According to the de Gennes scaling, if Yb3+ were to be purely local-moment-like, YbFe2Zn20 would order ferromagnetically at about 1 K. This is essentially what we find for . The suggested pressure-induced ferromagnetic ordering in YbFe2Zn20 is not too surprising, if we look at other intermetallic compounds in Zn20 familyJia et al. (2008, 2009). Taking GdZn20 series for example, ferromagnetic ordered ground state is found for members in the iron column ( = Fe, Ru and Os) while antiferromagnetic ordered ground state in the cobalt column ( = Co, Rh and Ir) Jia et al. (2008). Moreover, the pressure-induced ordered states in YbCo2Zn20 and YbIr2Zn20 have also been suggested as AFM orderingTaga et al. (2012); Honda et al. (2012). Taking YbFe2Zn20 in this study together, Zn20 family seems to follow the rule that for the iron column members, ferromagnetic ordering is expected, while for the cobalt column members, antiferromagnetic ordering is expected.
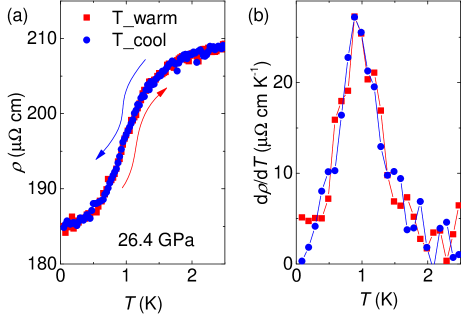
appears to abruptly develop above suggesting the first-order nature of the quantum phase transition at . This is consistent with the growing number of examples of avoided quantum criticality in ferromagnetic metalsKaluarachchi et al. (2017); Taufour et al. (2010); Kotegawa et al. (2011); Kittler et al. (2013). According to the current theoretical understanding, a continuous PM to FM transition is not possible at = 0 K, when suppressing the FM phase with a clean parameter such as pressure Brando et al. (2016). Two possibilities have been proposed Belitz et al. (1997, 1999); either the transition becomes of the first order Taufour et al. (2010); Kabeya et al. (2012); Taufour et al. (2016); Kaluarachchi et al. (2018) or the modulated magnetic phase appears to replace the ferromagnetic one Kotegawa et al. (2013); Kaluarachchi et al. (2017); Friedemann et al. (2017). In order to check for hysteresis effects (first order transition), the resistivity measurements were carried out with both increasing and decreasing temperatures at 26.4 GPa (see Fig. 8). However, no hysteretic behavior is observed. This could be due to a weak-first-order transition, where the hysteresis is small and may not be detected experimentally. Also, it could be due to 26.4 GPa being higher than the pressure that corresponds to the tricritical point, so that, at 26.4 GPa, the transition is second order in temperature.

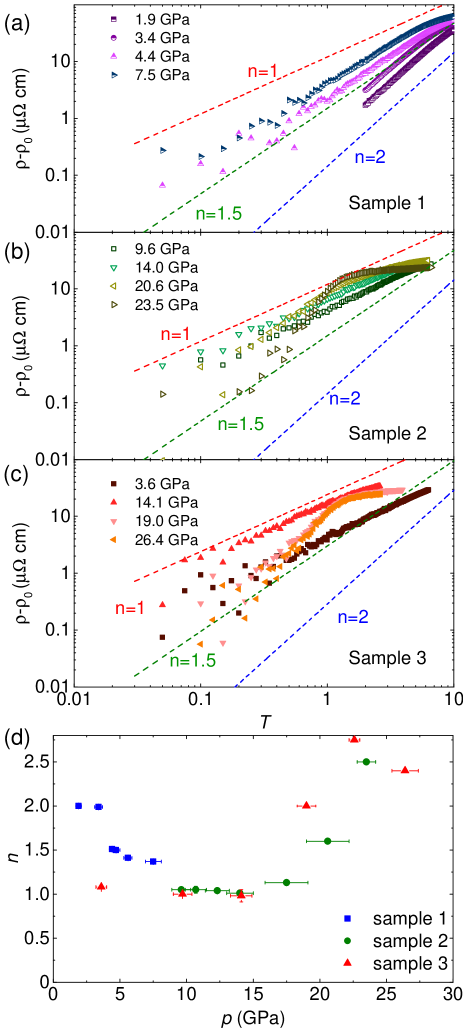
Let’s consider more details about the temperature variation of the resistivity. Figs 9 (a)-(c) show the - versus for sample 1, 2 and 3 to emphasize the low-temperature exponent, , which appears as the slope on a log-log scale. At low-pressures (in Fig. 9 (a) 3.4 GPa), - obeys and for the intermediate pressures ( 6 GPa) it follows . For higher pressures ( 9 GPa 18 GPa), - shows linear dependence over a wide range of temperature. A -linear resistance has been observed in several compounds, such as; CeCoIn5 Sidorov et al. (2002), CeRhIn5 Knebel et al. (2008); Park et al. (2008), YbRh2Si2 Trovarelli et al. (2000); Gegenwart et al. (2002); Custers et al. (2010), YbAgGeBud’ko et al. (2004); Niklowitz et al. (2006) and CeNi2Ge2 Grosche et al. (2000). Evolution of the temperature power-law exponent with pressure is summarized in Fig. 9 (d). The value of is obtained from a sliding window fit to - = , where is obtained from the fit at the lowest temperature. Since the data have been taken down to 0.05 K, the value of can be obtained more accurately than was possible for Ref. Kim et al., 2013. As can be seen, is clearly deviating from 2 for higher pressures. Power-law analysis from Ref. Kim et al., 2013 indicates = 2 even at 8 GPa (see Figs. 5 and 9 in Ref. Kim et al., 2013). This most likely led to the low estimated value of based on the divergence of -coefficient in Ref. Kim et al., 2013. For the low temperature loss of spin disorder feature has behavior most likely associated with spin excitation scattering not too far below . As indicated in Fig. 9 (d), as pressure is increased above , quickly deviates from 1.
From the constructed phase diagram (Fig. 7), it is shown that for YbFe2Zn20, at the low temperature region, the associated Kondo temperature is first suppressed with increasing pressure. At , a possibly ferromagnetic transition suddenly appears at 1 K and stays unchanged with further increasing pressure. This suggests that for YbFe2Zn20, the quantum criticality is avoided by going through a first-order QPT under pressure, which is in contrast to the YbCo2Zn20 and YbIr2Zn20, where they enter AFM ordered states through QCPSaiga et al. (2008); Taga et al. (2012); Honda et al. (2012). At high temperature, a continuously increase of the resistivity with pressure was observed for (Fig. 2), suggesting that the suppressing of hybridization and developing of the Yb3+ local moment is more continuous in nature.
IV Conclusions
In summary, we have measured the resistivity of YbFe2Zn20 up to 26 GPa and down to 50 mK. Above a critical pressure, = 18.2 0.8 GPa, we observed the resistivity anomaly at 1 K, which remains constant with increasing pressure. This anomaly appears to correspond to a ferromagnetic transition, since the application of magnetic field broadened the transition and moved it to higher temperature. Increasing pressure drives the , the associated Kondo temperature, to lower values and flattening at pressures up to indicating a decrease of the hybridization strength. Above , abruptly increases with pressure. In this pressure range can be attributed to the crystal electric field effects. In heavy fermion non-magnetic phase, the low temperature power law exponent is deviated from the Fermi liquid behavior for 3.4 GPa and reached = 1 for 9 GPa . The reason for this unusual exponent value, = 1, over large range of pressure is not clear so far. Additionally, our data suggests that at there is a band structure change associated with the dropping of 4f-levels below the Fermi level.
ACKNOWLEDGMENTS
We would like to thank A. Kaminski for assisting in preparation the gaskets that are used for the pressure cell. This work was carried out at the Iowa State University and supported by the US DOE, Basic Energy Sciences, Materials Science and Engineering Division under contract No. DE-AC02-07CH11358. L. X. was supported, in part, by the W. M. Keck Foundation. The research at the Geophysical Laboratory was supported by DOE/BES under contract No. DE-FG02-99ER45775. A. G. G. acknowledges support of RSF 16-12-10464 grant. For preparation of high-pressure cells the facilities of Center for Collective Use ” Accelerator Center for Neutron Research of the Structure of Substance and Nuclear Medicine” of the INR RAS were used.
Appendix
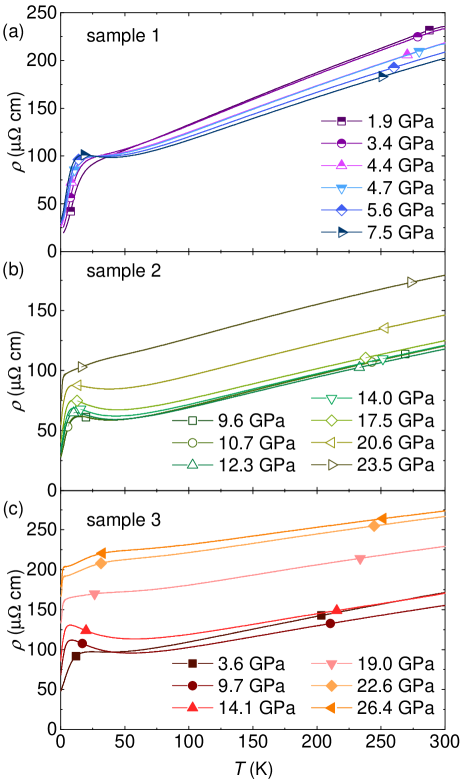
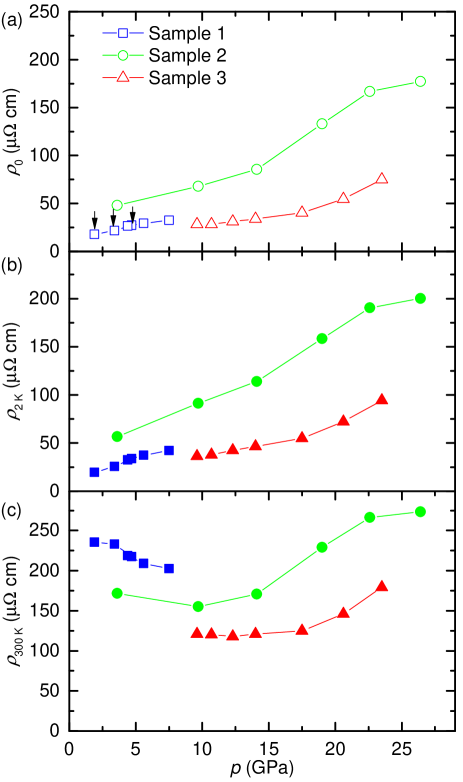
Fig. A.1 presents the temperature dependence of the resistivity of three different samples without normalization. Fig. A.2 presents the pressure dependence of the resistivity values at different fixed temperatures. (a) Extrapolated 0 K resistivity values by fitting low temperature data, (b) at 2 K, (c) at 300 K. Fig. 2 is the normalized version of Fig. A.2 (c) obtained by dividing the 300 K resistivity value at the lowest pressure for each sample.
References
- Movshovich et al. (1994) R. Movshovich, A. Lacerda, P. C. Canfield, J. D. Thompson, and Z. Fisk, Phys. Rev. Lett. 73, 492 (1994).
- Cornelius et al. (1995) A. L. Cornelius, J. S. Schilling, D. Mandrus, and J. D. Thompson, Phys. Rev. B 52, R15699 (1995).
- Grosche et al. (1996) F. Grosche, S. Julian, N. Mathur, and G. Lonzarich, Physica B 223, 50 (1996).
- Mathur et al. (1998) N. D. Mathur, F. M. Grosche, S. R. Julian, I. R. Walker, D. M. Freye, R. K. W. Haselwimmer, and G. G. Lonzarich, Nature 394, 39 (1998).
- Alami-Yadri et al. (1998) K. Alami-Yadri, H. Wilhelm, and D. Jaccard, Eur. Phys. J. B 6, 5 (1998).
- Winkelmann et al. (1999) H. Winkelmann, M. M. Abd-Elmeguid, H. Micklitz, J. P. Sanchez, P. Vulliet, K. Alami-Yadri, and D. Jaccard, Phys. Rev. B 60, 3324 (1999).
- Knebel et al. (2001a) G. Knebel, D. Braithwaite, P. C. Canfield, G. Lapertot, and J. Flouquet, Phys. Rev. B 65, 024425 (2001a).
- Stewart (2001) G. R. Stewart, Rev. Mod. Phys. 73, 797 (2001).
- Bud’ko et al. (2004) S. L. Bud’ko, E. Morosan, and P. C. Canfield, Phys. Rev. B 69, 014415 (2004).
- Coleman (2007) P. Coleman, “Heavy Fermions: Electrons at the Edge of Magnetism,” in Handbook of Magnetism and Advanced Magnetic Materials (John Wiley & Sons, Ltd, 2007).
- Nakatsuji et al. (2008) S. Nakatsuji, K. Kuga, Y. Machida, T. Tayama, T. Sakakibara, Y. Karaki, H. Ishimoto, S. Yonezawa, Y. Maeno, E. Pearson, G. G. Lonzarich, L. Balicas, H. Lee, and Z. Fisk, Nature Physics 4, 603 (2008).
- Flouquet and Harima (2012) J. Flouquet and H. Harima, Kotai Bursuri 47 (2012).
- Si and Steglich (2010) Q. Si and F. Steglich, Science 329, 1161 (2010).
- Steppke et al. (2013) A. Steppke, R. Kuchler, S. Lausberg, E. Lengyel, L. Steinke, R. Borth, T. Luhmann, C. Krellner, M. Nicklas, C. Geibel, F. Steglich, and M. Brando, Science 339, 933 (2013).
- Ruderman and Kittel (1954) M. A. Ruderman and C. Kittel, Phys. Rev. 96, 99 (1954).
- Kasuya (1956) T. Kasuya, Progress of Theoretical Physics 16, 45 (1956).
- Yosida (1957) K. Yosida, Phys. Rev. 106, 893 (1957).
- Kondo (1964) J. Kondo, Progress of Theoretical Physics 32, 37 (1964).
- Hewson (1993) A. C. Hewson, The Kondo Problem to Heavy Fermions, Cambridge Studies in Magnetism (Cambridge University Press, 1993).
- Doniach (1977) S. Doniach, Physica B & C 91, 231 (1977).
- Schilling (1979) J. S. Schilling, Adv. Phys. 28, 657 (1979).
- Jackson et al. (2005) D. D. Jackson, V. Malba, S. T. Weir, P. A. Baker, and Y. K. Vohra, Phys. Rev. B 71, 184416 (2005).
- Winkelmann et al. (1998) H. Winkelmann, M. M. Abd-Elmeguid, H. Micklitz, J. P. Sanchez, C. Geibel, and F. Steglich, Phys. Rev. Lett. 81, 4947 (1998).
- Nakano et al. (2004) T. Nakano, M. Hedo, Y. Uwatoko, and E. Sampathkumaran, Solid State Commun 132, 325 (2004).
- Schöppner et al. (1986) M. Schöppner, J. Moser, A. Kratzer, U. Potzel, J. M. Mignot, and G. M. Kalvius, Z. Phys. B 63, 25 (1986).
- Saiga et al. (2008) Y. Saiga, K. Matsubayashi, T. Fujiwara, M. Kosaka, S. Katano, M. Hedo, T. Matsumoto, and Y. Uwatoko, J. Phys. Soc. Jpn. 77, 053710 (2008).
- Knebel et al. (2001b) G. Knebel, D. Braithwaite, G. Lapertot, P. C. Canfield, and J. Flouquet, J. Phys. Condens. Matter 13, 10935 (2001b).
- Yuan et al. (2006) H. Q. Yuan, M. Nicklas, Z. Hossain, C. Geibel, and F. Steglich, Phys. Rev. B 74, 212403 (2006).
- Schuberth et al. (2016) E. Schuberth, M. Tippmann, L. Steinke, S. Lausberg, A. Steppke, M. Brando, C. Krellner, C. Geibel, R. Yu, Q. Si, and F. Steglich, Science 351, 485 (2016).
- Torikachvili et al. (2007) M. S. Torikachvili, S. Jia, E. D. Mun, S. T. Hannahs, R. C. Black, W. K. Neils, D. Martien, S. L. Bud’ko, and P. C. Canfield, Proc. Natl. Acad. Sci. 104, 9960 (2007).
- Jia et al. (2008) S. Jia, N. Ni, G. D. Samolyuk, A. Safa-Sefat, K. Dennis, H. Ko, G. J. Miller, S. L. Bud’ko, and P. C. Canfield, Phys. Rev. B 77, 104408 (2008).
- Canfield et al. (2008) P. C. Canfield, S. Jia, E. D. Mun, S. L. Bud’ko, G. D. Samolyuk, and M. S. Torikachvili, Physica B 403, 844 (2008).
- Jia et al. (2009) S. Jia, N. Ni, S. L. Bud’ko, and P. C. Canfield, Phys. Rev. B 80, 104403 (2009).
- Mun et al. (2012) E. D. Mun, S. Jia, S. L. Bud’ko, and P. C. Canfield, Phys. Rev. B 86, 115110 (2012).
- Nasch et al. (1997) T. Nasch, W. Jeitschko, and U. C. Rodewald, Z. Naturforsch. B Chem. Sci. 52, 1023 (1997).
- Shimura et al. (2011) Y. Shimura, T. Sakakibara, S. Yoshiuchi, F. Honda, R. Settai, and Y. Ōnuki, J. Phys. Soc. Jpn. 80, 073707 (2011).
- Takeuchi et al. (2011a) T. Takeuchi, M. Ohya, S. Yoshiuchi, M. Matsushita, F. Honda, R. Settai, and Y. Ōnuki, J. Phys. Conf. Ser. 273, 012059 (2011a).
- Shimura et al. (2012) Y. Shimura, T. Sakakibara, S. Yoshiuchi, F. Honda, R. Settai, and Y. Ōnuki, J. Phys. Conf. Ser. 391, 012066 (2012).
- Taga et al. (2012) Y. Taga, S. Yoshiuchi, M. Ohya, J. Sakaguchi, Y. Hirose, F. Honda, T. Takeuchi, R. Settai, and Y. Ōnuki, J. Phys. Soc. Jpn. 81, SB064 (2012).
- Takeuchi et al. (2011b) T. Takeuchi, S. Yoshiuchi, M. Ohya, Y. Taga, Y. Hirose, K. Sugiyama, F. Honda, M. Hagiwara, K. Kindo, R. Settai, and Y. Ōnuki, J. Phys. Soc. Jpn. 80, 114703 (2011b).
- Honda et al. (2014) F. Honda, Y. Taga, Y. Hirose, S. Yoshiuchi, Y. Tomooka, M. Ohya, J. Sakaguchi, T. Takeuchi, R. Settai, Y. Shimura, T. Sakakibara, I. Sheikin, T. Tanaka, Y. Kubo, and Y. Ōnuki, J. Phys. Soc. Jpn. 83, 044703 (2014).
- Matsubayashi et al. (2009) K. Matsubayashi, Y. Saiga, T. Matsumoto, and Y. Uwatoko, J. Phys. Conf. Ser. 150, 042117 (2009).
- Honda et al. (2010) F. Honda, S. Yasui, S. Yoshiuchi, T. Takeuchi, R. Settai, and Y. Ōnuki, J. Phys. Soc. Jpn. 79, 083709 (2010).
- Honda et al. (2012) F. Honda, Y. Taga, S. Yasui, S. Yoshiuchi, Y. Hirose, T. Takeuchi, R. Settai, and Y. Ōnuki, J. Phys. Soc. Jpn. 81, SB063 (2012).
- Honda et al. (2013) F. Honda, T. Takeuchi, S. Yasui, Y. Taga, S. Yoshiuchi, Y. Hirose, Y. Tomooka, K. Sugiyama, M. Hagiwara, K. Kindo, R. Settai, and Y. Ōnuki, J. Phys. Soc. Jpn. 82, 084705 (2013).
- Kim et al. (2013) S. K. Kim, M. S. Torikachvili, S. L. Bud’ko, and P. C. Canfield, Phys. Rev. B 88, 045116 (2013).
- Canfield and Fisk (1992) P. C. Canfield and Z. Fisk, Philos. Mag. B 65, 1117 (1992).
- Canfield and Fisher (2001) P. C. Canfield and I. R. Fisher, J. Cryst. Growth 225, 155 (2001).
- Canfield et al. (2016) P. C. Canfield, T. Kong, U. S. Kaluarachchi, and N. H. Jo, Philos. Mag. 96, 84 (2016).
- Jia et al. (2007) S. Jia, S. L. Bud’ko, G. D. Samolyuk, and P. C. Canfield, Nature Physics 3, 334 (2007).
- Kong et al. (2017) T. Kong, V. Taufour, S. L. Bud’ko, and P. C. Canfield, Phys. Rev. B 95, 155103 (2017).
- van der Pauw (1958) L. J. van der Pauw, Philips Research Reports 20, 220 (1958).
- Ramadan et al. (1994) A. A. Ramadan, R. D. Gould, and A. Ashour, Thin Solid Films 239, 272 (1994).
- Gavriliuk et al. (2009) A. G. Gavriliuk, A. A. Mironovich, and V. V. Struzhkin, Rev. Sci. Instrum. 80, 043906 (2009).
- Piermarini et al. (1975) G. J. Piermarini, S. Block, J. D. Barnett, and R. A. Forman, J. Appl. Phys. 46, 2774 (1975).
- Cornut and Coqblin (1972) B. Cornut and B. Coqblin, Phys. Rev. B 5, 4541 (1972).
- Hanzawa et al. (1985) K. Hanzawa, K. Yamada, and K. Yosida, J. Magn. Magn. Mater 47, 357 (1985).
- Kaluarachchi et al. (2017) U. S. Kaluarachchi, S. L. Bud’ko, P. C. Canfield, and V. Taufour, Nat. Commun. 8, 546 (2017).
- Taufour et al. (2010) V. Taufour, D. Aoki, G. Knebel, and J. Flouquet, Phys. Rev. Lett. 105, 217201 (2010).
- Kotegawa et al. (2011) H. Kotegawa, V. Taufour, D. Aoki, G. Knebel, and J. Flouquet, J. Phys. Soc. Jpn. 80, 083703 (2011).
- Kittler et al. (2013) W. Kittler, V. Fritsch, F. Weber, G. Fischer, D. Lamago, G. André, and H. v. Löhneysen, Phys. Rev. B 88, 165123 (2013).
- Brando et al. (2016) M. Brando, D. Belitz, F. M. Grosche, and T. R. Kirkpatrick, Rev. Mod. Phys. 88, 025006 (2016).
- Belitz et al. (1997) D. Belitz, T. R. Kirkpatrick, and T. Vojta, Phys. Rev. B 55, 9452 (1997).
- Belitz et al. (1999) D. Belitz, T. R. Kirkpatrick, and T. Vojta, Phys. Rev. Lett. 82, 4707 (1999).
- Kabeya et al. (2012) N. Kabeya, H. Maekawa, K. Deguchi, N. Kimura, H. Aoki, and N. K. Sato, J. Phys. Soc. Jpn. 81, 073706 (2012).
- Taufour et al. (2016) V. Taufour, U. S. Kaluarachchi, R. Khasanov, M. C. Nguyen, Z. Guguchia, P. K. Biswas, P. Bonfà, R. De Renzi, X. Lin, S. K. Kim, E. D. Mun, H. Kim, Y. Furukawa, C.-Z. Wang, K.-M. Ho, S. L. Bud’ko, and P. C. Canfield, Phys. Rev. Lett. 117, 037207 (2016).
- Kaluarachchi et al. (2018) U. S. Kaluarachchi, V. Taufour, S. L. Bud’ko, and P. C. Canfield, Phys. Rev. B 97, 045139 (2018).
- Kotegawa et al. (2013) H. Kotegawa, T. Toyama, S. Kitagawa, H. Tou, R. Yamauchi, E. Matsuoka, and H. Sugawara, J. Phys. Soc. Jpn. 82, 123711 (2013).
- Friedemann et al. (2017) S. Friedemann, W. J. Duncan, M. Hirschberger, T. W. Bauer, R. Kuchler, A. Neubauer, M. Brando, C. Pfleiderer, and F. M. Grosche, Nat. Phys. 14, 62 (2017).
- Sidorov et al. (2002) V. A. Sidorov, M. Nicklas, P. G. Pagliuso, J. L. Sarrao, Y. Bang, A. V. Balatsky, and J. D. Thompson, Phys. Rev. Lett. 89, 157004 (2002).
- Knebel et al. (2008) G. Knebel, D. Aoki, J.-P. Brison, and J. Flouquet, J. Phys. Soc. Jpn. 77, 114704 (2008).
- Park et al. (2008) T. Park, V. A. Sidorov, F. Ronning, J.-X. Zhu, Y. Tokiwa, H. Lee, E. D. Bauer, R. Movshovich, J. L. Sarrao, and J. D. Thompson, Nature 456, 366 (2008).
- Trovarelli et al. (2000) O. Trovarelli, C. Geibel, S. Mederle, C. Langhammer, F. M. Grosche, P. Gegenwart, M. Lang, G. Sparn, and F. Steglich, Phys. Rev. Lett. 85, 626 (2000).
- Gegenwart et al. (2002) P. Gegenwart, J. Custers, C. Geibel, K. Neumaier, T. Tayama, K. Tenya, O. Trovarelli, and F. Steglich, Phys. Rev. Lett. 89, 056402 (2002).
- Custers et al. (2010) J. Custers, P. Gegenwart, C. Geibel, F. Steglich, P. Coleman, and S. Paschen, Phys. Rev. Lett. 104, 186402 (2010).
- Niklowitz et al. (2006) P. G. Niklowitz, G. Knebel, J. Flouquet, S. L. Bud’ko, and P. C. Canfield, Phys. Rev. B 73, 125101 (2006).
- Grosche et al. (2000) F. M. Grosche, P. Agarwal, S. R. Julian, N. J. Wilson, R. K. W. Haselwimmer, S. J. S. Lister, N. D. Mathur, F. V. Carter, S. S. Saxena, and G. G. Lonzarich, J. Phys. Condens. Matter 12, L533 (2000).