Block models for multipartite networks
Applications in ecology and ethnobiology
Abstract
Generalized multipartite networks consist in the joint observation of several networks implying some common individuals . Such complex networks arise commonly in social sciences, biology, ecology, etc. We propose a generative probabilistic model named Multipartite Blocks Model (MBM) able to unravel the topology of multipartite networks by identify clusters (blocks) of nodes sharing the same patterns of connectivity across the collection of networks they are involved in. The model parameters are estimated through a variational version of the Expectation-Maximization algorithm. The numbers of blocks are chosen with an Integrated Completed Likelihood criterion specifically designed for our model. A simulation study illustrates the robustness of the inference strategy. Finally, two datasets respectively issued from ecology and ethnobiology are analyzed with the MBM in order to illustrate its flexibility and its relevance for the analysis of real datasets.
The inference procedure is implemented in an R-package GREMLIN, available on Github (https://github.com/Demiperimetre/GREMLIN). Simulations are implemented as vignette of the package in order to ensure reproducibility of the results.
Keywords Networks; Latent Block Models; Stochastic Block Models; Variational EM; Model Selection; Ecology; Ethnobiology
1 Introduction
Networks have become fundamental tools in various fields, such as biology, ecological theory or sociology to name but a few.
Statistical analysis aims to study the structure of these networks for instance by unraveling the clusters or communities of individuals (nodes) shaping the observed interactions (see Kolaczyk,, 2009, for a review).
The recent years have witnessed a growing interest for multi-layer networks which is a classical but wide terminology for a collection of related networks (see Pilosof et al.,, 2017, for a review of multi-layer networks in ecology for instance).
Among others, multi-layer networks encompass dynamic networks, i.e. networks evolving with time (see Kim et al.,, 2018, for a review), multiplex networks when several types of relations are simultaneously studied on a common set of individuals (see Kéfi et al.,, 2016; Barbillon et al.,, 2016, for instance) and multipartite networks.
Multipartite networks are a generalization of bipartite networks. In a bipartite network, the nodes (representing the interacting entities) are partitioned into two disjoint sets and an edge links a node from one set to a node from the other set (see Figure 1, left). In a multipartite network, the nodes are divided into more than two sets and edges link entities from different sets (see Figure 1, middle).
In what follows, these pre-specified sets of nodes will be referred to as functional groups.
Such multipartite networks arise in ecology when studying the interactions between several groups of species such as the interactions plant/pollinator, plants/ants, etc Pocock et al., (2012); Dáttilo et al., (2016) or in biology when analyzing networks issued from multi-omics datasets involving proteins, etc. (see Pavlopoulos et al.,, 2018, for instance).
Generalized multipartite networks are an extension of multipartite networks: the nodes are still partitioned into functional groups but the interactions may occur not only between different functional groups but also inside some of the functional groups.
Ethnobiology (which is the scientific study of the relations between environment and people) provides such networks. One of the problematic of ethnobiology is to understand how social relations between individuals (seed circulation in our example)
may structure and guarantee biodiversity in the cultivated crop species (see Thomas and Caillon,, 2016, for example). As a consequence, the network of interest has two types of nodes –namely farmers and crop species– and we observe interactions between farmers and crop species (who grows what) and inside the group of farmers (seed exchange). Marketing also provides generalized multipartite networks
when individuals are connected through social networks and also interact with goods through their on-line purchases.
Many statistical tools have been proposed to analyze simple or bipartite networks. However, when individuals or biological entities are involved in several networks, there is a strong need to propose statistical tools handling these networks jointly. These tools are an essential step towards a better understanding of the global interaction systems at stake. The aim of this paper is to propose a probabilistic model suited for generalized multipartite networks.
A central issue in network analysis is to be able to cluster nodes sharing the same connectivity patterns. To do so, two approaches are possible, either relying on classical metrics detecting nestedness (Almeida-Neto et al.,, 2008), modularity (Barber,, 2007), etc, or adopting a probabilistic mixture strategy. Since the original paper by Snijders and Nowicki, (1997), probabilistic mixture models - classically referred as Stochastic Block models (SBM)– have proven their efficiency when aiming to cluster similar nodes based on their connectivity patterns without any a priori hypothesis about the patterns to be found (e.g. modularity, centrality, hierarchy). Latent Block Models (LBM) (Govaert and Nadif,, 2003) are the extension of SBM for bipartite networks, resulting into a bi-clustering of the nodes.
In this paper, we propose a new probabilistic mixture model adapted to generalized multipartite networks. This model assumes that each functional group is partitioned into clusters gathering nodes sharing the same connection behavior on the basis of all the networks they are involved in. The clusterings are introduced through latent variables resulting into a mixture model on edges.
Inferring the parameters of such a model with latent variables is a complex task, since the likelihood can not be computed in a close form. We resort to a Variational Expectation-Maximization (VEM) algorithm to estimate the parameters and supplying the multi-clustering of the nodes. The crucial task of estimating the numbers of clusters in each functional group is tackled though a model selection procedure based on an adapted penalized likelihood criterion namely Integrated Classification Likelihood (ICL).
Related works Some extensions of standard descriptive tools –such as community detection– to more complex networks have been proposed in the literature (see for instance Yang and Leskovec,, 2012; Gaskó et al.,, 2017). These metrics or descriptive tools have the drawback to only look for specific types of structures, contrary to clustering methods based on probabilistic mixture models. To the best of our knowledge, no such a probabilistic model has been proposed for generalized multipartite network. However, latent block models do exist for other kind of multi-layer networks. When the network is multiplex (i.e. when several types of interactions are studied on the same set of nodes), the SBM has been extended in Kéfi et al., (2016); Barbillon et al., (2016) by assuming a multivariate Bernoulli distribution to model the set of multiple edges between two individuals. Extending the SBM to a dynamic context where several snapshots of the networks at different time points are available, was proposed in numerous papers. A main difference between these papers is whether the evolution is considered as been discrete (Xu and Hero,, 2014; Matias and Miele,, 2017) or continuous (DuBois et al.,, 2013; Xin et al.,, 2017) in time.
Outline of the paper Section 2 is dedicated to the introduction of notations supplying a flexible tool to describe generalized multipartite networks. We also provide a description of the two datasets of interest and illustrate the notations on these specific cases. The block model for multipartite networks is described in Section 3. In Section 4, the variational inference the model selection procedure are presented including the practical implementation of the algorithm. Numerical illustrations of the robustness of the inference method are provided in Section 5. Finally, the statistical analyses of the two datasets with discussion are presented in Section 6. Perspectives are discussed in the last section. Note that this document is accompanied with a appendix sections divided into three parts: in the two first sections, the derivations of the update formulas for the VEM algorithm of the ICL criterion are provided; finally, detailed estimates on the two datasets are given.
2 Notations and data
A generalized multipartite network can be seen as a collection of networks involving functional groups: each network may be simple, i.e. describing the relations inside a given functional groups or bipartite, i.e. describing the relations between individuals belonging to two different functional groups. Let be the number of individuals in the -th functional group ().
We index the collection of networks by pairs of functional groups ( and in ).
The set denotes the list of pairs of functional groups for which we observe an interaction network.
For any , the interaction network is encoded in a matrix such that if there is an edge from unit of functional group
to unit of functional group , otherwise.
Each network may be binary () or valued ( or ). may be symmetric if the relation is non-oriented, non-symmetric otherwise.
encodes the generalized multipartite network.
For each network, is an additional notation which refers to the list of all the possible interactions.
Illustration The dataset 1 is issued from Dáttilo et al., (2016). This ecological network gathers mutualistic relations between plants and pollinators, plants and ants, and plants and frugivorous birds, resulting into functional groups, namely plants (), pollinators (), ants () and birds ( and . if the plant species has been observed at least once in a mutualistic interaction with the animal species of functional group during the observation period, otherwise. Data set is available at https://figshare.com/articles/Interaction_matrix_A_in_which_elements_aij_1_represent_the_presence_of_an_interaction_between_the_plant_species_i_and_the_animal_species_j_and_zero_for_no_observed_interaction/3443210/2.
The dataset 2 comes from Thomas and Caillon, (2016) and Thomas et al., (2015). They collected the oriented network of seed circulation between farmers –resulting in a non-symmetric adjacency matrix – and the crop species grown by the farmers, resulting in an incidence matrix. Noting for the farmers and for crop species we get . if farmer gives seeds to farmer (oriented relation), otherwise and if farmer cultivates crop species , 0 otherwise.
3 A block model for generalized multipartite networks
In order to account for heterogeneity among individuals, we propose a mixture model explicitly describing the way edges connect nodes in the various networks.
We assume that each functional group is divided into blocks (or equivalently clusters). and , let be
the latent random variable such that if individual of functional group belongs to cluster .
The random variables ’s are assumed to be independent and such that: :
| (1) |
with , and , .
We set , and .
Then, the nodes connect as follows: for any ,
,
| (2) |
depends on the relation represented in . We assume that for any , is either the Bernoulli distribution if the relation in is binary, or the Poisson distribution if is a counting or the Gaussian distribution if encodes a continuous strenght of interaction. Equations (1) and (2) define the so-called Multipartite Block Model (MBM).
Remark 1
Our model is a generalization of the SBM and the LBM. Indeed, Equations (1)-(2) reduce to the SBM if and to the LBM if . Our extension assumes that the latent structures are shared among the i.e. if a functional group is at stake in several , the same impacts the distributions of the corresponding interaction matrices. In other words, the clusters gather individuals sharing the same properties of connection in the collection of networks. Obviously, if each functional group appears in only one element of , the MBM reduces to independent SBMs or LBMs. In terms of probabilistic dependence, conditionally on , the are independent. However, being latent, their marginalization introduces dependence not only between the but also between the matrices . As a consequence, the clustering variables are dependent once conditioned by .
For a given vector , let be the unknown parameters of the MBM where are the connection parameters, with . We have to perform two inference tasks: first, for a given vector , estimating and , second, selecting the right .
4 Parameter inference and model selection
Let denote the complete likelihood of the observations and the latent variables for parameter . Equations (1) and (2) lead to:
| (3) |
where is the log-density of . If , . If the interaction are oriented, then ; otherwise . being latent variables, the likelihood is obtained by integrating over all the possible values of denoted :
| (4) |
The summation over in Equation (4) becomes quickly computationally intractable when ’s and/or the ’s increase. Moreover, we are interested in inferring the clusterings .
4.1 Variational EM algorithm
In such models with latent variables, the EM algorithm (Dempster et al.,, 1977) is a standard tool to maximise the likelihood, taking advantage of the simple form of . However, when conditioned by the observations , the are not independent (see Remark 1). As a consequence, the E step of the EM algorithm –which consists in the integration of against – has no explicit expression. In the context of the SBM and the LBM, the variational version of the EM (VEM) algorithm has proved to be a powerful tool for maximum likelihood inference (see Govaert and Nadif,, 2008; Daudin et al.,, 2008). In the VEM, the problem of the E-step is tackled by replacing by an approximation sought among distributions enforcing independence between the ’s:
At the VE-step, is chosen such that the Kullback-Leibler divergence is minimized.
The M-step is :
Iterating steps (VE) and (M) leads to the maximisation of a lower boud of the likelihood:
.
For the MBM, at iteration , the algorithm VEM is as follows:
VEM for MBM
VE Step. Find solving
M Step. Update of the parameters:
| (5) |
Remark 2
Formula (5) on is valid for the expectations of the Bernoulli, the Poisson and the Gaussian distributions. If is a Gaussian distribution of variance , then:
The details of the VEM algorithm are provided in the Section A. As for any EM-type algorithm, its initialization is critical and will be discussed later. , denotes the VEM estimates. A by-product of this algorithm is an approximation of the conditional distribution by . is thus estimated by:
| (6) |
The consistency of the VEM estimates has been established for the SBM by Bickel et al., (2013) and the LBM by Brault et al., (2017) while Mariadassou and Matias, (2015) study the behavior of for the same models.
4.2 A penalized likelihood criterion
In practice, the number of clusters is unknown and should be estimated. We adopt a model selection strategy where a model refers to the MBM with clusters. Among many classical model selection criterion such as AIC, BIC and their variants, Biernacki et al., (2000) proposed the Integrated Classification Likelihood (ICL). ICL has proven its capacity to outline the clustering structure in networks in Daudin et al., (2008) (for simple networks), Keribin et al., (2014) (for bipartite networks) or Mariadassou et al., (2010) for valued networks. Its success comes from the fact that when traditional model selection criterion essentially involves a trade-off between goodness of fit and model complexity, ICL values not only goodness of fit but also clustering sharpness. Following the same line, we propose a modification of the ICL adapted to generalized multipartite networks:
| (7) |
where
and has been defined in Equation (6). The better model is chosen as . The penalization term is made up of two parts: corresponds to the clustering distribution and involves the number of nodes, while the other term depends on the size of and the numbers of possible edges in each network . The derivation of the ICL criterion is detailed in the Section B.
4.3 Practical algorithm
The practical choice of the model and the estimation of its parameters are computational intensive tasks. Assume that , then, ideally, we should compare models through the ICL criterion. For each model, the VEM algorithm has to be run starting from a large number of initialization points chosen carefully (due to its sensitivity to the starting point), resulting in an unreasonable computational cost. Instead, we propose to adopt a stepwise strategy, resulting in a faster exploration of the model space combined with efficient initializations of the VEM algorithm. The procedure we suggest is the following one.
Given a current model , the -th iteration of the procedure is written as follows.
Model selection strategy for MBM
Split proposals. For any such that , consider the model
-
Propose initializations by splitting any of the current clusters into two clusters.
-
From each of the initialization points, run the VEM algorithm and keep the better variational estimate .
-
Compute the corresponding from formula (7).
Merge proposals. For any such that , consider the model
-
Propose initializations by merging any pairs of clusters among the clusters.
-
From each initialization point, run the VEM algorithm and keep the better variational estimate
-
Compute the corresponding .
Set where .
If iterate, otherwise stop.
Initializing the VEM from the clusters obtained on a smaller or larger model is much more efficient than other strategies such as random initialization or spectral clustering. Note that the tasks at each iteration can be parallelized.
5 Illustration on simulated datasets
We illustrate the efficiency of our inference procedure on simulated data. Simulation parameters We generate datasets mimicking the two real datasets studied in Section 6, i.e. we generate datasets under the following two scenarios.
Simulations are implemented as vignette of the R-package available on Github (https://github.com/Demiperimetre/GREMLIN) in order to ensure reproducibility of the results.
Scenario 1: We set functional groups of respective sizes , and . The simulation parameters are the following: , , ,
| (8) |
Scenario 2: Mimicking our second dataset, we set functional groups such that , and . The simulation parameters are: , .
On each simulated dataset, we run the algorithm described in Section 4.3 with , for all . We start the stepwize algorithm on and on the clusterings obtained by inferring the LBM separately on each matrix . For each dataset, it takes a few minutes for the algorithm to converge.
Results for Scenario 1
| Nb of simulations | ||||
| 7 | 2 | 2 | 1 | 73 |
| 7 | 2 | 1 | 1 | 6 |
| 7 | 1 | 2 | 1 | 3 |
| 6 | 2 | 2 | 1 | 18 |
| Biais | RMSE | Biais | RMSE | Biais | RMSE | Biais | RMSE | Biais | RMSE |
|---|---|---|---|---|---|---|---|---|---|
| -9e-04 | 0.0102 | 0 | 0.0011 | 0 | 4e-04 | 1e-04 | 6e-04 | -1e-04 | 9e-04 |
| 8e-04 | 0.0064 | 1e-04 | 2e-04 | -0.0036 | 0.0557 | 0.0013 | 0.0085 | 0 | 0 |
| 1e-04 | 7e-04 | -1e-04 | 4e-04 | 0 | 0 | 0 | 2e-04 | 0.0026 | 0.0155 |
| 2e-04 | 0.0194 | 4e-04 | 0.0038 | 0.0038 | 0.0515 | -6e-04 | 0.0119 | 0 | 0 |
| 0.0024 | 0.0281 | -0.0023 | 0.0099 | 0 | 0 | 0 | 0 | -0.0012 | 0.0077 |
| 0 | 0 | 0 | 0 | 0 | 0 | 0 | 0 | -0.0081 | 0.0323 |
| 0 | 0 | 0 | 0 | 0.002 | 0.0553 | -0.0039 | 0.0212 | 0 | 0 |
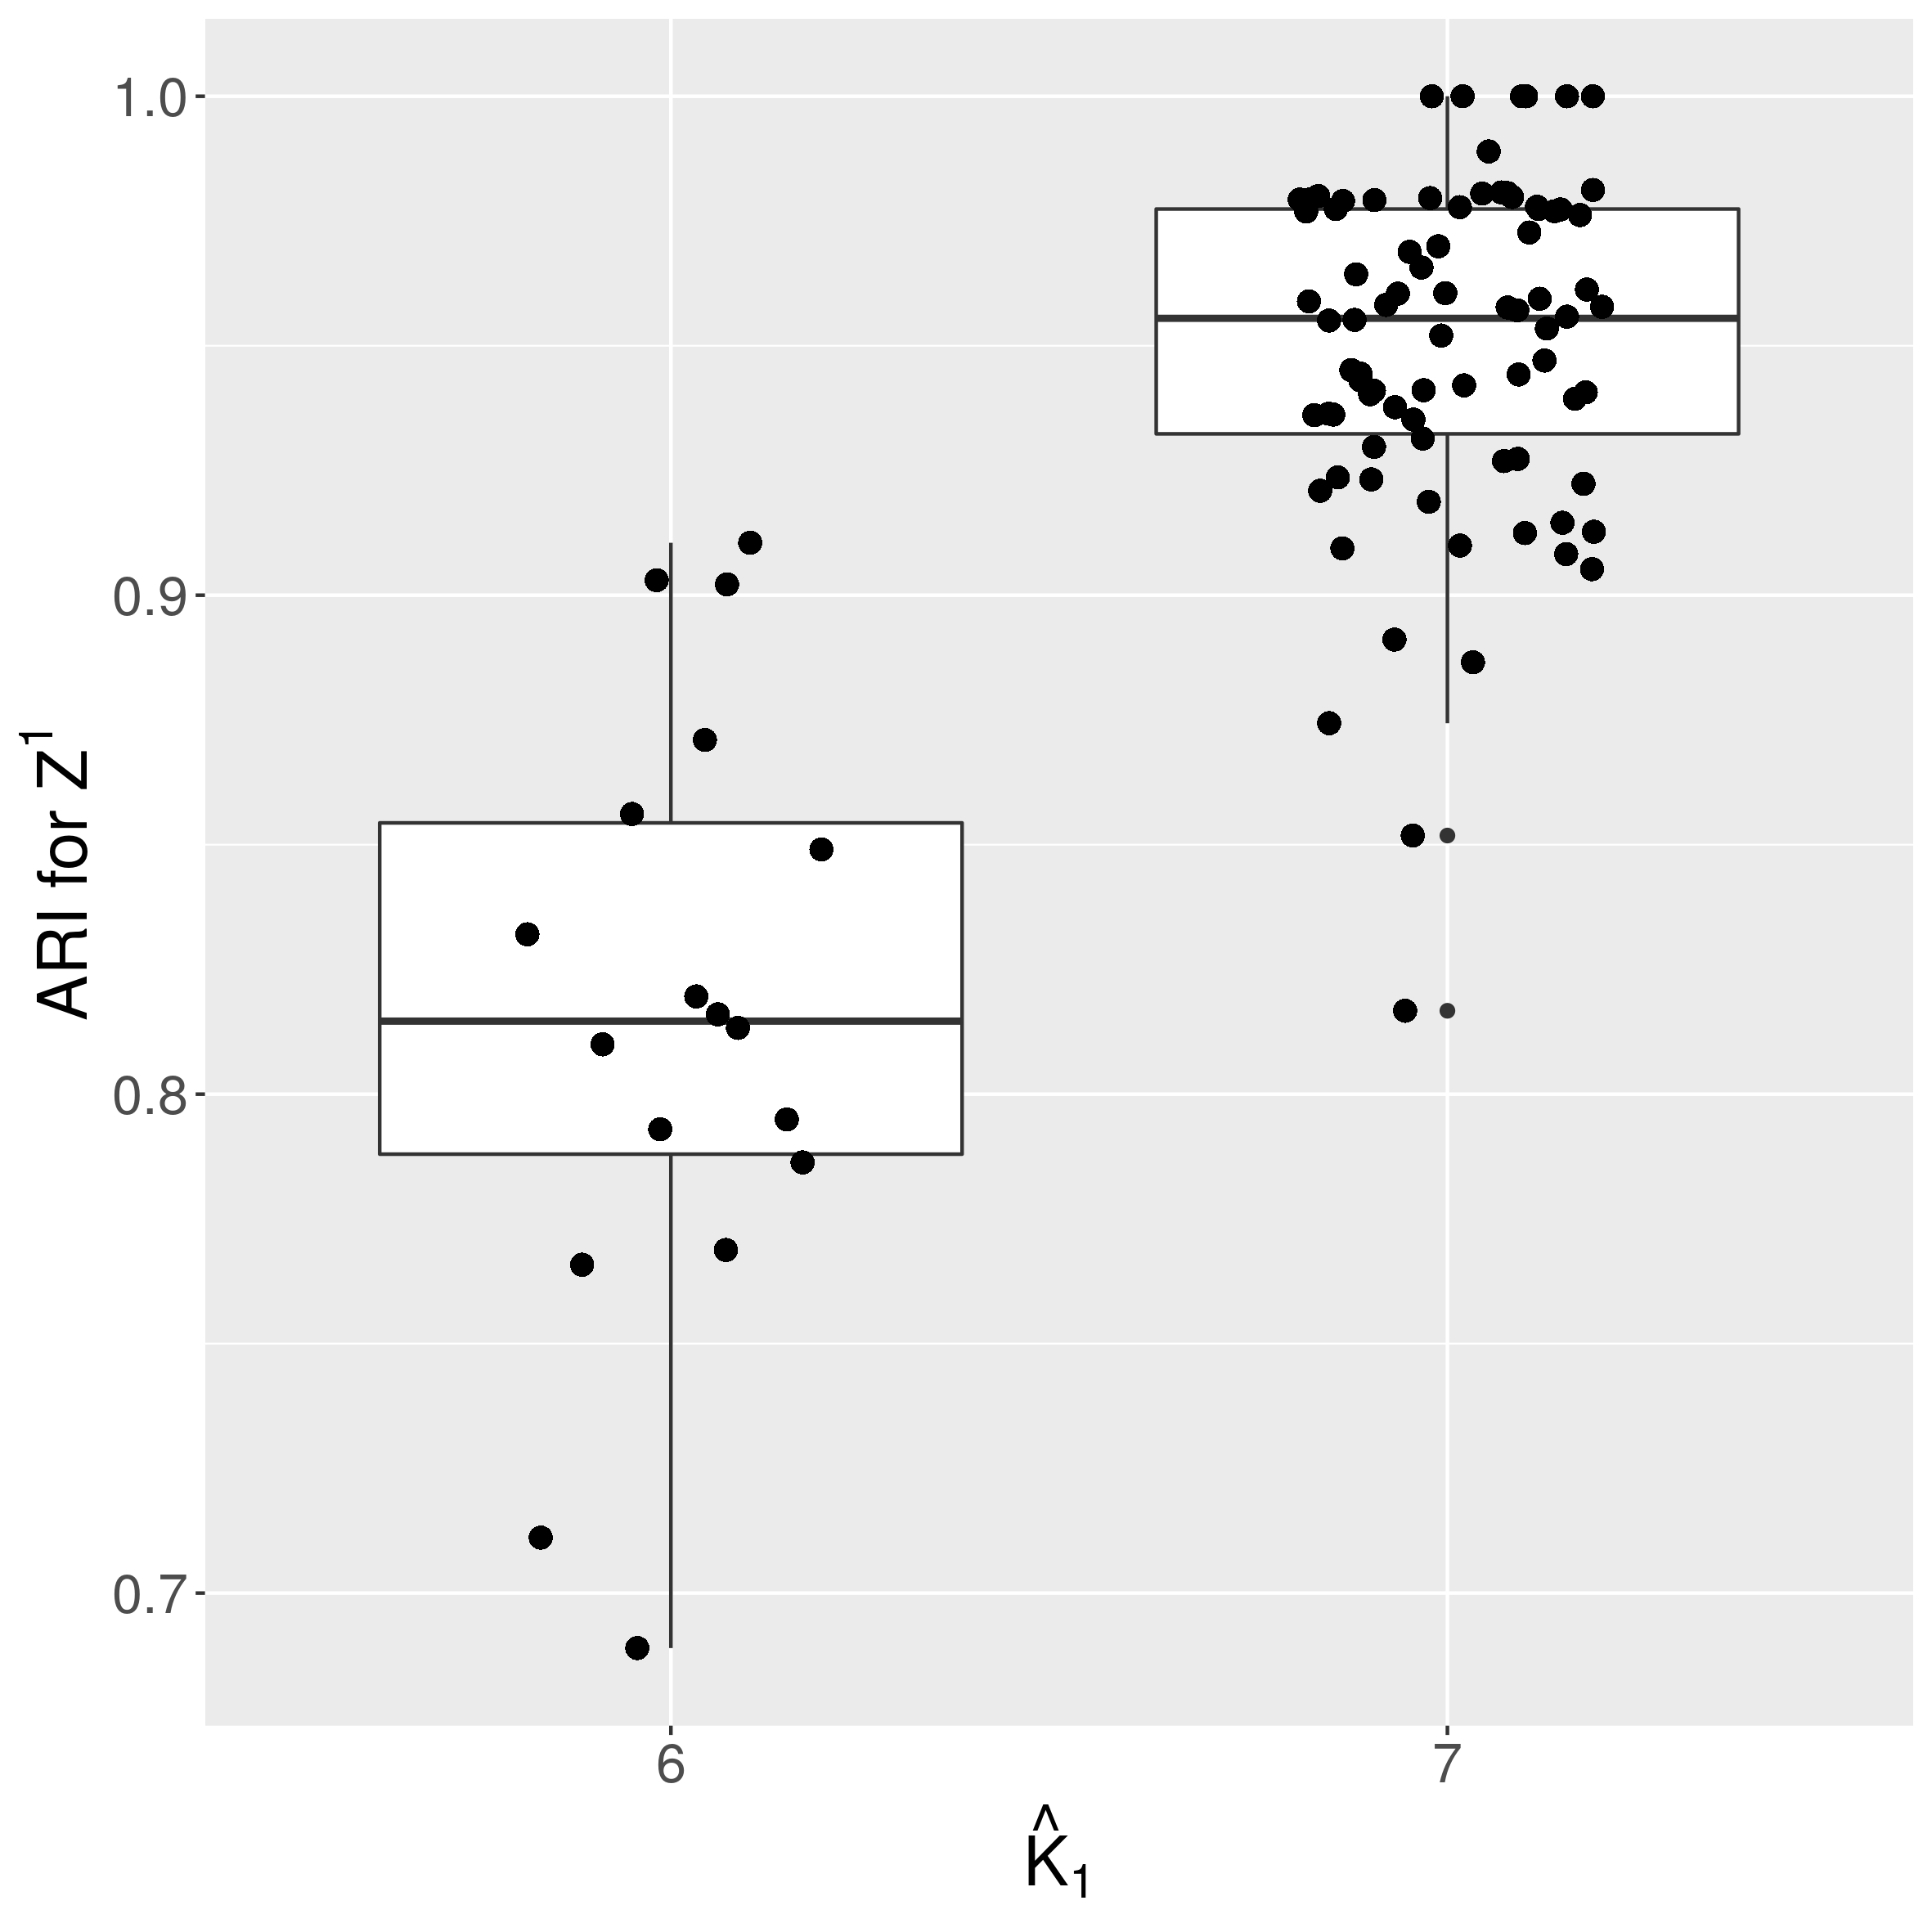
Among the simulated datasets, the true numbers of clusters are exactly recovered for datasets as can be seen in Table 1. Three other estimated configurations are observed as detailed in Table 1, each of them corresponding to .
A scrutiny shows that cases where is estimated to instead of correspond to datasets where one simulated cluster (meaning the simulated is reduced to or individuals.
We measure the ability of the procedure to recover the clusters by computing the Adjusted Rand Index (ARI by Hubert and Arabie,, 1985) between and the simulated . ARI compares two clusterings with a correction for chance. It is close to when the two clusterings are independent and equals when the clusterings are identical (up to label switching).
The boxplots of the ARI’s are plotted in Figure 2(a). All the ARI are high (, even when , which means that the clusters are always globally recovered and the structure of the multipartite network is well discovered.
We also investigate the quality of the parameters estimation. For the datasets such that , we compare the estimated parameters to the simulation parameters (after a relabeling of the clusters to match the true clustering, if required). The results in terms of biais and Root Mean Square Error (RMSE) are reported in Table 2.
We observe that the parameters are estimated without noticeable biases and with small RMSE. In particular, the null ’s are always recoverered.
Results for Scenario 2
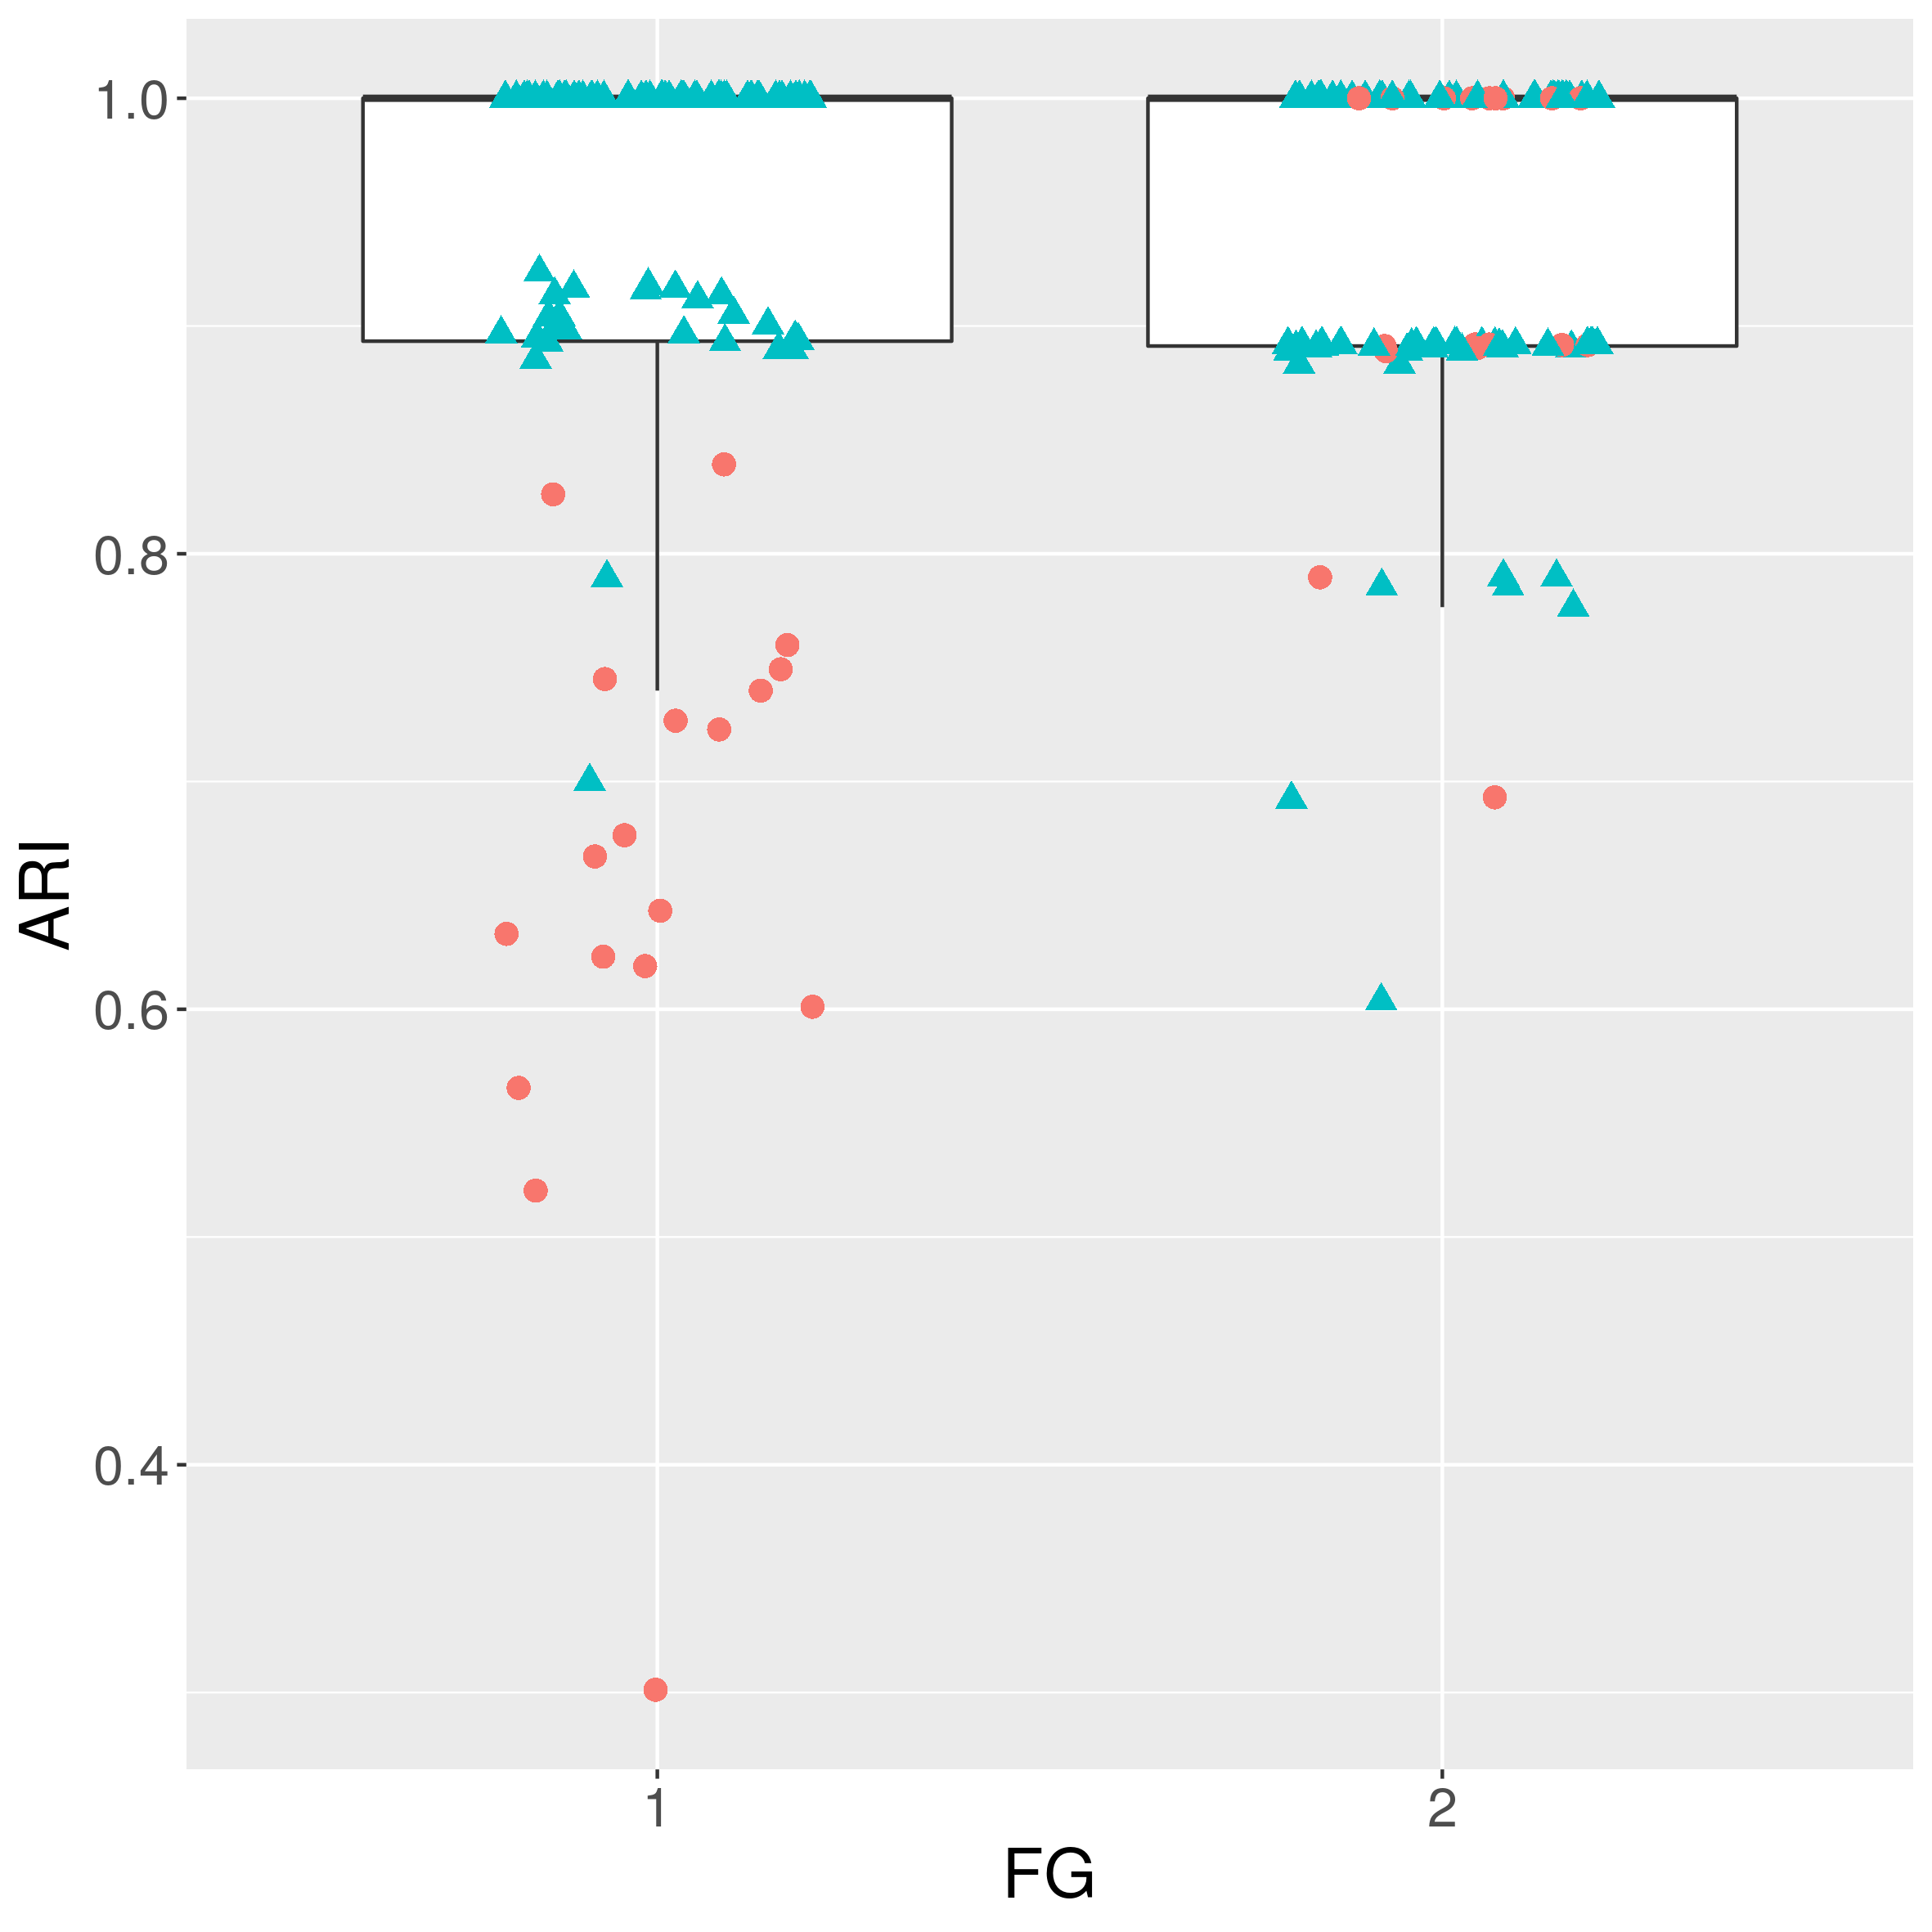
The same analysis is done for Scenario 2. for simulated datasets over . The unique alternative observed configuration is .
Here again, in order to assess the ability of the method to recover the clusters, we compute the ARI for and . These quantities are reported in Figure 2(b) for the two functional groups (left au right) and for (triangles) and (circles). As can be noticed, the clusterings are well recovered when the number of clusters are exactly recovered (triangle), with a noticeable number of cases where the clusters are exactly recovered (ARI). As expected, we observe a lower ARI when (circle), but with globally high values.
We also pay attention to the estimation of the parameters of connection . Biais and RMSE are reported in Table 3. Once again, the biais and RMSE are small.
| Biais | RMSE | Biais | RMSE | Biais | RMSE | Biais | RMSE | Biais | RMSE |
|---|---|---|---|---|---|---|---|---|---|
| -0.0039 | 0.0211 | -1e-04 | 0.0299 | -5e-04 | 0.0271 | -0.0043 | 0.0263 | -0.0192 | 0.0552 |
| 0.0021 | 0.0342 | -0.0014 | 0.045 | 6e-04 | 0.0264 | -0.007 | 0.0348 | -0.026 | 0.0378 |
| -0.0041 | 0.0636 | -0.0032 | 0.0479 | 0.003 | 0.0826 | -0.0179 | 0.0377 | -0.0202 | 0.0534 |
6 Applications
6.1 Ecology: interactions plants / animals
Dataset The dataset –compiled and conducted by Dáttilo et al., (2016) at Centro de Investigaciones Costeras La Mancha (CICOLMA), located in Mexico– involves three general types of plant-animal mutualistic interaction: pollination, seed dispersal by frugivorous birds, and protective mutualisms between ants and plants with extrafloral nectaries. The dataset –which is one of the largest compiled so far with respect to species richness, number of interactions and sampling effort– includes plant species, pollinator species, frugivorous bird species and ant species, inducing observed interactions of which are plant-pollinator interactions, are plant-birds interactions and are plant-ant interactions.
Inference We run the procedure described in Subsection 4.3 starting from several automatically chosen initial points , with numbers of clusters bounded between and . The computational time on an Intel Xeon(R) CPU E5-1650 v3 3.50GHz x12 using cores is less than 10 minutes. The ICL criterion selects clusters of plants, clusters of pollinators, cluster of birds and clusters of ants. The estimated parameters are reported in Tables 5 and 6 in the supplementary material. They are really similar to the ones used for the simulation study and provided in Equation 8. The resulting mesoscopic view of the multipartite network is plotted in Figure 3.
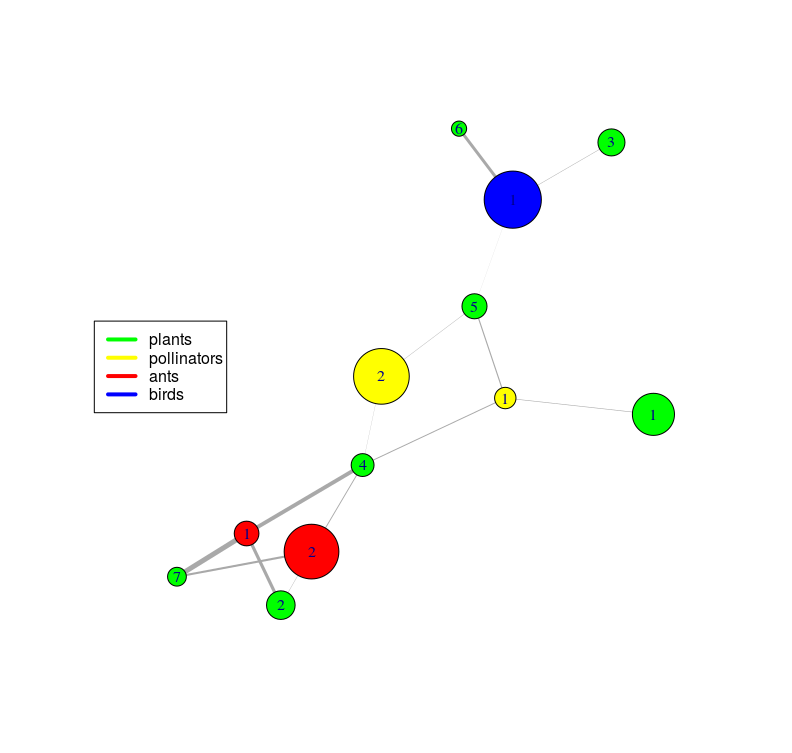
Discussion From Figure 3, we conclude that plants of Clusters and only interact with ants (plants of Cluster attract more ant species belonging to Cluster ). The plants of Clusters and are only in interaction with birds, the difference between the two clusters being due to the strength of the connection. The difference between the two clusters of pollinators derives from the existence of Cluster of plants.
In order to illustrate the contribution of our method, we also analyze each bipartite network separately (using an LBM) and compare the results in terms of clustering. The clusterings are compared through the Adjusted Rand Index (ARI): if then the clusterings are equal (up to a label switching transformation). The ARIs are given in Table 4.
Using standard LBM, we obtain clusters of ants, cluster of birds and clusters of pollinators. The clusterings of ants and birds are not modified by the ecosystemic approach, their ARI being equal to . The clustering of the pollinators is slightly modified, going from clusters to clusters but the additional block only contains few individuals, thus leading to a high ARI. Since the plants functional group is involved in the three bipartite networks, we obtain clusterings when analyzing them separately. These three clusterings are –as expected– very different from our MBM clustering (the ARIs being respectively equal to , and , see Table 4). When aiming at proposing a clustering taking into account the bipartite networks, one may adopt a naive strategy by combining (by intersection) these three clusterings. We then obtain blocks of plants and the ARI with the MBM clustering is . However, this number of clusters () is too large with respect to the model selection criterion. Our MBM clustering is a parsimonious trade-off.
Finally, Figure 3 highlights the central role played by the pollinators in the complete network also involving ants and seed dispersal birds. Our ecosystemic approach unables us to unravel such a central position of pollinators in general with respect to ants and seed dispersal birds, which would have been impossible when performing separate analysis.
| Full/Flovis | Full/Ants | Full/Birds | Full/Inter | |
|---|---|---|---|---|
| Plants | (7/3) | (7/3) | (7/3) | (7/12) |
| 0.118 | 0.415 | 0.163 | 0.617 | |
| Flovis | (2/3) | |||
| 0.997 | ||||
| Ants | (2/2) | |||
| 1.000 | ||||
| Birds | (1/1) | |||
| 1.000 |
6.2 Seed circulation and crop species inventory
Dataset Seed circulation among farmers is a key process that shapes crop diversity (Coomes et al.,, 2015; Pautasso et al.,, 2013). Data on seed circulation within a community of first-generation migrants ( farmers) were collected by a field survey in the island of Vanua Lava in the South Pacific archipelago nation of Vanuatu. A farmer is considered as a giver for another farmer if he/she has given at least one crop since they arrived in the new settlement site in Vanua Lava. It results in a connected and directed network of seed circulation. Besides the circulation network, inventory data for each farmer were also collected. They consist in the list of crop landraces they grow. This was aggregated at the species level, leading to crop species. These inventory data can be seen as a bipartite network. The seed circulation data were analyzed in Thomas and Caillon, (2016) and the inventory data were analyzed in a meta-analysis in Thomas et al., (2015). On the basis on the joint modeling we propose in this paper, we aim to provide a clustering on farmers and crop species on the basis of the seed circulation network and the inventory bipartite network.
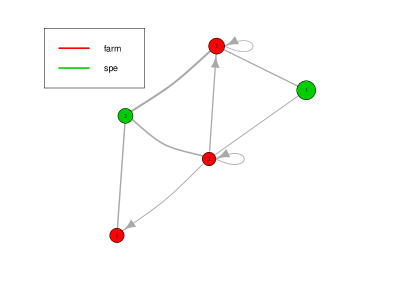
Inference Three clusters of farmers and two clusters of crop species were selected. The inferred parameters are given in Table 7 and a a mesoscopic view is displayed in Figure 4. The clusters were renumbered to make them correspond to the probability of connection: the larger cluster number, the larger marginal probability of connection for the members of the cluster.
Discussion The discovered clusters are straightforwardly interpretable: Cluster 3 gathers farmers who circulate seeds within the cluster and give to the two other clusters, Cluster 2 circulates seeds within the cluster contrary to Cluster 1 who only receives from Cluster 3; the two clusters of crop species are Cluster 2 with more common crop species and Cluster 1 with other species. Clusters 3 and 2 of farmers grow crop species from Clusters 1 and 2 whereas Cluster 1 of farmers grows mainly crop species from Cluster 2. It turns out that Cluster 3 gathers mainly the first migrants and Cluster 1 the last migrants. The pattern of connection is then explained by the fact that first migrants helped the others to settle by providing seeds. Moreover, the first migrants had more time to collect more crop species to grow. In order to compare the clusterings obtained by the MBM and the ones obtained from the circulation network (clustering on farmers from SBM) and the inventory network (clusterings of farmers and plants with a LBM), we compute the ARI. The clusterings on crop species remain quite close since their ARI is equal to . However, the clusterings on farmers are quite different (ARI smaller than ), indeed the MBM shall make a trade off between the circulation and the inventory for farmers. To ease the comparison between clusterings on farmers, the same renumbering rule was applied for all the different clusterings so that the larger cluster numbers correspond to larger marginal probability of connection. Figure 5 is an alluvial plot which compares the three obtained clusterings of farmers. It shows how the trade-off is made between the two stand-alone clusterings in the MBM clustering. It appears quite obvious that Cluster 1 given by the MBM gathers only farmers from Cluster 1 in the seed circulation network and from Clusters 1 and 2 from the inventory data since this cluster aggregates farmers with fewer connections and who grow less crop species than the others. The same kind of observation can be made for Cluster 3 given by the MBM which aggregates farmers who were in the cluster of the most connected farmers and in the two clusters of farmers who grow more seed.

7 Discussion
In this paper, we proposed an extension of LBM and SBM which can handle multipartite networks, resulting in the so-called MBM.
Multipartite networks encompass a lot of various situations such as the two examples dealt with in the paper. Besides,
MBM can be also useful for many other contexts with different multipartite structures.
The main limiting factor of the parameter inference and model selection methods we propose, is the size of networks. Indeed,
the inference algorithm is suitable for networks up to nodes in order to keep computational time reasonable.
If willing at studying larger networks, one should develop adapted inference algorithms.
Several extensions can be thought of with no additional significant difficulty.
For instance, covariates can be taken into account by writing where are the covariates describing the pair of individuals .
A more challenging extension could be to include extra parameters in the model to
account for degree heterogeneity in the vein of the degree-corrected SBM
(Karrer and Newman,, 2011). However, this should lead to cluster individuals independently of their degrees which is not always desirable. For instance in the seed circulation example, the in-degrees and out-degrees of farmers are key factors to explain their social structure. In the interaction networks in ecology, distinguishing generalist (high degree) from specialist (low degree) species is a part of the expected outcomes of the clusterings. More recent works (Zhu et al.,, 2014) propose to use node degrees and edge orientations to help the clustering while tolerating heavy-tailed distribution of degrees. Incorporating these variants may be of interest in the MBM framework and could lead to further developments.
In a more general perspective, the study of ecological or sociological interactions supplies a wide variety of complex networks such as multilevel networks or multi-layer networks(Pilosof et al.,, 2017; Lazega and Snijders,, 2015). Some of them can be treated as multipartite networks and then by a MBM (possibly by incorporating some extensions discussed above). The others require the development of suited models which might also rely on a latent variable modeling. They will be the subject of future works.
Appendix A Variational EM for MBM: details
The variational version of the EM algorithm maximizes a lower bound of the observed likelihood. More precisely, let be any probability distribution on , we define as:
| (9) | |||||
| (10) | |||||
| (11) |
where is the Kullback-Leibler divergence and is the entropy of . The inequality in (11) derives from the positivity of the divergence. The equality holds iff which results in the classical identity of the EM algorithm (Dempster et al.,, 1977).
The principle of the VEM algorithm is to choose in a family of distributions parametrized by , such that the conditional expectation can be computed explicitly. Iteration of VEM consists in the two following steps:
-
M Step
-
VE Step
The variational EM generates a sequence increasing the lower bound of the likelihood .
Choice of
The key point of the procedure is the choice of , making the calculus tractable but rich enough to be a good approximation of the true conditional distribution . Following Govaert and Nadif, (2008) and Daudin et al., (2008), we adopt the mean-field strategy (Jaakkola,, 2000) and chose as:
where is the density of a trial - multinomial distribution of parameter , i.e. is such that the latent variables are independent and with
From this particular choice of , we derive the VE-step and M-step for the MBM in what follows.
Explicit expression for
Using the expression of the complete log-likelihood given in Equation (3), we obtain:
| (12) |
| (13) |
has to be carefully calculated, when . To that purpose, let us introduce the following notations :
-
, is the set of incidence matrices involving the functional group .
-
we define :
Using these notations we detail the expression of .
As a consequence, we get:
| (14) |
Optimization of with respect to , ( being fixed)
For a fixed , we need to find such that , , :
| (15) |
where are the Lagrange multipliers. Combining Equations (12) and (14), we get:
This system has no explicit solution but can be solved numerically using a fixed point strategy as in Daudin et al., (2008).
Optimization of with respect to , being fixed.
We have to compute the derivatives of with respect to , the variational parameters being fixed. We thus obtain: :
and :
Clustering and initializations
We denote by and the resulting estimates. The estimated clustering is the maximum a posteriori (MAP) estimate: ,
Appendix B Derivation of the ICL criterion
As exposed in Section 4.2 of the paper, we resort to the ICL criterion to perform model selection. The ICL is an asymptotic approximation of the integrated marginal complete likelihood. We supply here the details of the calculations.
Explicit expression of the marginal complete likelihood
The ICL being a based on a Bayesian model selection criterion, we first set the following prior distribution:
| (17) |
where denotes the Beta distribution and is the Dirichlet distribution. By definition,
The prior on being such that we obtain:
Taking advantage of the conditional independences in the model defined by Equations (1) and (2) combined with the independence of the parameters in the prior distribution, we can decompose into the following sum:
Using the fact that with
| (18) |
and the conjugacy of the Dirichlet prior distribution, we easily deduce the following formula:
where is the Gamma function.
Asymptotic approximation
Using the same arguments as in Daudin et al., (2008) and Brault, (2014), we obtain the following asymptotic approximation. Assume that , then :
where
The first term comes from the application of the Stirling formula to the Gamma function when approximating . The second term comes from a BIC approximation of the part . Obviously, the parameters of the prior distribution disappear from the formula since asymptotically the importance of the prior distribution vanishes.
Appendix C Detailed Estimates for the MBM on the two Datasets
| Pollinators | Ants | Birds | ||||
|---|---|---|---|---|---|---|
| 1 | 2 | 1 | 2 | 1 | ||
| Plants | 1 | 0.0957 | 0.0075 | 0 | 0.0006∗ | 0.0013∗ |
| 2 | 0.0042∗ | 0 | 0.5431 | 0.0589 | 0 | |
| 3 | 0 | 0.0003∗ | 0 | 0 | 0.0753 | |
| 4 | 0.1652 | 0.0343 | 0.6620 | 0.1542 | 0 | |
| 5 | 0.1918 | 0.0638 | 0 | 0 | 0.0163 | |
| 6 | 0 | 0 | 0 | 0 | 0.5108 | |
| 7 | 0 | 0 | 0.8492 | 0.3565 | 0 | |
| 1 | 0.4675 | 1 | 0.06 | ||
| 2 | 0.1606 | 2 | 0.94 | ||
| 3 | 0.1351 | 1 | 0.1 | ||
| 4 | 0.0784∗ | 2 | 0.9 | ||
| 5 | 0.1061 | 1 | 1 | ||
| 6 | 0.0142 | ||||
| 7 | 0.0380 |
| Farmers | Species | ||||||
|---|---|---|---|---|---|---|---|
| 1 | 2 | 3 | 1 | 2 | |||
| 0.31 | 0.42 | 0.27 | 0.65 | 0.35 | |||
| Farmers | 1 | 0.025∗ | 0.123∗ | 0.053∗ | 0.186 | 0.653 | |
| 2 | 0.159∗ | 0.300 | 0.070∗ | 0.559 | 0.905 | ||
| 3 | 0.374 | 0.585 | 0.357 | 0.390 | 0.696 | ||
Acknowledgements
We thank Sophie Caillon (CEFE) for sharing the seed circulation and inventory data, Sophie Caillon and Mathieu Thomas (CIRAD) for related discussion concerning the analysis. Support of the ongoing research collaboration through the MIRES network was provided by the Institut National de la Recherche Agronomique (INRA). P. Barbillon and S. Donnet are funded by the ANR project Econet.
References
- Almeida-Neto et al., (2008) Almeida-Neto, M., Guimaraes, P., Guimaraes Jr, P. R., Loyola, R. D., and Ulrich, W. (2008). A consistent metric for nestedness analysis in ecological systems: reconciling concept and measurement. Oikos, 117(8):1227–1239.
- Barber, (2007) Barber, M. J. (2007). Modularity and community detection in bipartite networks. Physical Review E, 76(6):066102.
- Barbillon et al., (2016) Barbillon, P., Donnet, S., Lazega, E., and Bar-Hen, A. (2016). Stochastic block models for multiplex networks: An application to a multilevel network of researchers. Journal of the Royal Statistical Society. Series A: Statistics in Society.
- Bickel et al., (2013) Bickel, P., Choi, D., Chang, X., and Zhang, H. (2013). Asymptotic normality of maximum likelihood and its variational approximation for stochastic blockmodels. Ann. Statist., 41(4):1922–1943.
- Biernacki et al., (2000) Biernacki, C., Celeux, G., and Govaert, G. (2000). Assessing a mixture model for clustering with the integrated completed likelihood. Pattern Analysis and Machine Intelligence, IEEE Transactions on, 22(7):719–725.
- Brault, (2014) Brault, V. (2014). Estimation et sélection de modèle pour le modèle des blocs latents. PhD thesis, University Paris-Sud, France. Thèse de doctorat dirigée par Celeux, Gilles Mathématiques Paris 11 2014.
- Brault et al., (2017) Brault, V., Keribin, C., and Mariadassou, M. (2017). Consistency and Asymptotic Normality of Latent Blocks Model Estimators. working paper or preprint.
- Coomes et al., (2015) Coomes, O. T., McGuire, S. J., Garine, E., Caillon, S., McKey, D., Demeulenaere, E., Jarvis, D., Aistara, G., Barnaud, A., Clouvel, P., et al. (2015). Farmer seed networks make a limited contribution to agriculture ? four common misconceptions. Food Policy, 56:41–50.
- Dáttilo et al., (2016) Dáttilo, W., Lara-Rodríguez, N., Jordano, P., Guimarães, P. R., Thompson, J. N., Marquis, R. J., Medeiros, L. P., Ortiz-Pulido, R., Marcos-García, M. A., and Rico-Gray, V. (2016). Unravelling Darwin’s entangled bank: architecture and robustness of mutualistic networks with multiple interaction types. Proceedings of the Royal Society of London B: Biological Sciences, 283(1843).
- Daudin et al., (2008) Daudin, J. J., Picard, F., and Robin, S. (2008). A mixture model for random graphs. Statistics and Computing, 18(2):173–183.
- Dempster et al., (1977) Dempster, A., Laird, N., and Rubin, D. (1977). Maximum likelihood from incomplete data via the EM algorithm. Jr. R. Stat. Soc. B, 39:1–38.
- DuBois et al., (2013) DuBois, C., Butts, C., and Smyth, P. (2013). Stochastic blockmodeling of relational event dynamics. In Artificial Intelligence and Statistics, pages 238–246.
- Gaskó et al., (2017) Gaskó, N., Bota, F., Suciu, M., and Lung, R. I. (2017). Community structure detection in multipartite networks: A new fitness measure. In Proceedings of the Genetic and Evolutionary Computation Conference, GECCO ’17, pages 259–265, New York, NY, USA. ACM.
- Govaert and Nadif, (2003) Govaert, G. and Nadif, M. (2003). Clustering with block mixture models. Pattern Recognition, 36(2):463 – 473. Biometrics.
- Govaert and Nadif, (2008) Govaert, G. and Nadif, M. (2008). Block clustering with bernoulli mixture models: Comparison of different approaches. Computational. Statistics and Data Analysis, 52(6):3233–3245.
- Hubert and Arabie, (1985) Hubert, L. and Arabie, P. (1985). Comparing partitions. Journal of Classification, 2:193–218.
- Jaakkola, (2000) Jaakkola, T. S. (2000). Tutorial on variational approximation methods. In In Advanced Mean Field Methods: Theory and Practice, pages 129–159. MIT Press.
- Karrer and Newman, (2011) Karrer, B. and Newman, M. E. (2011). Stochastic blockmodels and community structure in networks. Physical review E, 83(1):016107.
- Keribin et al., (2014) Keribin, C., Brault, V., Celeux, G., and Govaert, G. (2014). Estimation and selection for the latent block model on categorical data. Statistics and Computing, pages 1–16.
- Kim et al., (2018) Kim, B., Lee, K. H., Xue, L., Niu, X., et al. (2018). A review of dynamic network models with latent variables. Statistics Surveys, 12:105–135.
- Kolaczyk, (2009) Kolaczyk, E. D. (2009). Statistical Analysis of Network Data: Methods and Models. Springer Publishing Company, Incorporated, 1st edition.
- Kéfi et al., (2016) Kéfi, S., Miele, V., Wieters, E. A., Navarrete, S. A., and Berlow, E. L. (2016). How structured is the entangled bank? the surprisingly simple organization of multiplex ecological networks leads to increased persistence and resilience. PLOS Biology, 14(8):1–21.
- Lazega and Snijders, (2015) Lazega, E. and Snijders, T. A. B. (2015). Multilevel Network Analysis for the Social Sciences: Theory, Methods and Applications. Methodos Series. Springer International Publishing.
- Mariadassou and Matias, (2015) Mariadassou, M. and Matias, C. (2015). Convergence of the groups posterior distribution in latent or stochastic block models. Bernoulli, 21(1):537–573.
- Mariadassou et al., (2010) Mariadassou, M., Robin, S., and Vacher, C. (2010). Uncovering latent structure in valued graphs: A variational approach. The Annals of Applied Statistics, 4(2):715–742.
- Matias and Miele, (2017) Matias, C. and Miele, V. (2017). Statistical clustering of temporal networks through a dynamic stochastic block model. Journal of the Royal Statistical Society: Series B (Statistical Methodology), 79(4):1119–1141.
- Pautasso et al., (2013) Pautasso, M., Aistara, G., Barnaud, A., Caillon, S., Clouvel, P., Coomes, O. T., Delêtre, M., Demeulenaere, E., De Santis, P., Döring, T., et al. (2013). Seed exchange networks for agrobiodiversity conservation. a review. Agronomy for sustainable development, 33(1):151–175.
- Pavlopoulos et al., (2018) Pavlopoulos, G. A., Kontou, P. I., Pavlopoulou, A., Bouyioukos, C., Markou, E., and Bagos, P. G. (2018). Bipartite graphs in systems biology and medicine: a survey of methods and applications. GigaScience, 7(4). giy014.
- Pilosof et al., (2017) Pilosof, S., Porter, M. A., Pascual, M., and Kéfi, S. (2017). The multilayer nature of ecological networks. Nature Ecology & Evolution, 1(4):0101.
- Pocock et al., (2012) Pocock, M. J., Evans, D. M., and Memmott, J. (2012). The robustness and restoration of a network of ecological networks. Science, 335(6071):973–977.
- Snijders and Nowicki, (1997) Snijders, T. A. B. and Nowicki, K. (1997). Estimation and prediction for stochastic blockmodels for graphs with latent block structure. J. Classification, 14(1):75–100.
- Thomas and Caillon, (2016) Thomas, M. and Caillon, S. (2016). Effects of farmer social status and plant biocultural value on seed circulation networks in Vanuatu. Ecology and Society, 21(2).
- Thomas et al., (2015) Thomas, M., Verzelen, N., Barbillon, P., Coomes, O. T., Caillon, S., McKey, D., Elias, M., Garine, E., Raimond, C., Dounias, E., et al. (2015). A network-based method to detect patterns of local crop biodiversity: validation at the species and infra-species levels. In Advances in Ecological Research, volume 53, pages 259–320. Elsevier.
- Xin et al., (2017) Xin, L., Zhu, M., Chipman, H., et al. (2017). A continuous-time stochastic block model for basketball networks. The Annals of Applied Statistics, 11(2):553–597.
- Xu and Hero, (2014) Xu, K. S. and Hero, A. O. (2014). Dynamic stochastic blockmodels for time-evolving social networks. IEEE Journal of Selected Topics in Signal Processing, 8(4):552–562.
- Yang and Leskovec, (2012) Yang, J. and Leskovec, J. (2012). Community-affiliation graph model for overlapping network community detection. In Data Mining (ICDM), 2012 IEEE 12th International Conference on, pages 1170–1175. IEEE.
- Zhu et al., (2014) Zhu, Y., Yan, X., and Moore, C. (2014). Oriented and degree-generated block models: generating and inferring communities with inhomogeneous degree distributions. Journal of Complex Networks, 2(1):1–18.