COMPONENT SEPARATION FOR FUTURE CMB B-MODE SATELLITES
Abstract
Next-generation CMB satellite concepts (LiteBIRD, CORE, PIXIE, PICO) are being proposed to detect the primordial CMB B-mode polarization at large angular scales in the sky for tensor-to-scalar ratio values of . Yet undetected, primordial CMB B-modes will provide the unique signature of the primordial gravitational waves of quantum origin predicted by inflation. We present recent forecasts on the detection of the primordial CMB B-modes in the presence of astrophysical foregrounds and gravitational lensing effects, in the context of the proposed CMB space mission CORE. We also discuss the problem of foregrounds and component separation for the search for primordial B-modes, and highlight specific challenges in this context: frequency range, spectral degeneracies, foreground modelling, spectral averaging effects.
1 Introduction
The search for the primordial B-mode polarization of the cosmic microwave background (CMB) radiation at large angular scales in the sky is one of the most exciting challenge of modern cosmology, because such a signal would be the direct signature of the primordial gravitational waves predicted by inflation [1]. The amplitude of the primordial B-mode signal, termed as tensor-to-scalar ratio, , will determine the energy scale of inflation, GeV. CMB satellite concepts (LiteBIRD [2], CORE [3], PIXIE [4], PICO [5]) are being proposed to detect large-scale CMB B-modes at . This is a real challenge because the signal is extremely faint ( nK r.m.s. fluctuations in the sky) and obscured by very bright polarized Galactic foreground emissions by many orders of magnitude. In addition, gravitational lensing effects by large-scale structures transform CMB E-modes into noise-like B-modes, while spurious B-modes are created by instrumental systematic effects. In this context, component separation methods are critical to subtract the foregrounds and extract the CMB B-mode signal, since the residual foreground contamination will set the ultimate uncertainty limit with which can be measured.
In this article, we report on recent B-mode detection forecasts with the CMB satellite concept CORE [6], and briefly discuss about the problem of foregrounds and component separation for B-modes, by highlighting subtle issues that arise in this context.
2 B-mode component separation forecasts for CORE
The proposed space mission CORE [3] is designed to observe the full sky with high sensitivity through 19 frequency bands, ranging from to GHz. We report on the results [6] of component separation and primordial CMB B-mode reconstruction, based on CORE sky simulations.
2.1 Sky simulations
Using the PSM (Planck Sky Model) software [7], we have simulated full-sky polarization maps for the frequency bands ( to GHz) of CORE. Our simulated sky maps [6] include: CMB E- and B-mode polarization, with an optical depth to reionization and a tensor-to-scalar ratio ranging from to ; lensing E- and B-modes; Galactic and extra-galactic foreground polarization. Galactic foregrounds consist of thermal dust emission, based on the Planck GNILC dust template [8] at GHz, with average polarization fraction of -% over the sky; polarized Galactic synchrotron emission, as observed by WMAP at GHz [9]; and Galactic anomalous microwave emission (AME) with 1% polarization fraction. Extra-galactic foregrounds include compact radio and infrared sources with respectively %-% and % mean polarization fractions. The dust map is interpolated across the CORE frequency bands through a modified blackbody (MBB) emission law having variable spectral index and temperature over the sky, with mean values and K, as measured by Planck [8]. The synchrotron map is extrapolated across frequencies through a power-law with an average spectral index of varying over the sky [9]. The emission law for extrapolating the AME component is modelled by assuming a Cold Neutral Medium [10]. Compact source templates are extrapolated across CORE frequencies by assuming random steep or flat power-laws for radio sources, and both modified blackbodies and power-laws for infrared sources. The component maps at each frequency are coadded, convolved by a Gaussian beam using the CORE FWHM values, and instrumental white noise is added to each frequency map using the sensitivities quoted by CORE [3].
2.2 Component separation methods
We have applied four independent component separation algorithms [6] to the CORE sky simulations to perform foreground removal, reconstruction of the CMB B-mode power spectrum, and estimation of the tensor-to-scalar ratio: Commander [11], a Bayesian parametric method for a multi-component pixel-by-pixel spectral fit using MCMC Gibbs sampling; Smica [11], a blind method for a power-spectra fit in harmonic space; Nilc [11], a blind method for minimum-variance internal linear combination in wavelet space; and xForecast [12], an alternative parametric fitting approach in pixel space. The first three algorithms have already a strong heritage from real Planck data analysis [11]. Parametric methods are only limited by the accuracy with which the foregrounds are modelled in the fit, while blind methods do not rely on any assumptions about the foregrounds but are limited by the overall variance of the foregrounds and the number of frequency channels and multipole modes available to minimize this variance. Since the variance of the foregrounds is much larger at the reionization scales (), parametric fitting was preferred to reconstruct CMB B-modes at low multipoles (reionization peak), while blind methods were used to reconstruct the signal at large multipoles (recombination peak).
2.3 Results
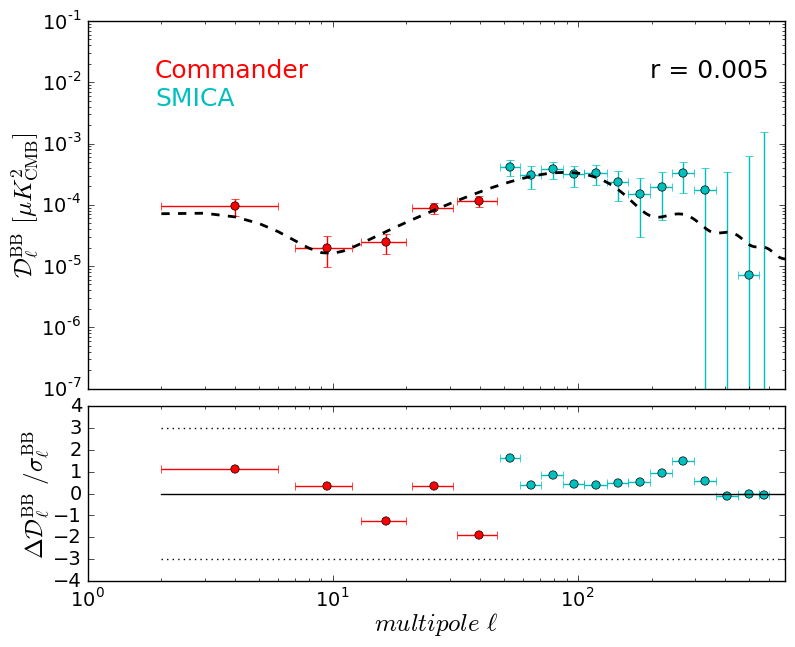
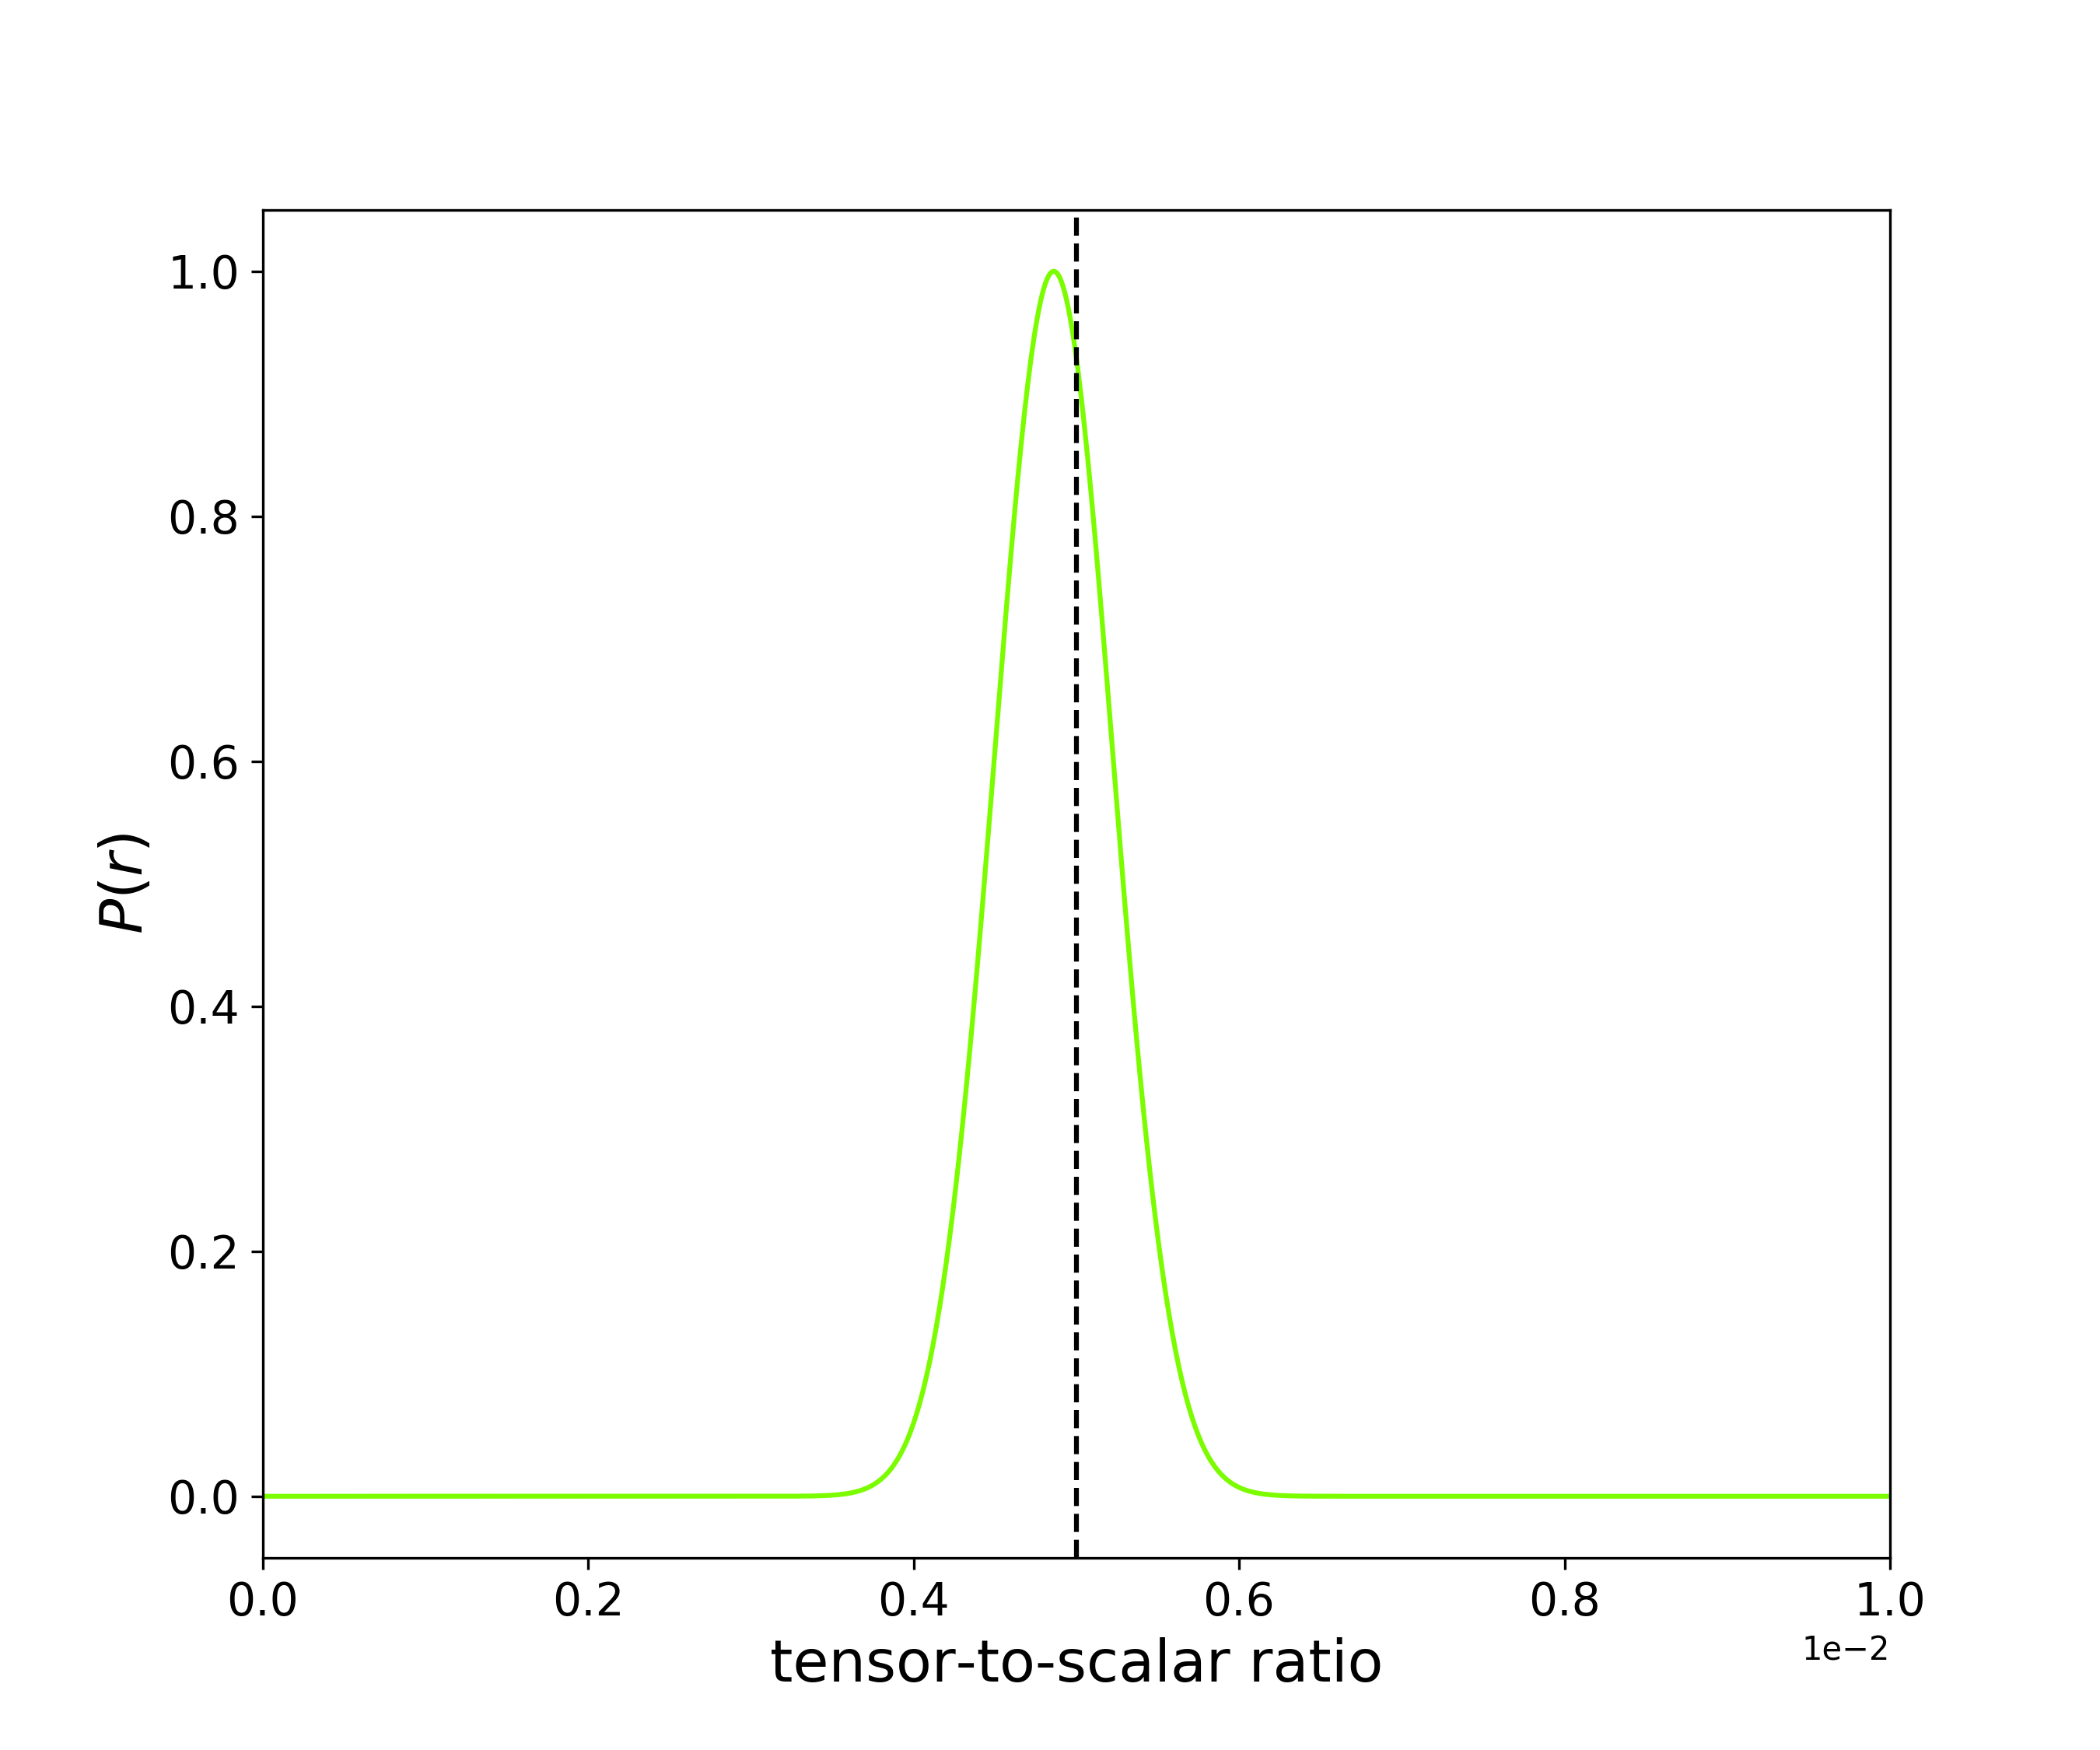
The left panel of Fig. 1 shows the reconstruction of the primordial CMB B-mode after foreground cleaning with Commander and Smica for a fiducial tensor-to-scalar ratio of , in the absence of lensing. The broad frequency range of CORE allows us to recover the primordial B-mode signal at both reionization and recombination peaks, and to measure the posterior distribution of without bias at significance (right panel of Fig. 1) after foreground cleaning. In the presence of lensing contamination, a shortcut was adopted to perform delensing. Instead of correcting for the lensing variance in the foreground-cleaned CMB B-mode map, as real delensing approaches would do, we left % of the lensing B-mode power in the CMB map realization of the simulation, then performed foreground cleaning on the modified simulation. This is equivalent to performing foreground cleaning and % delensing, which is the delensing capability quoted by CORE [13]. In the presence of lensing, is detected at significance after foreground cleaning and % delensing [6], putting CORE in an excellent position to constrain the energy scale of inflation for the Starobinsky’s inflation model [1].
For a tensor-to-scalar ratio as low as , the residual foreground contamination in the CMB B-mode power spectrum after component separation is significant at all angular scales for all the methods [6], resulting in a bias on the measurement of by CORE. The bias is attributed to the available frequency range - GHz of CORE, for which the minimized variance of the foregrounds achieved by blind methods (Nilc and Smica) still exceeds in power while being lower than . For parametric methods (Commander), the absence of frequencies below GHz prevent the synchrotron spectral index, , to be constrained at the level of precision required for : while the recovered distribution of over the sky has same mean and standard deviation than the actual distribution, it is more Gaussian-distributed, which results in a % mismatch on . This error on is large enough to cause an excess B-mode power at a level of when extrapolating synchrotron B-modes to CMB frequencies [6]. Subpercent precision on foreground spectral indices is thus required to measure without bias, which can be achieved with broader frequency ranges (Sect. 3).
3 Concluding remarks: subtle issues for B-mode component separation
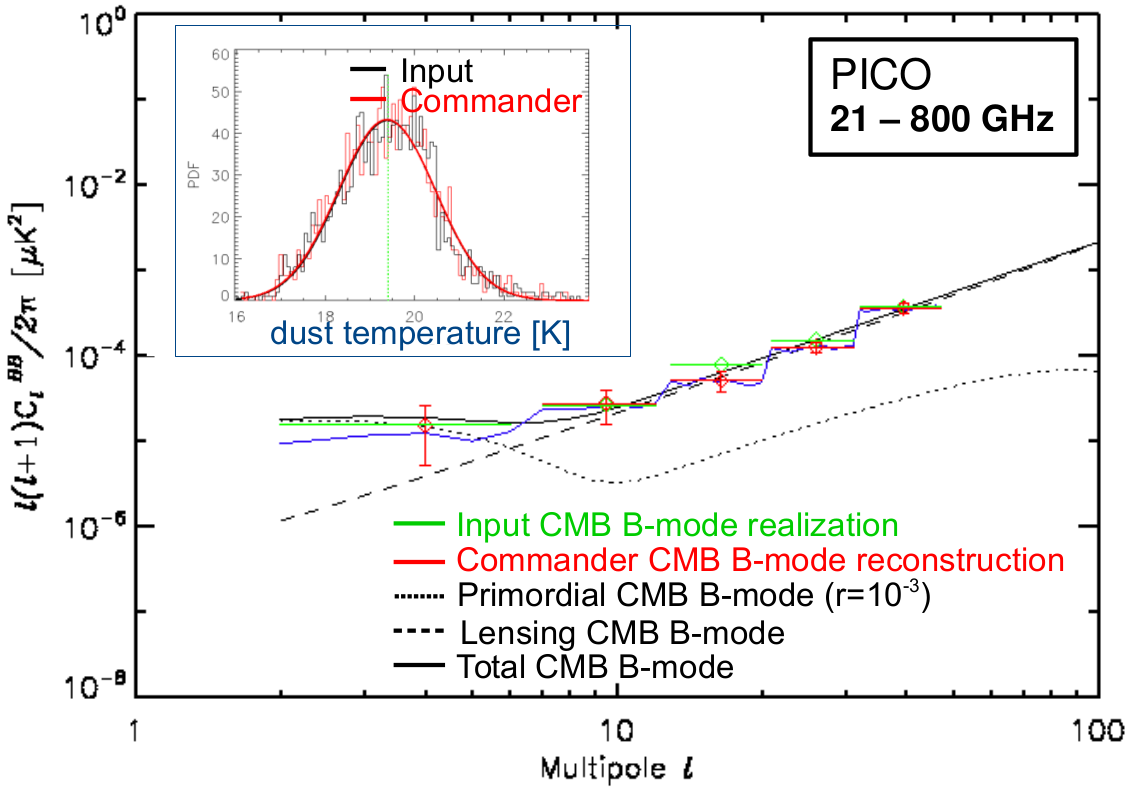
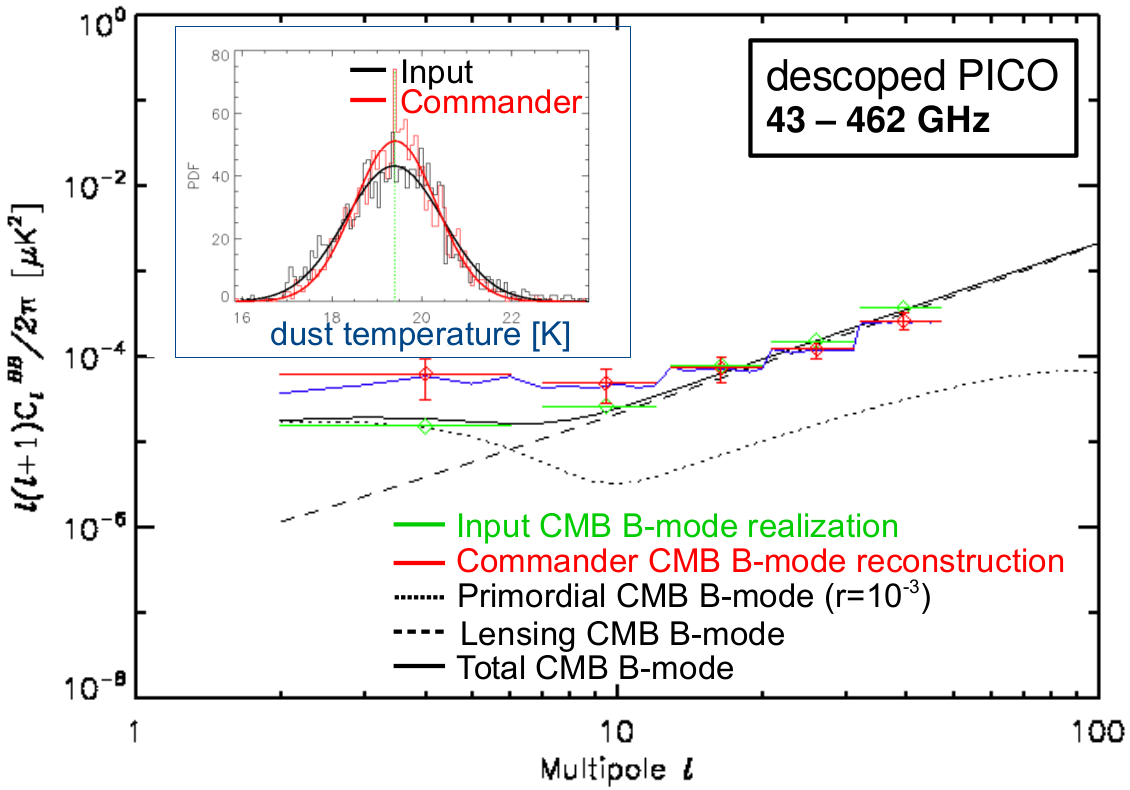
On the importance of a broad frequency range. The CMB satellite concept PICO [5] benefits from a broader frequency range (- GHz) than CORE. The reconstruction of the CMB B-mode power spectrum at with PICO is shown in the left panel of Fig. 2, for the same sky simulation. Due to a larger frequency range of - GHz, PICO allows Commander to control the foreground contamination at the desired accuracy to measure with significance, without any bias, from low multipoles . Conversely, narrowing the baseline frequency range of PICO to - GHz (right panel of Fig. 2) introduces a bias at large angular scales on the recovered B-mode power spectrum because of residual dust contamination. In the absence of high frequencies GHz, the dust MBB temperature is constrained with lower accuracy (left-corner stamp in the right panel of Fig. 2), which results in spectral degeneracies in the fit and translates into a bias on the reconstructed CMB B-mode at .
Foreground mismodelling. Due to the very large dynamic range between foregrounds and CMB B-mode fluctuations, component separation for polarization is much more sensitive to foreground modelling uncertainties than for temperature. Mismodelling two MBB dust components as a single MBB dust component in the Commander fit was shown to bias by more than for any CMB satellite concept [14]. Most important, CMB experiments with narrower frequency ranges show no chi-square evidence for incorrect dust modelling [14], the fit of the overall sky emission being still accurate in narrow frequency ranges while it suffers from spectral degeneracies. Frequencies below GHz and above GHz are thus critical for CMB B-mode experiments to get chi-square evidence for incorrect foreground modelling and false detections of . It could be argued that increasing the frequency range of observations will introduce additional foregrounds. However, Galactic foregrounds are not fully decorrelated across frequencies, so that the increase in foreground complexity (extra degrees of freedom) should be more than compensated by the increase of information (extra frequencies) for component separation.
Spectral averaging effects. Foreground spectral indices vary in the sky from line-of-sight to line-of-sight, but sky map observations are pixelized and do not have infinite resolution, so that different spectral indices are averaged within pixels or beams [15]. The averaging of power-laws with different spectral indices in a pixel is no longer a power-law, instead it introduces spurious curvatures in the effective emission law across frequencies [6]. Say otherwise, the effective emission laws of the foregrounds on the pixelized maps may differ from the real emission laws in the sky. Averaging effects are critical for parametric fitting methods in the context of B-modes. Ignoring in the parametric fit a spurious dust curvature of caused by averaging effects results in a bias of on the tensor-to-scalar ratio [6]. To tackle this issue, moment-expansion approaches [15], rather than astrophysical model fitting, might provide an interesting avenue.
Acknowledgments
The author acknowledges funding from the ERC Consolidator Grant CMBSPEC (No. 725456).
References
References
- [1] Starobinsky A. A., Sov. Astron. Lett. 9, 302 (1983)
- [2] Matsumura T. et al, Journal of Low Temperature Physics 184, 824 (2016)
- [3] Delabrouille J. et al, JCAP 4, 014 (2018)
- [4] Kogut A. et al, JCAP 7, 025 (2011)
- [5] https://zzz.physics.umn.edu/ipsig/_media/aasoral2018_v6.pdf
- [6] Remazeilles M. et al, JCAP 4, 023 (2018)
- [7] Delabrouille J. et al, A&A 553, A96 (2013)
- [8] Planck Collaboration et al, A&A 596, A109 (2016)
- [9] Miville-Deschênes et al, A&A 490, 1093 (2008)
- [10] Ali-Haïmoud et al, MNRAS 395, 1055 (2009)
- [11] Planck Collaboration et al, A&A 594, A10 (2016)
- [12] Stompor R. et al, Phys. Rev. D 94, 083526 (2016)
- [13] Challinor A. et al, JCAP 4, 018 (2018)
- [14] Remazeilles M. et al, MNRAS 458, 2032 (2016)
- [15] Chluba J. et al, MNRAS 472, 1195 (2017)