Status of the JENSA gas-jet target for experiments with rare isotope beams
Abstract
The JENSA gas-jet target was designed for experiments with radioactive beams provided by the rare isotope re-accelerator ReA3 at the National Superconducting Cyclotron Laboratory. The gas jet will be the main target for the Separator for Capture Reactions SECAR at the Facility for Rare Isotope Beams on the campus of Michigan State University, USA. In this work, we describe the advantages of a gas-jet target, detail the current recirculating gas system, and report recent measurements of helium jet thicknesses of up to about atoms/cm2. Finally a comparison with other supersonic gas-jet targets is presented.
keywords:
FRIB, hydrogen and helium gas-jet target, experimental nuclear astrophysics, radioactive ion / rare isotope beams, ReA3, SECAR1 Introduction
The Jet Experiments in Nuclear Structure and Astrophysics (JENSA) windowless gas-jet target has been installed at the rare isotope beam facility ReA3 [1] at NSCL (National Superconducting Cyclotron Laboratory, East Lansing, Michigan, United States) on the campus of Michigan State University (MSU). JENSA enables direct measurements of various hydrogen- and helium-induced astrophysical reactions in inverse kinematics with radioactive, low-energy beams provided by NSCL and, later, with beams available at the Facility of Rare Isotope Beams (FRIB) [2, 3, 4]. The ReA3 facility can provide ion beam energies between 0.3 and 6.0 MeV/u.
In a stand-alone operational mode, the JENSA gas-jet target at ReA3 can be surrounded with silicon detector arrays in order to measure the lighter reaction products from e. g. (, p) reactions that play a critical role in the p-process in X-ray bursts [5]. Simultaneous measurements of (, ) reactions give the opportunity to test and to improve -optical models potentials for exotic nuclei, which are presently poorly constrained [6]. With the JENSA gas-jet target, (d, p) neutron-transfer reactions in inverse kinematics can be used to extract information about (n, ) capture reactions and, in some cases by taking advantage of mirror symmetry, (p, ) cross sections on unstable nuclei of interest for astrophysics. This method is described e. g. in [7]. Simultaneously measuring (d, d) reactions can further constrain the derived capture cross sections. Proton capture reaction resonance properties of importance for the rp-process in classical Novae [8, 9] or X-ray bursts [10, 11, 5] can also be determined with JENSA using proton scattering, or (3He, d) proton-transfer reactions.
JENSA will serve as the gas target for the recoil separator SECAR [12] currently under construction at MSU. In combination with SECAR and additional -ray detectors, JENSA will enable direct measurements of (p, ) and (, ) reactions of astrophysical interest in the rp-process in Novae and X-ray bursts, in the synthesis of long lived radioactive isotopes in explosive Si burning in supernovae [13, 14, 15], in the p-process in supernova neutrino driven winds [16], and in other astrophysical sites.
The JENSA gas-jet target has been optimized to take advantage of low-intensity radioactive beams. The high gas compression of more than 2.5 MPa provides an unprecedentedly high number density of atoms/cm2. Unlike plastic thin-foil targets or gas targets with windows, the gas-jet target is chemically pure, reducing beam-induced background as well as energy straggling and angular scattering. The excellent reaction localization within a few millimeters enables precise measurements of angular distributions and a good mass separation of recoils from scattered beam when combining JENSA with the SECAR recoil separator. Recirculation of the target gas in JENSA enables the use of expensive gases such as 3He. The design of the JENSA system minimizes the amount of gas needed to about 160 liters at standard temperature and pressure.
A previous instrumentation paper of JENSA [17] describes the initial configuration at Oak Ridge National Laboratory (ORNL); here we discuss the implementation at NSCL. The subsequent section describes changes, upgrades, and new features of the JENSA system at NSCL. Then we describe in detail the current configuration of the recirculating gas system at NSCL and present results from nozzle optimization experiments and precise measurements of the target thickness. Finally, we compare JENSA with other supersonic gas-jet targets.
| Compressor discharge pressure | (psig) | |||||||
|---|---|---|---|---|---|---|---|---|
| (MPa) | ||||||||
| 4He flow in front of the nozzle | (dm3/s) | |||||||
| Ambient pressure around the jet | (Pa) |
2 New features of the JENSA system at NSCL
The JENSA recirculating gas system at NSCL features an improved pumping scheme (section 3), where e. g. the EBARA A10S multi-stage dry vacuum pumps at the final pumping stage before the compressor inlet were replaced with three Leybold DRYVAC DV 650 dry compressing screw vacuum pumps to provide more reliable operation and remove the need for some gas to be bled into the EBARA labyrinth seal. In combination with the pumps, a new water cooler was installed, reducing the gas temperature before the last compression stage. Additionally, a new collar (Figure 1)
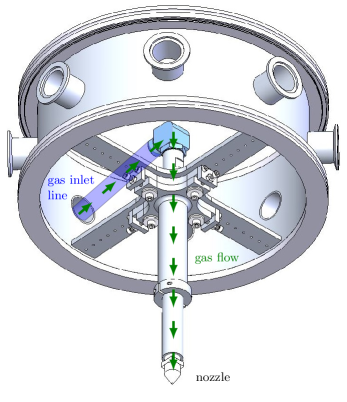
was installed on top of the vacuum chamber that supports a new nozzle mount equipped with multiple set screws for a precise alignment of the nozzle in all three dimensions to within 0.1 mm.
In contrast to the original setup at ORNL, the compressor is now located close to the target chamber surrounded by other experimental stations and work places posing particular challenges for the reduction of noise and vibrations. The compressor is installed on top of a concrete base that is elevated by one meter to give additional space for pumps underneath and hence a more compact setup with a minimum total inner volume. To dampen vibrations, the platform is mounted with springs to a support structure of steel. The compressor and its base are enclosed with pads of noise isolating material, reducing the sound pressure level directly next to the compressor from approximately 83.1 to 72.8 dB(A), corresponding to a reduction of the audible noise level by about a factor of two.
Another upgrade is the implementation of a new beam viewer (Figure 2)
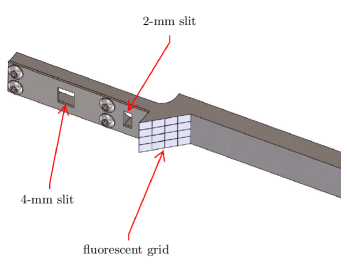
at the target location. This addresses the long standing problem of ensuring complete beam overlap when using gas jet targets [18, p. 725]. The viewer can be inserted exactly at the position of the jet, enabling beam tuning to match the jet properties. At instantaneous beam rates of more than 1000 particles per second the beam can be visualized on a fluorescent plate coated with red CRT phosphor Y2O2S:Eu from Nichia (Tokushima, Japan). This plate is mm wide, 8 mm high and mounted at an angle of 45∘ with respect to the beam axis. The horizontal lines of its carved grid have spaces of 2 mm, the vertical lines are mm apart, so that the projection of the plate perpendicular to the beam axis is a 44 grid of 2 mm 2 mm cells. For intensities lower than 1000 particles per second, the maximum transition through the center of the gas jet can be verified by transmission studies with and without two 2- and 4-mm wide slits in conjunction with a downstream ionization chamber or other detectors. The viewer is attached to a stepper motor drive outside the chamber with a 50-mm stroke. Tests during alignment demonstrated that the viewer position is reproducible to less than a tenth of a millimeter.
3 The recirculating gas system at NSCL
A maximum helium gas pressure of about 3 MPa is provided by a PDC-4-100-500(150) two-stage industrial grade diaphragm compressor (Figure 3).
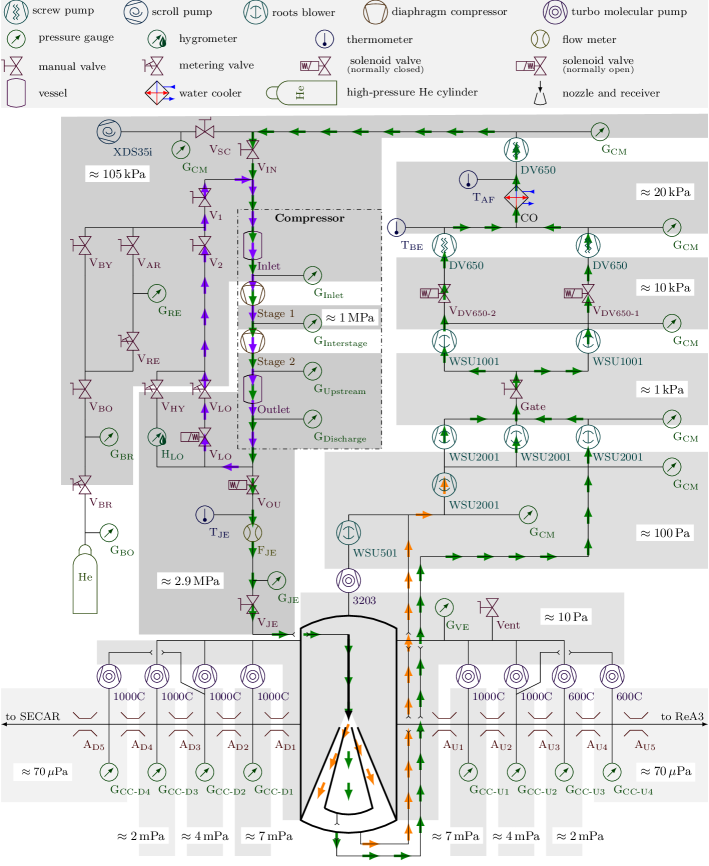
A high pressure storage vessel at the compressor outlet realizes a constant outlet pressure by dampening pressure fluctuations due to the moving diaphragms (see [17] for further details). For example, when the compressor gauge G (Figure 3) measured a fluctuating pressure between about 2.8 and 3.0 MPa, gauge G showed a constant pressure of 2.9 MPa. To reduce the gas flow through the target, part of the gas can run through a loop back to the compressor inlet (violet arrows in Figure 3). This is regulated by the needle valve V and enables the discharge pressure to be adjusted between 0.79 and 2.86 MPa. In the loop, the gas can further flow through the probe of a hygrometer H to measure the humidity of the gas. This device monitors the gas composition to determine if there are any air leaks into the gas system. In addition, the loop is connected to a high pressure gas cylinder that supplies the JENSA system with gas during the startup.
Temperature, flow (Table 1), and pressure of the compressed gas are measured (T, F and G, respectively) directly before the compressed gas enters the target chamber. A feed through guides the high pressure pipe into the vacuum chamber, where a flexible Swagelok pipe connects to the nozzle holder mounted at the collar shown in Figure 1. Several nozzles with different designs are available to be mounted and described in detail in section 4. Eventually, the gas is further compressed by the shape of the nozzle and passes through the vacuum chamber as a supersonic jet.
Residual gas drifting through the vacuum chamber into the beam line is evacuated by two sets of differential pumping stages with water-cooled turbo molecular pumps. The set upstream of the vacuum chamber consists of two TURBOVAC 1000 C and two TURBOVAC 600 C pumps with a maximum pumping speed for helium of 1.0 and 0.6 m3/s, respectively. The downstream set consists of four TURBOVAC 1000 C pumps to provide sufficient pumping for the vacuum requirements for the SECAR recoil separator [12]. The pumps reduce the pressure along the beam lines down to the Pa range and pump the gas back into the main vacuum chamber. That gas, together with residual gas from the jet drifting into the vacuum chamber, is pumped by a Shimadzu TMP-3203LMC magnetically levitated turbo molecular pump that has a maximum pumping speed of 3 m3/s for helium and that is backed by a RUVAC WSU501 roots pump with a speed of 140 dm3/s. This keeps the pressure in the main vacuum chamber well below 10 Pa.
The gas jet is caught by a two-tier receiver system with an outer and inner cone-shaped catcher with increasing diameters. The outer part of the jet (less than 10% of the total gas flow) goes into the outer receiver (light yellow arrows in Figure 3) and is pumped by a RUVAC WSU2001 roots pump with a maximum pumping speed of 570 dm3/s. The major part of the jet is pumped through the inner receiver.
Residual gas from the vacuum chamber (pumped by the Shimadzu and the RUVAC WSU501), the gas from the outer jet (pumped by the RUVAC WSU2001), and gas from the inner jet are combined and subsequently pumped by three additional RUVAC WSU2001 roots pumps. At the inlet of those pumps, a pressure of about 100 Pa was measured. Those three RUVAC WSU2001s are in turn backed by two RUVAC WSU1001 roots pumps with a maximum pumping speed of 280 dm3/s each, compressing the gas further to about 1 kPa. The two final pumping stages before the compressor inlet are realized by three DRYVAC DV 650 dry compressing screw vacuum pumps with a maximum pumping speed of 181 dm3/s each. The first two DV650 pumps compress the gas to about 20 kPa, before its temperature is reduced by a water cooler from about 310 K at T to about 285 K at T (Figure 3). The third DV650 pump increases the pressure of the gas to about 105 kPa since the minimum inlet pressure of the compressor has to be slightly higher than 1 atm.
4 Available nozzles
Creating a suitable supersonic gas jet highly depends on the geometry of the nozzle. For the JENSA gas-jet target, six different nozzles labeled A to F are available (Table 2). Their design is based on de Laval [20] shaped nozzles and associated detailed studies [22, 36].
| Nozzle | |||||
|---|---|---|---|---|---|
| A | |||||
| B | |||||
| C | |||||
| D | |||||
| E, F | |||||
| Tol. |
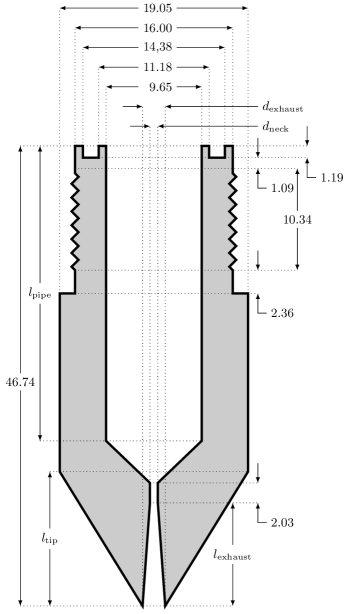
All nozzles in the present work have a cylindrical symmetry (Figure 4); a total length (from the o-ring groove to the end of the exhaust) of 46.74 mm; a maximum outer diameter of 19.05 mm; a maximum inner diameter of 9.65 mm; the groove for o-rings with an inner diameter of 11.18 mm, a width of 3.2 mm and a depth of 1.19 mm; and a 10.34-mm long 3/4-16 thread with a diameter of 16 mm starting after 2.38 mm from the upper end (with the o-ring groove). In order to tighten the nozzle into its holder with tools, a 6.35-mm high block with a square cross section of 19.05 mm was added 2.36 mm below the thread. This is also the outer diameter of the cylindrical shaped body of the nozzle below that block. Outside, all nozzles have a cone-shaped tip at the end with a lateral-surface angle of with respect to the jet axis. Inside, the cylindrically shaped pipe changes into a cone with a lateral-surface angle of , then into a 2.03-mm long neck and finally into another cone shaped exhaust with a total opening angle of . The nozzles differ in the lengths of the cylindrical-shaped pipe, the tip and the exhaust, as well as in the diameter of the neck and of the exhaust opening at the end of the nozzle. All those distances are shown in Figure 4 and listed in Table 2.
5 Jet thickness studies
The thickness of the gas jet for the six available nozzles (see section 4) was measured by the energy loss of 5.5-MeV particles. An activity-standard 241Am source was mounted inside the vacuum chamber facing a Micron style BB15 silicon strip detector [41], with the jet positioned between both, 26 mm from the source and 20 mm from the detector. In front of the 241Am source, a -mm thick aluminum sheet with a centered bore-hole of about mm diameter was mounted as collimator so that the active area was small compared to the jet thickness.
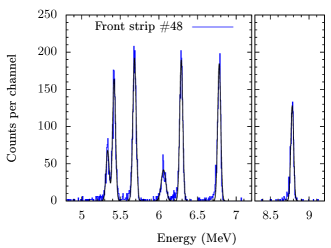
The BB15 is a highly segmented double sided silicon strip detector with 64 vertical strips (each 1172.5 m wide and 40.3 mm high) at the front side and four horizontal strips (each 75.0 mm wide and 10087.5 m high) at the back side. Each of the 64 front strips of the BB15 detector is oriented parallel to the jet axis and energy calibrated with an activity-standard 228Th source facing the BB15 detector. The resulting spectrum is shown in Figure 5.
With this energy calibration, the energy of the 241Am particles with and without the jet (Figure 6)
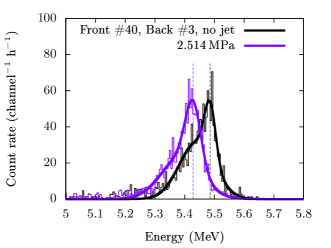
was measured at compressor discharge pressures of 1.136, 1.825 and 2.514 MPa for the six different nozzles listed in Table 2.
Measuring the energy deposited by particles in each front strip in coincidence with each back strip, gives a total of 256 pixels. Hit patterns in the left panels of Figure 7
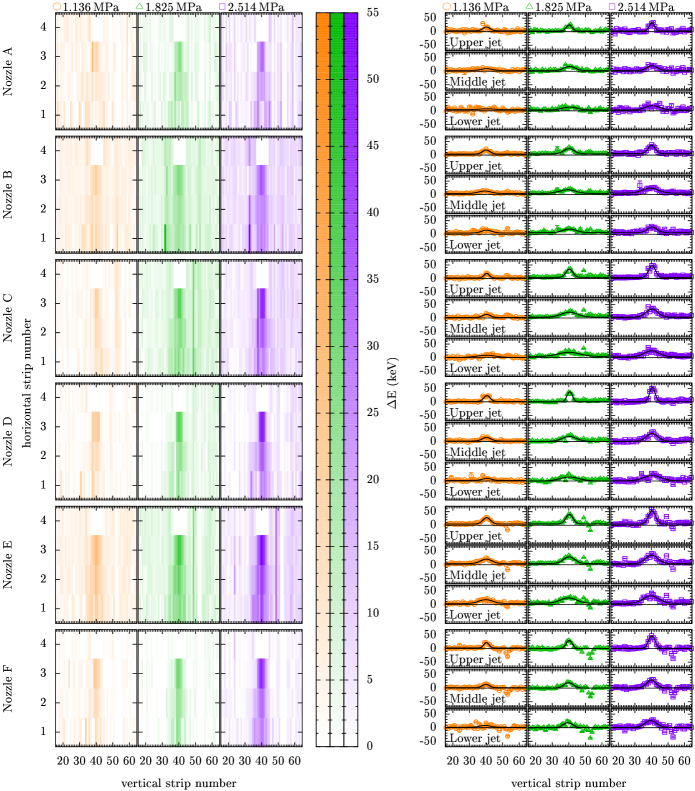
show that the inner pixels of the uppermost horizontal strip are partially shadowed by the nozzle. No signals from particles in the vertical front strips #37 to #44 are detected in coincidence with the horizontal back strip #4. Hence, the energy loss as a function of the front strip number is only given for back strips 1 to 3 and referred to as lower (8 to 12 mm from the nozzle), middle (4 to 8 mm from the nozzle) and upper (within 4 mm below the nozzle) part of the jet in the right panels of Figure 7 and when displaying the fit parameters in Figure 8.
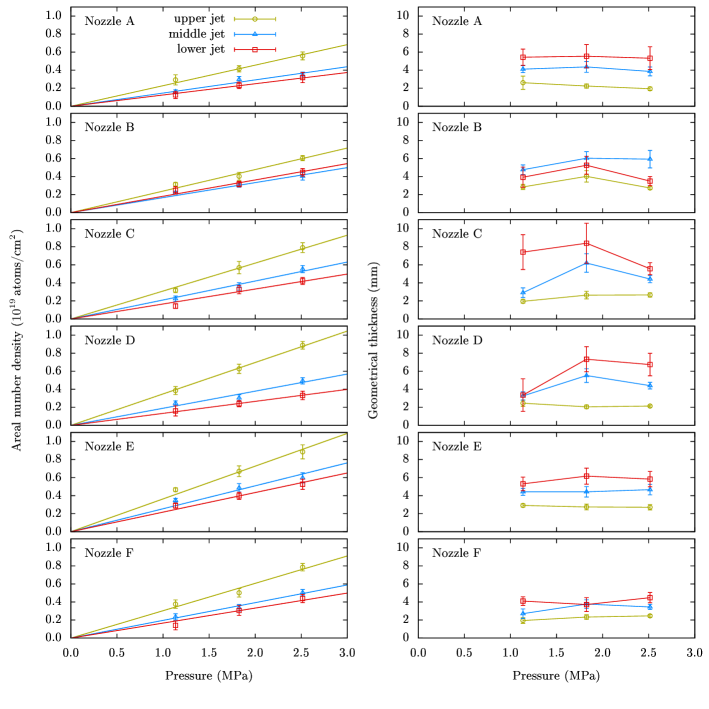
When the supersonic gas jet leaves the nozzle, the gas is expanding into the vacuum chamber. This causes the density to decrease with increasing distance from the nozzle. This is the case for all six nozzles, as shown in Figure 7. The figure also shows that the jet from all six nozzles is causing a higher energy loss and hence getting denser with increasing compressor discharge pressure, caused by the higher gas throughput. This increase can be described by a linear function as shown in the left panels of Figure 8.
In order to determine the geometrical width of each jet, the measurement was calibrated using four small cylinders of different well-known diameters that were placed at the location of the jet. The diameter of a cylinder and the number of shadowed strips are directly proportional. Applying this geometrical calibration to the FWHMs shown in Figure 7 resulted in the geometrical jet widths shown in the right panels of Figure 8. We find that the jet width is less dependent on the pressure in the upper part of the jet near the nozzle.
The maximum areal density of atoms/cm2 was measured in the upper part of the jet with nozzle D at an input pressure of 2.86 MPa. A slightly lower jet thickness was measured in the upper jet with nozzle E. For this nozzle the areal densities in the middle and lower part of the jet were determined to be more than atoms/cm2 higher than for nozzle D. The geometrical width for jets from nozzle E also show much less dependence on the input pressure (Figure 8) and hence, the overall best jet characteristics were achieved with nozzle E. Comparing the parameters in Table 2, we find that the broad neck together with the long exhaust in nozzle E are the best combination to achieve a homogeneous jet with high density.
The geometrical width determined in this work (Table 3) is significantly smaller than previously measured at ORNL. Chipps et al. [17] studied the geometrical thickness of the jet with the same nozzles A and B as listed in Table 2. But the width of the present work stated in Table 3 refers to nozzle D that generated the most dense jet. Nozzle D has a longer exhaust in combination with a broader neck while maintaining the maximum width of the exhaust. In addition, the BB15 detector was aligned closer to the jet resulting in a better spatial resolution.
| Input pressure | 4He jet density | 4He jet FWHM | Distance from nozzle | ||||||
|---|---|---|---|---|---|---|---|---|---|
| Location | Year | (kPa) | ( at./cm2) | (mm) | (mm) | Reference | |||
| Münster | 1982 | ± | 0.06 | ± | 0.2 | 1 to 5 | [23] | ||
| Stuttgart | 1991 | ± | 0.013 | ± | 0.2 | 1.5 | [24] | ||
| Notre Dame | 2012 | ± | 0.021 | ± | 0.2 | 4 | [27] | ||
| Oak Ridge | 2014 | ± | 0.9 | ± | 0.3 | 1 | [17] | ||
| Caserta | 2017 | ± | 0.21 | not reported | 5.5 | [32] | |||
| East Lansing | 2018 | ± | 0.3 | ± | 0.09 | 4 | this work | ||
6 Comparison with other supersonic gas-jet targets in nuclear physics
The first gas-jet target for nuclear physics was operated with compressed hydrogen [19]. Becker and Bier report a maximum particle flux of atoms/(cm2 s) at a full width at one-fifth maximum (FWFM) of 9.2 mm, corresponding to a full width at half maximum (FWHM) of 6.0 mm with a de Laval-shaped nozzle [20] and an input pressure of 10.7 kPa. With a stated average particle velocity of cm/s and the FWHM as geometrical target thickness, their reported flux corresponds to an areal particle density of atoms/cm2.
A gas-jet target operated with nitrogen is reported by Tietsch et al. [21]. Based on electron-beam attenuation, electron-beam fluorescence, and large-angle single-scattering of an electron beam, a homogeneous nitrogen gas jet with a maximum thicknesses of g/cm2, corresponding to atoms/cm2, has been determined. They measured a jet diameter of about 3 mm produced by an axially symmetric de Laval nozzle and an input pressure of 1.3 MPa.
Bittner et al. [22] investigated supersonic jets operated with argon, nitrogen and hydrogen. They report maximum densities for inhomogeneous jets with widths increasing from about 1 to 10 mm due to their cylindrical and conical shaped nozzles. Thus, with the disadvantage of low density uniformity of the jet, they reached record densities of mg/cm2 corresponding to atoms/cm2 for Ar at an input pressure of 2.0 MPa, mg/cm2 corresponding to atoms /cm2 for N at 5.0 MPa and g/cm2 corresponding to atoms/cm2 for H at 2.0 MPa.
The first helium jet for nuclear physics was developed by Becker et al. [23] for -ray spectroscopy measurements. Their recirculating gas target system provided a 2.5-mm wide 4He jet at an input pressure of 200 kPa with a thickness of atoms/cm2 as determined by proton elastic scattering; excitation functions of narrow resonances in 14N(p, ), 18O(p, ), 20,21,22Ne(p, ), 15N(, ), and 20Ne(, ); and the energy shift of a narrow resonance in 13C(, n). The target thickness stated in Table 3 results from the average of those three methods.
Another helium-jet target produced by RHINOCEROS through a de Laval nozzle is reported by Griegel et al. [24]. They do not report an experimentally measured target thickness, but based on their calculated volume density of atoms/cm3 and a jet width of mm, their thickness was estimated to be atoms /cm2 at 38 kPa input pressure.
Developed for the St. George Recoil Mass Separator [25, 26], the HIPPO (HIgh Pressure POint-like) gas target [27] was characterized by 20Ne(, ) elastic scattering measurements and energy loss measurements for a 1.68-MeV -beam through the helium jet. At an input pressure of 150 kPa before the de Laval nozzle, a -mm wide helium jet with atoms/cm2 (as weighted arithmetic mean from both methods) was achieved. Ensuing computational fluid dynamics (CFD) simulations [28] were found to be consistent with the scattering experiment.
SUGAR, a supersonic gas-jet target for low energy nuclear reaction studies, features a rectangular nozzle and is described by Favela et al. [29, 30]. Air, argon and nitrogen jets were characterized with Elastic Backscattering Spectrometry (EBS) and resulted in maximum jet thicknesses of atoms/cm2 for argon at an input pressures of 300 kPa and atoms/cm2 for nitrogen at an input pressure of 250 kPa. Values are taken from Figure 3 of reference [29] assuming a typographical mistake in the x-axis label, accidentally stating psi instead of bar [30]. The areal density of the air jet is only given to be around atoms/cm2 while injecting air at atmospheric pressure. Geometrical widths of the jets are not reported for any target gas.
The latest supersonic He-jet target for nuclear physics was developed for the European Recoil mass separator for Nuclear Astrophysics (ERNA) [31]. Rapagnani et al. [32] report a jet thickness of atoms/cm2 at an input pressure of 0.7 MPa before the de Laval nozzle exploiting the energy loss of a 1-mm collimated 12C beam. Jet thicknesses based on CFD simulations agree with experimental data within 38%. The geometrical width of the jet is not quoted.
Not discussed here are gas-jet targets deployed in high energy nuclear physics [33, 34], targets for interaction with high-intensity ultra-short laser pulses [35, 36], or storage rings [37, 38, 39] for nuclear astrophysics [40] where significantly lower areal densities of about 1011 atoms/cm2 are sufficient.
For JENSA at NSCL, a target thickness of atoms/cm2 and a geometrical target width of mm at an input pressure of 2.5 MPa was determined from the energy loss of 5.5-MeV particles from an 241Am activity standard (section 5). This highly dense jet could be achieved with a high inlet pressure and an optimized inner shape of the nozzle (section 4).
7 Discussion and outlook
In order to compare supersonic helium jets, the areal densities given in Table 3 have been normalized to the maximum jet-input pressure of 2.86 MPa assuming a linear proportionality between thickness and pressure (Figure 9).
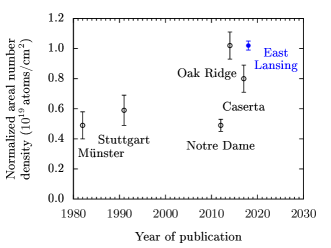
This assumption is supported by the linear functions shown in the left panels of Figure 8. The current JENSA system at NSCL is able to achieve target thicknesses of about atoms/cm2 and is similar to what was achieved previously at ORNL with nozzles A and B [17]. The JENSA gas-jet target at NSCL has the highest helium densities of any gas jet target.
Another important figure of merit is the amount of residual gas (Table 1) that an ion beam is passing through outside the jet compared to the gas inside the target. For JENSA at an input pressure of 2.5 MPa, a beam experiences atoms/cm2 before and atoms/cm2 after the jet, corresponding to a total ratio of outside and inside the jet of less than 1.4%. This ratio can be decreased even further by reducing the gap between the nozzle and the receiver from 12 mm, as it was the case for the jet-thickness studies described in section 5, to 6 mm. This is feasible since, with the help of the new JENSA beam viewer (Figure 2), the diameter of ion beams provided by ReA3 (2-MeV/u 1H; 1.7-MeV/u 34Ar, 39K, and 40Ar beams with full transmission through the 2-mm slit) has been demonstrated to be less than 2 mm. A reduced gap will decrease the amount of residual gas drifting into the vacuum chamber because the geometry of the jet is much better confined immediately after it leaves the nozzle (section 5). Another reduction of the residual gas pressure will come with the installation of a significantly smaller vacuum chamber, which will bring apertures and pumping stages along the beam line closer to the jet. The currently installed large vacuum chamber is utilized to house multiple detector arrays around the target location to measure light reaction particles. The switch to a smaller chamber is necessary for capture reactions with SECAR to enable the installation of -ray detectors as close as possible to the target location.
Further developments of the JENSA system will include the installation of a gas cooler right before the nozzle. A cryogenic liquid will be cycled in a closed loop between the cooler and a refrigeration system provided by a Polycold MaxCool 4000 H Cryochiller that is already installed in the ReA3 high bay near the JENSA vacuum chamber. Gas temperatures are expected to be reduced by 100 K, resulting in a more stable jet with less gas drifting into the surrounding vacuum chamber. In addition, JENSA is currently prepared for hydrogen operation involving the installation of additional gas analyzers, an automatic venting system, and a hydrogen safety system.
8 Conclusions
In summary, the JENSA gas-jet target system is currently installed in the ReA3 high bay at NSCL. An improved configuration of its components includes more powerful pumps and a reduction in the required gas volume for expensive gases to 160 liter. JENSA provides a windowless chemically pure, highly localized gas-jet target with a high-end density of about atoms/cm2. The jet density along the gap between nozzle and receiver has been characterized in detail. Thus, a recently installed nozzle holder enables the precise determination of the vertical location of the jet that is irradiated by the incident beam. A new beam viewer at the target location provides a verification of the position of the beam.
The methods described above will be used in the future to remeasure the jet densities whenever the system configuration is changed noticeably. With a detailed knowledge of the jet characteristics, JENSA in a stand-alone mode will enable measurements of (, p), (d, p) neutron transfer, and (3He, d) proton-transfer reactions in inverse kinematics with radioactive ion beams provided by ReA3. Our precise determination of the jet properties of JENSA will also enable the measurement of (, ) and (p, ) reactions with rare isotope beams provided by FRIB and ReA3 when SECAR starts operation.
9 Acknowledgements
Funding for the Jet Experiments in Nuclear Structure and Astrophysics gas-jet target is provided in part by the National Science Foundation under Grant Number PHY-1430152 (JINA Center for the Evolution of the Elements), Grant Number PHY-1565546 (NSCL) and Grant Number PHY-1419765 (Notre Dame). Funding was also provided by the U.S. Department of Energy (DOE), in part by the Laboratory Directed Research and Development Program of Oak Ridge National Laboratory, managed by UT-Battelle, LLC, for the U.S. DOE; by the Colorado School of Mines grants DE-FG02-10ER41704 (DOE Office of Nuclear Physics) and FG02-93ER40789 (DOE Office of Science); and by the ORNL DOE ARRA grant DE-AC05-00OR22725. The authors thank A. Snyder for his support with the assembly of the compressor’s noise-isolating housing and M. Larmann for his support with the installation of the new collar and nozzle mount.
References
- [1] D. Leitner Nucl. Instr. Meth. Phys. Res. B 317, 235 (2013)
- [2] M. Thoennessen, Nucl. Phys. A 834, 688c (2010)
- [3] A. Gade et al., Nucl. Phys. News 24, 28 (2014)
- [4] A. Gade and B. M. Sherrill, Phys. Scr. 91, 053003 (2016)
- [5] R. Cyburt et al., Astrophys. J. 830, 55 (2016)
- [6] V. Avrigeanu and M. Avrigeanu, Phys. Rev. C 96, 044610 (2017)
- [7] K. L. Jones et al., Nature 465, 454 (2010)
- [8] J. José et al., Astrophys. J. 560, 897 (2001)
- [9] C. Iliadis et al., Astrophys. J. 142, 105 (2002)
- [10] F.-K. Thielemann et al., Prog. Part. Nucl. Phys. 46, 5 (2001)
- [11] A. Parikh et al., Astrophys. J. Suppl. 178, 110 (2008)
- [12] G. P. A. Berg et al., Nucl. Instrum. Meth. Phys. Res. B 376, 165 (2016)
- [13] L.-S. The et al., Astrophys. J. 504, 500 (1998)
- [14] G. Magkotsios et al., Astrophys. J. Suppl. 191, 66 (2010)
- [15] C. Iliadis et al., Astrophys. J. Suppl. 193, 16 (2011)
- [16] C. Fröhlich, J. Phys. G 41, 044003 (2014)
- [17] K. A. Chipps et al., Nucl. Instrum. Meth. Phys. Res. A 763, 553 (2014)
- [18] B. W. Filippone Ann. Rev. Part. Sci. 36, 717 (1986)
- [19] E. W. Becker and K. Bier, Z. Naturforsch. A 9, 975 (1954)
- [20] G. P. de Laval U.S. Patent 522066, (1894)
- [21] W. Tietsch et al., Nucl. Instrum. Meth. 158, 41 (1979)
- [22] G. Bittner et al., Nucl. Instrum. Meth. 161, 1 (1979)
- [23] H. W. Becker et al., Nucl. Instrum. Meth. 198, 277 (1982)
- [24] T. Griegel et al., J. Appl. Phys. 69, 19 (1991)
- [25] M. Couder et al., Nucl. Instrum. Meth. Phys. Res. A 587, 35 (2008)
- [26] Z. Meisel et al., Nucl. Instrum. Meth. Phys. Res. A 850, 48 (2017)
- [27] A. Kontos et al., Nucl. Instrum. Meth. Phys. Res. A 664, 272 (2012)
- [28] Z. Meisel et al., Nucl. Instrum. Meth. Phys. Res. A 828, 8, (2016)
- [29] F. Favela et al., J. Phys. Conf. Ser. 578, 012001 (2015)
- [30] F. Favela et al., Phys. Rev. ST Accel. Beams 18, 123502 (2015)
- [31] D. Rogalla et al., Eur. Phys. J. A 6, 471 (1999)
- [32] D. Rapagnani et al., Nucl. Instrum. Meth. Phys. Res. B 407, 217 (2017)
- [33] D. Shapira et al., Nucl. Instrum. Meth. Phys. Res. A 228, 259 (1985)
- [34] D. Shapira et al., Nucl. Instrum. Meth. Phys. Res. B 10, 436 (1985)
- [35] T. Hosokai et al., Proc. EPAC 8, 981 (2002)
- [36] K. Schmid and L. Veisz et al., Rev. Sci. Instrum. 83, 053304 (2012)
- [37] A. Gruber et al., Nuc. Instrum. Meth. Phys. Res. 282, 87 (1989)
- [38] K. Zapfe et al., Rev. Sci. Instrum. 66, 28 (1995)
- [39] H. T. Schmidt et al., Hyperfine Interact. 108, 339 (1997)
- [40] J. Glorius et al., J. Phys. Conf. Ser. 875, 092015 (2017)
- [41] D. W. Bardayan et al., Nucl. Instrum. Meth. Phys. Res. A 711, 160 (2013)
- [42] K. Levenberg, Quart. App. Math. 2, 164 (1944)
- [43] D. W. Marquardt SIAM J. Appl. Math. 11, 431 (1963)
- [44] C. Hanke and J. Laursen Nucl. Instrum. Meth. 151, 253 (1978)