Precise tracking of vaccine-responding T-cell clones reveals convergent and personalized response in identical twins
Abstract
T-cell receptor (TCR) repertoire data contain information about infections that could be used in disease diagnostics and vaccine development, but extracting that information remains a major challenge. Here we developed a statistical framework to detect TCR clone proliferation and contraction from longitudinal repertoire data. We applied this framework to data from three pairs of identical twins immunized with the yellow fever vaccine. We identified 500-1500 responding TCRs in each donor and validated them using three independent assays. While the responding TCRs were mostly private, albeit with higher overlap between twins, they could be well predicted using a classifier based on sequence similarity. Our method can also be applied to samples obtained post-infection, making it suitable for systematic discovery of new infection-specific TCRs in the clinic.
Introduction
The extremely diverse repertoire of T-cell receptor sequences allows the immune system to develop a specific response to almost any possible pathogen. In recent years huge progress has been made in the deep profiling of T-cell receptor repertoires by high throughput sequencing (HTS), allowing for the identification of millions of TCR sequences in a single experiment Benichou2012 . TCR sequences and phenotypes and the relative abundances of the corresponding T-cell clones encode both the history of previous infections and the protection against yet unseen pathogens. However, despite recent large-scale efforts Dash2017 ; Glanville2017 , it is still impossible to predict systematically which antigen is recognized by a TCR with a given sequence. The most reliable method to identify antigen-specific TCR — MHC-multimer staining Davis2011 — is restricted by the choice of HLA alleles (which are the most polymorphic genes in the human population Robinson2013 ), and by the knowledge of immunodominant peptides. HLA-independent methods for quantitative monitoring of challenge-specific TCRs in vivo are still lacking.
Here we developed a methodology for identifying responding TCR clonotypes from time-dependent repertoire-sequencing data and applied it to yellow fever immunization: a classical model of acute viral infection in humans. The yellow fever vaccine (YFV strain 17D) is one of the most efficient and safe vaccines ever made Monath2015 . Because YFV 17D is a live attenuated virus, vaccination leads to viremia and very intense T-cell and humoral responses Miller2008 . Tracking of activated T-cell subsets such as CD8+CD38+HLA-DR+ Miller2008 and fluorescent MHC-tetramer staining Akondy2009 make it possible to quantitatively describe the kinetics of the T-cell response to primary YFV 17D-immunization. The response peaks around day 14 after immunization, when activated T-cells responding to vaccination occupy 2-13% of the CD8+ subpopulation Miller2008 ; Akondy2009 ; Akondy2015 and 3-4% of the CD4+ subpopulation Blom2013 ; Kohler2012 ; Kongsgaard2017 . Several immunodominant peptides were identified and the corresponding pMHC-multimers have made it possible to track YFV-specific T-cells years and even decades after immunization Akondy2009 ; Kongsgaard2017 ; FuertesMarraco2015 . The only repertoire sequencing study of yellow fever immunization available to our knowledge DeWitt2015 reports thousands of CD8+ T-cell clones expanding after yellow fever immunization, and preferential recruitment of highly expanded CD8+ T-cell clones to the memory subpopulation. However, the clonal structure of the T-cell immune response, how personalized this response is, and what is the impact of genetic factors on the response still remain poorly understood. Studying monozygous twins allows us to quantify the impact of genetic factors using a small cohort of donors Zvyagin2014 ; Rubelt2016 ; Qi2016 .
In this study, we identified nearly five thousand YFV 17D-responding T-cell receptors in three pairs of identical twin donors, using HTS profiling of T-cell repertoires at different timepoints analyzed with advanced statistical modeling. We validated the yellow fever specificity of expanded clones using three independent functional tests. The detailed analysis of the TCR sequences of the expanded clones showed both a highly personalized response and high sequence similarity across individuals, especially between twins. This convergence allowed us to develop a supervised classifier that predicted YFV-reactive TCR sequences with high specificity. Remarkably, the dynamics of clonal contraction in the month after the peak response specifically predicts the YFV-reactive clonotypes. Thus, our methodology can be used during the post-infection period in the clinic to identify TCR clonotypes that recognized and responded to an acute infection of interest, even without prior knowledge of donor MHC-alleles or pathogen epitopes.
Results
Detection of significantly expanded TCR following YFV 17D-vaccination
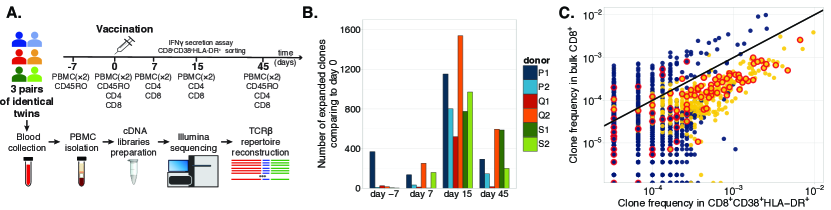
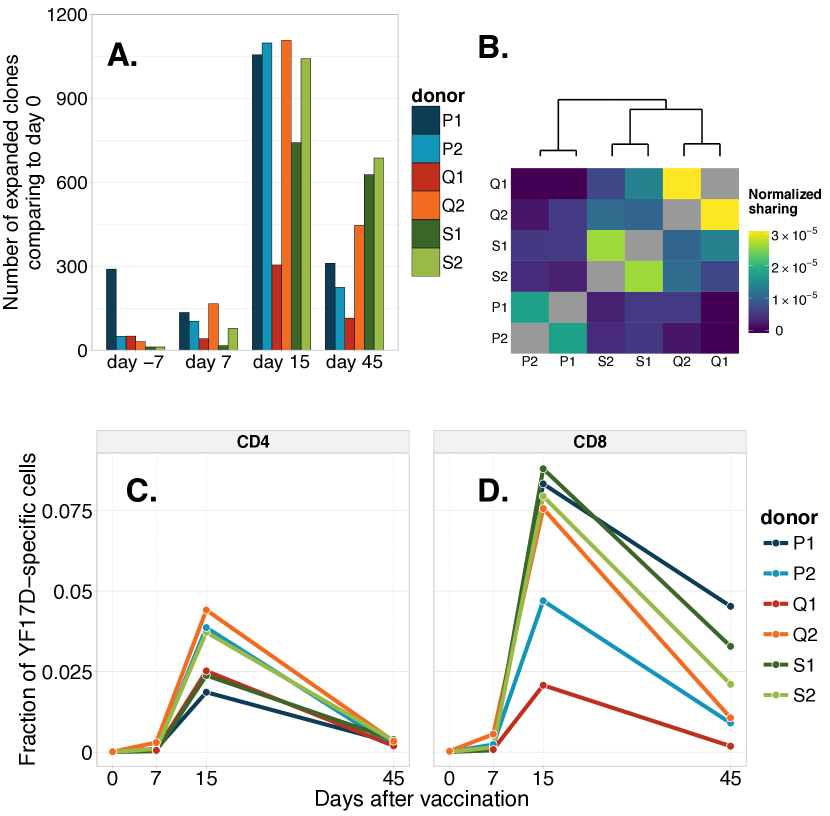
Blood samples were obtained for three pairs of identical twin volunteers aged 20-23. We collected peripheral blood samples on 5 different timepoints (2 before and 3 after immunization) with the live attenuated YFV-17D vaccine (see Fig. 1A). On each timepoint, we collected two biological replicates — two independent tubes of blood — to isolate bulk PBMC, and another tube of blood to isolate CD4+ and CD8+ T-cell subpopulations. Additional portions of blood were used for other subpopulations isolation (CD45RO+) and functional tests on several timepoints (see Methods for details). From each sample, cDNA libraries of TCR chains were prepared as previously described Pogorelyy2017 , and sequenced on the Illumina HiSeq platform.
We developed a Bayesian statistical framework that identifies T-cell clonotypes both significantly () and strongly (fold change ) expanded between different timepoints compared to the expected variability between replicates (see Methods). We reproduced the results with the edgeR package Robinson2009 : a widely used method to analyze differential gene expression in RNAseq experiments (see Methods). In Fig 1B we show the number of clonotypes identified as expanded with respect to day 0. In all donors we observe many more expanded clonotypes between day 0 and day 15 than for any other pair of timepoints, despite variations between donors. In the following we simply call expanded clonotypes TCR sequences that significantly increased in fraction between days 0 and 15. Clonotypes with a significantly higher frequency on the pre-vaccination timepoint relative to the vaccination timepoint (day 0 vs day -7, so actually corresponding to a contraction) were relatively few for all donors except for P1, who we speculate was undergoing another transient immune response.
Most expanded clones were not detected before immunization, and often not even on day 7, due to their low frequency. We report expansion rates of up to 2000-3000 fold in 7 days, although this estimate is only a lower bound due to lack of detection prior to day 15 (see SI Fig. S4).
The majority of expanded TCR are YFV 17D-specific
We hypothesized that most of the expanded clonotypes proliferated specifically in response to the YFV-17D vaccine. To check this hypothesis, three independent functional tests with subsequent TCR repertoire sequencing were performed on donor S1: (i) interferon (IFN) gamma secretion assay; (ii) fluorescent sorting of the activated CD8+CD38+HLA-DR+ subset, which was reported to be largely YFV 17D-specific at the peak of the response Miller2008 ; (iii) staining with a MHC-dextramer loaded with an immunodominant epitope. For (i), whole blood was incubated with the YFV-17D vaccine and IFN-gamma producing cells were isolated using magnetic beads (see Methods). For (i) and (ii), we considered the clonotype validated if it was enriched in the IFN-gamma positive (i) or CD8+CD38+HLA-DR+ (ii) fractions, by comparison to the bulk PBMC or CD8+ populations respectively. Enrichment was determined by a one-sided exact Fisher test (see Methods). We found that out of 774 clonotypes expanded in donor S1 (see Fig 1B.), 331 were enriched in the CD8+CD38+HLA-DR+ fraction (see Fig. 1C), and 64 were enriched in the IFN-gamma secretion assay. For (iii) we used the HLA-A*02 dextramer loaded with the immunodominant YFV epitope NS4b214-222 (LLWNGPMAV) on a sample collected 2 years after immunization. Dextramer-positive cells were isolated and the TCR repertoire was sequenced. We found 68 expanded clonotypes in the A02-NS4b214-222 dextramer positive fraction. We used this data to estimate the fraction of response to the immunodominant epitope A02-NS4b214-222 in this donor. We found that at least 22% of the CD8+ response to YFV vaccination (identified by our statistical model) consisted of NS4b214-222-specific clonotypes on day 15 after immunization. We also sequenced unsorted PBMC for the 2 year timepoint of this donor and found that the fraction of the repertoire occupied by the yellow fever responding clones largely declined 2 years after immunization: from 2.1% (on day 45) to 0.07%, but still exceeded prevaccination levels by nearly two orders of magnitude.
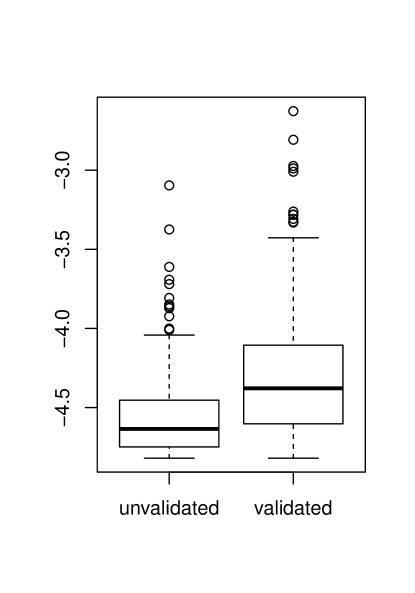
Overall, the total number of clonotypes validated by any of the three methods was 395 out of 774. Notably, the remaining unvalidated clonotypes had significantly lower average frequencies than the validated ones on day 15 (t-test p-value, SI Fig. S5). We performed a randomization control to check the specificity of our validation approach: 774 clonotypes were randomly subsampled from the repertoire on day 15, with the probability of being sampled taken to be proportional to the clonotype frequency. We then tested this random subset for enrichment in the same way we did for the expanded clonotypes. On average, over 1000 such randomizations, we found random clonotypes enriched in the CD8+CD38+HLA-DR+ subset (compared to 331 in the actual expanded clones), clonotypes enriched in the IFN-gamma fraction (vs. 64 among expanded clones) and clonotypes enriched in the A02-NS4b214-222 dextramer positive fraction (vs. 68 among expanded clones). Note that this control gives a conservative estimate of validation specificity, because the expanded clones (true positives) are still likely to be sampled in this randomization due to their high frequency on day 15.
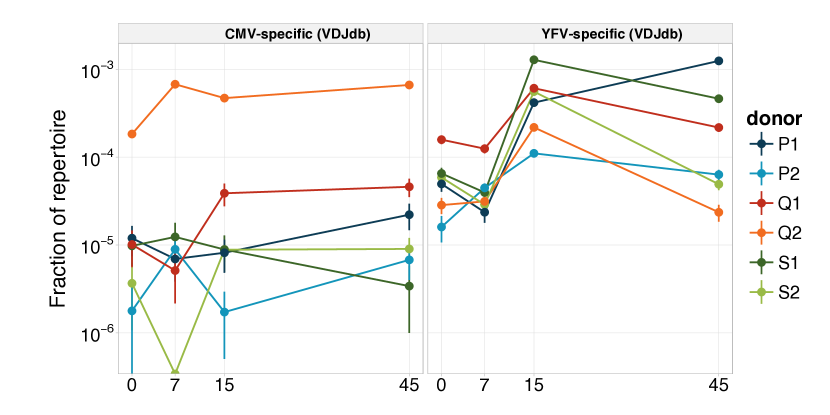
To further validate the expanded clones for YFV-17D specificity, we used previously published TCR sequences from the VDJdb database Shugay2017 (https://vdjdb.cdr3.net, see SI data) that lists sequences specific for the the NS4b214-222 YFV-17D immunodominant epitope. We checked if these published TCR sequences were present in our donors, and whether they were expanded after vaccination. We screened the CD8+ TCR repertoires of our donors at different timepoints for A02-NS4b214-222 specific sequences, as well as for sequences specific for an unrelated epitope as a control: the cytomegalovirus (CMV) immunodominant HLA-A*02-restricted pp65495-503 peptide (NLVPMVATV). All of our donors are HLA-A*02-positive (complete HLA genotypes can be found in SI Table S1). We found that both the number of hits and their cumulative frequency (SI Fig. S1) were significantly higher for published A02-NS4b214-222-specific sequences on day 15 than on day 0 (one-sided t-test p=0.019). By contrast, in the control no significant difference was found (one-sided t-test p=0.27). Then we checked if published A02-NS4b214-222-specific sequences could be found in sets of expanded clonotypes identified in each donor by our model (SI Table S2). We found multiple exact matches for published A02-NS4b214-222-specific sequences and no exact matches for CMV-specific A02-pp65495-503 clonotypes.
In summary, the expanded clonotypes were validated for their YFV specificity, and were also consistent with published YFV-specific TCRs.
The CD8+ T-cell response is sustained longer than the CD4+ response
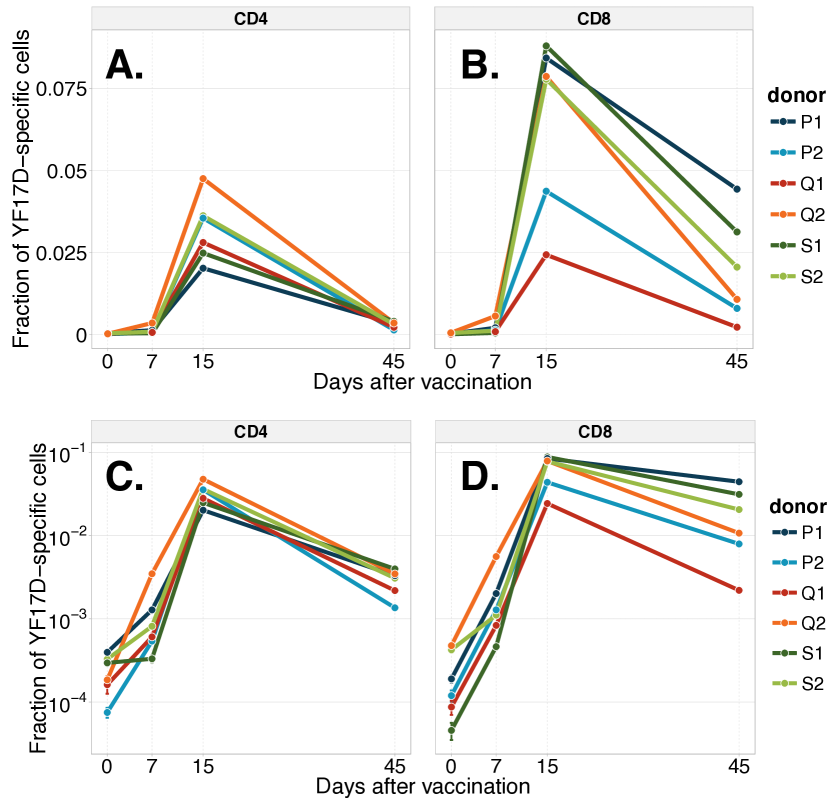
To track the fractions of the CD4+ and CD8+ repertoires involved in the response over time, we calculated the cumulative frequency of expanded clonotypes in the CD4+ and CD8+ compartments at each timepoint. We found similar dynamics in all donors, with both CD8+ and CD4+ responses peaking on day 15. In all donors the CD4+ response fell off more quickly than the CD8+ response from day 15 to day 45, with a mean fold decrease for CD4+, versus for CD8+ (, paired one-sided t-test). We checked the significance of this difference in decay for each donor separately using our statistical framework (see Methods). Briefly, for each clonotype we redrew a random number of counts on days 15 and 45, with the same variability as inferred from replicate experiments to mimic experimental noise. Repeating this process many times gave a p-value corresponding to the fraction of numerical experiments where the ordering between CD4+ and CD8+ decay was opposite to the actual observation. CD4+ and CD8+ fold decreases significantly differed () for 5 donors out of 6, with the exception of donor Q1 () who was an outlier in the CD8+ response strength and the number of significantly expanded clones. The responding clonotypes at the peak of the response occupied up to 8% of the repertoire (cumulative frequency) for CD8+ and up to 5% for CD4+ T-cells. Almost all these clonotypes were undetected before immunization.
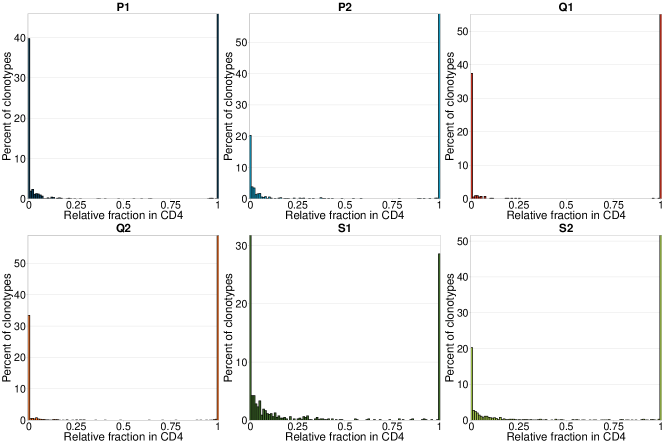
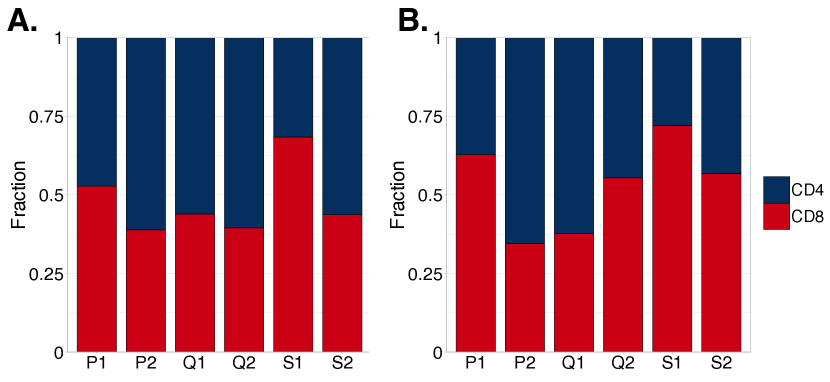
The previous analysis described the dynamics of the CD4+ and CD8+ responses separately. What is the relative importance and diversity of the CD4+ and CD8+ responses within the overall T-cell population? To answer this question, we associated expanded clonotypes from the unsorted PBMC sample to either the CD4+ or CD8+ subsets in the following way: we labeled an expanded TCR clonotype from the unsorted PBMC sample CD4+ if it had a larger concentration in the CD4+ subpopulation sequenced than in the CD8+ subpopulation, and vice versa. This procedure gave unambiguous in silico phenotypes for each expanded clonotype sequence from the PBMC at day 15: the relative abundance of sequences in the CD4+ versus CD8+ compartments was strongly bimodal, with two peaks close to 100% CD4+ and 100% CD8+ (see SI Fig. S2). This analysis revealed that both CD4+ and CD8+ clones strongly expanded in response to the vaccination, with no strong preference for CD4+ or CD8+ expanded clonotypes in terms of the cumulative frequency or diversity (see SI Fig. S3). We next asked if the presence of expanded clonotypes in the memory (CD45RO+) compartment 45 days after immunization depends on their CD4+ or CD8+ phenotype. We detected on average 49% ( %) of CD4+ expanded clonotypes in memory repertoires 45 days after immunization, versus only 21% ( %) of CD8+ expanded clonotypes. This may be explained by different levels of CD45RO+ expression in CD4+ and CD8+ memory T-cells reactive to yellow fever.
TCR response is highly personalized even among twins
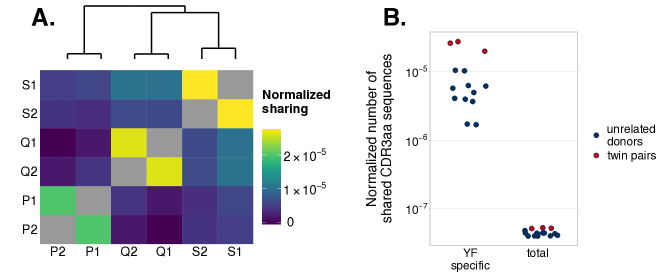
Our method not only reconstructs the dynamics of immune response, but also enables the analysis of TCR sequences of the responding T-cell clones. For each donor we found 500-1500 YFV-17D reactive clonotypes expanded between day 0 and day 15. We compared the pairwise sharing of responding amino acid TCR sequences between different individuals. We found more overlap in twins than in non-related individuals (see Fig. 3A). However absolute numbers of identical expanded TCR clonotypes were low even in twin pairs (up to 20 out of 1503 amino acid sequences), indicating that each individual developed an almost unique response. We also observed that the same nucleotide variants encoded some of the amino acid TCR sequences shared between the twins (see SI Table S4). This identity of nucleotide variants was more frequent in twins than expected from convergent recombination alone (, see Methods).
Overall, shared clonotypes (across at least two donors) accounted for a small fraction of the response in each donor. Only 2.5%-4.4% of unique responding TCR sequences were public (present in more than one donor). These clonotypes correspond to 2.7%-34% of YF-specific cells (see SI Table S3). Despite the low numbers of shared clonotypes, normalized sharing of YFV-17D reactive amino acid clonotype sequences was more than two orders of magnitude higher than in the total repertoire both for twins and unrelated individuals (Fig. 3B). This may result from convergent selection of the same TCR variants recognizing the same epitopes in different donors.
TCR sequence analysis reveals a mixture of convergent and private response
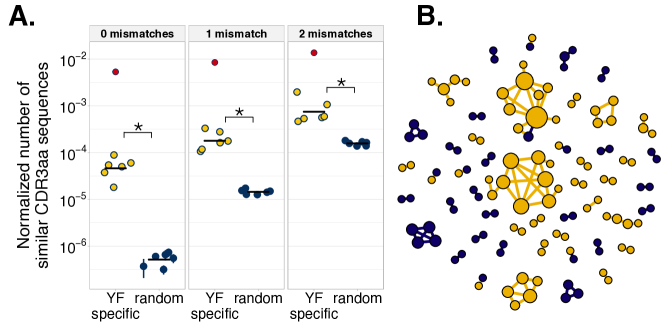
It was previously shown that in many cases TCRs recognizing the same antigens have restricted sequence diversity Dash2017 ; Miles2011 . To analyze the sequence diversity of responding TCRs, we performed a pairwise comparison of all expanded TCR sequences within each donor at the amino-acid level. In each individual, we identified many more pairs of expanded TCRs with the same or highly similar CDR3 amino acid sequences (up to 0, 1, or 2 aa mismatch) on day 15 than in a random subset of equal size (see Fig. 4A). Interestingly, our expanded TCRs were still more diverse than published TCRs selected for their specificity to a single immunodominant YFV epitope NS4b214-222 (red dots, data from VDJdb Shugay2017 , see SI data), suggesting that the response is directed against multiple epitopes in each donor. Consistent with the idea of multiple specificities, the expanded TCRs form multiple dense clusters of highly similar clones (Fig. 4B, yellow circles). By contrast, pre-vaccination abundant TCRs form fewer, sparser, and smaller clusters (blue circles).
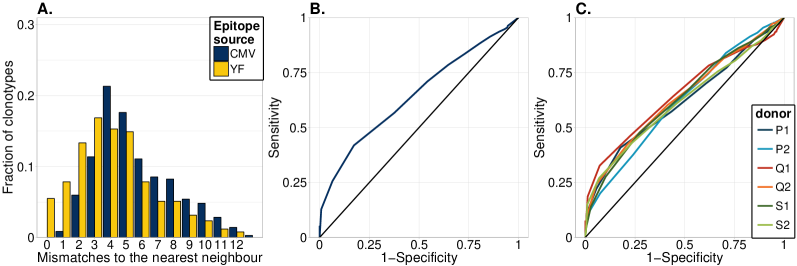
Sequence score based on distance to expanded TCR predicts YFV-17D specificity
The similarity of sequences in the expanded repertoire makes it possible to build a simple classifier to identify novel YFV 17D-specific clonotypes. For each TCR of interest we defined a YFV specificity score as the Hamming distance to the closest amino acid sequence neighbour among the expanded clonotypes from all 6 donors. To test how informative this score is about YF specificity, we first applied it to published TCRs (from VDJdb Shugay2017 , SI data) specific to the NS4b214-222 epitope from YFV-17D and to the pp65495-503 epitope from CMV as a negative control. We found that published YF-specific clonotypes were much closer to our set of expanded clones than CMV-specific clonotypes (Fig. 5A), with some exact matches for YF-specific but none for CMV-specific sequences (SI Table S2). Accordingly, using the score to discriminate YF-specific from CMV-specific published sequences yields good specificity and sensitivity (Fig. 5B).
We then asked if the score could be used to identify reactive clonotypes in the repertoire of an individual after immunization. To test this capability, we used a leave-one-out approach. Information about expanded clonotypes in five individuals was used to build a score as described earlier. The score was then used to predict expanded clonotypes among the 1000 most abundant ones at day 15 in the sixth individual. The score performed with similar accuracy as on published epitope-specific clonotypes (Fig. 5C).
Retrospective detection of YFV 17D-reactive TCRs using post-vaccination data
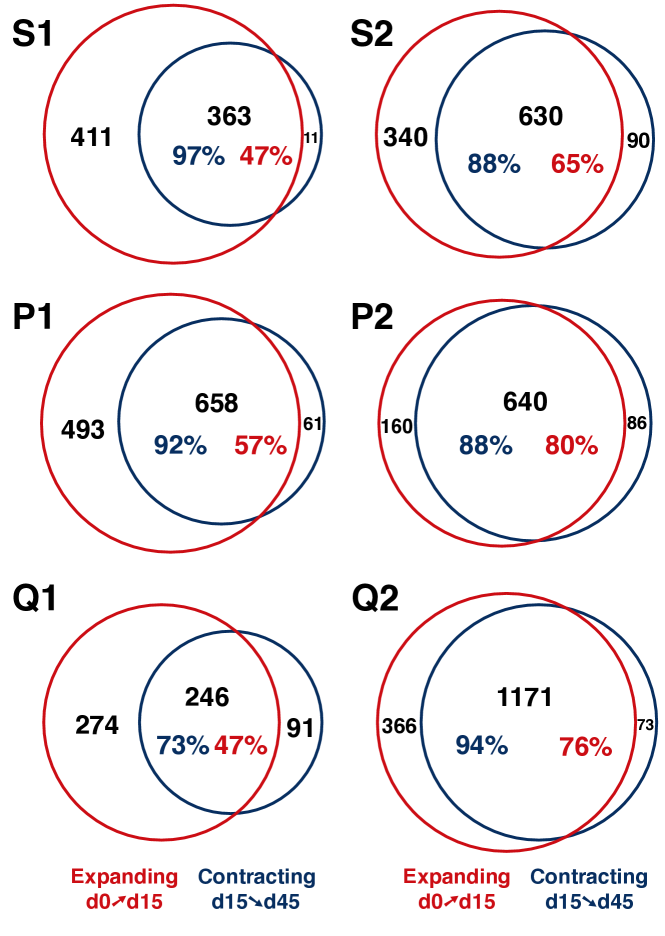
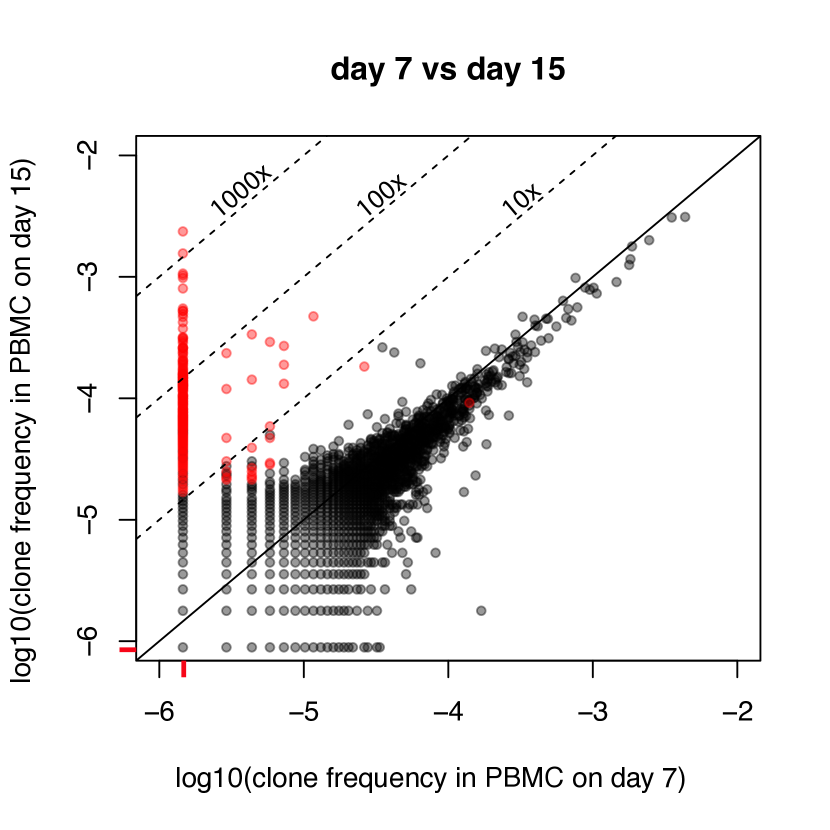
So far we have identified responding TCRs as those that significantly expanded between days 0 and 15. While pre-challenge timepoints are easy to collect in vaccination studies, this is not the case for acute infections, where the first samples can usually be obtained only after the onset of symptoms, when it is too late to detect TCR expansion. However, the clonal contraction dynamics (Fig. 2, day 15 to day 45) can in principle be used to identify responding clonotypes, by comparing a timepoint taken on the peak of the response to a timepoint taken several weeks or months after the infection.
To demonstrate the feasibility of this detection on our data, we identified significantly (, fold change , see Methods) contracted clonotypes between day 15 and day 45 using our model. We computed the overlap between this set of candidate TCR clonotypes with the subset of expanded clonotypes obtained before (Fig. 6). Strikingly, 73% to 97% of the significantly contracted TCRs were also present in the expanded subset, showing that the contraction dynamics can help to identify YFV-reactive clonotypes with high specificity. This method is also sensitive: 47% to 80% of expanded TCRs could be identified by contraction. This shows that contraction dynamics alone is sufficient to identify a large fraction of the responding TCRs. Thus, our method could be used to identify clonotypes responding to infections in the clinic, when pre-infection timepoints are not available.
Discussion
In this study we used high-throughput TCR repertoire profiling to identify major changes occurring in the repertoire after immunization with the live attenuated YFV-17D vaccine. We found several hundreds of unique TCR clones in each donor expanded in response to vaccination. A strong clonal expansion of up to fold occurred between days 7 and 15 following vaccination. This proliferation corresponds to at least 11 divisions in 7 days, with an average of 15 hours per cell cycle. Similar division rates (doubling times of 8-15 and 11-17 hours for CD4+ and CD8+ T-cells respectively) were observed for LCMV infection DeBoer2003 and also in adoptive transfer experiments in mice (18 hours) Buchholz2013 . However, in our case the actual expansion rate could be much higher, because when a clonotype is not found on day 7, its initial concentration is unknown, providing only a lower bound estimate of the fold change. Higher sequencing depth or shorter intervals between timepoints are needed to refine this estimate of expansion rates. This extension would allow us to study the impact of the T-cell clone phenotype and the TCR sequence on the clonal expansion rate. Initial low concentrations of YFV-reactive clonotypes suggest their naive phenotype.
Our longitudinal approach can be applied to identify antigen-specific clonotypes for poorly characterized pathogens with unknown epitopes, which may be useful to study the immune response to emerging viral infections. One could also use this approach to track the response to infection and vaccination of unconventional T-cell subsets for which antigens are still unknown (i.e. T-cells).
While analysing expansion between a pre-vaccination timepoint and the peak of the T-cell response (day 15 in our case) is the the most natural choice, for real-world, non-experimental acute infections, acquiring a pre-infection time point is often impossible or impractical. In this case, we showed how to use the dynamics of clonal contraction to identify reactive clonotypes, by comparing their abundance at the peak of the response to a timepoint taken a few weeks later. Implementing such a protocol in the clinic would lead to an exponential growth of the number of annotated TCR sequences specific to a range of infectious diseases, facilitating diagnostics and vaccine design.
Simultaneous sequencing of bulk PBMC, CD4+ and CD8+ subsets allowed us to determine the phenotype of the responding clones and to describe the kinetics of the response inside each compartment. While Blom et al. Blom2013 found that YFV-specific CD4+ T-cells concentration peaked slightly earlier than CD8+ T-cells, we did not detect any difference in the expansion kinetics with our limited temporal resolution. More timepoints between days 7 and 15 could have been helped to detect such differences. However, we did find differences in the contraction kinetics, with CD4+ cells contracting faster than CD8+ cells. We also found differential recruitment to the CD45RO+ memory compartment, with many more CD4+ than CD8+ TCRs detected in the CD45RO+ fraction on day 45. CD8+ memory formed in response to YFV-immunization was shown to be largely CD45RA+ Akondy2009 ; FuertesMarraco2015 ; Blom2013 , whereas James et al. James2013 found that CD4+ memory cells were mainly CD45RA-. Our results suggest that CD4+ and CD8+ YFV-reactive memory populations also differ in their CD45RO expression.
To the best of our knowledge, our study is the first to describe the reaction of the T-cell repertoire in a model of an acute infection in genetically identical individuals. It was previously shown that the T-cell repertoires of twins have more sequence overlap in abundant clonotypes Zvyagin2014 ; Rubelt2016 . Part of this extensive overlap may be explained by in utero sharing of T-cells Pogorelyy2017 . Authors in Qi2016 also found more overlap in vaccinia virus-specific CD4+ repertoires (isolated by in vitro cultivation with the antigen) in twins. Consistent with these findings, we report more TCR amino acid sequence overlap in the YFV-reactive repertoires of twins than in those of unrelated individuals. Twin YFV-specific TCR clonotypes also show higher nucleotide sequence overlap than those of unrelated individuals, even relative to their higher amino acid sequence overlap (see SI Table S4). To assess the significance of this observation, we used a generative model to ask how likely it is to produce such an amount of shared nucleotide sequences by convergent recombination (see Methods). In the vast majority of simulations () the model underestimates the number of shared sequences between twin donors. We speculate that some of these shared TCRs were exchanged in utero. Yet two thirds of YF-reactive TCR amino acid sequences shared between twins have different nucleotide sequences and can only be explained by convergent recombination and selection. Our results also suggest a mechanism for the previously reported extensive sharing of abundant TCRs in twins Zvyagin2014 . Under this mechanism, twins would share more TCR sequences expanded in response to the same infection.
We showed that the response to the vaccine is very diverse, with few TCRs shared even between donors with identical genetic and environmental backgrounds. Nevertheless, using a simple similarity measure, it is possible to identify YFV-specific clonotypes from yet unseen repertoires with high specificity, using datasets of TCRs with known YFV specificity. The sensitivity of this classifier could be improved by collecting more examples of YFV-specific TCRs from more donors. We also show how published antigen-specific sequences can be used for functional repertoire annotation. On day 15 after immunization we found a much higher cumulative frequency of published A02-NS4b214-222-specific sequences compared to pre-vaccination levels. Yet only a few significantly expanded clones matched those published sequences. This could be explained in two possible ways. First, our significantly expanded clones may be specific to epitopes other than NS4b214-222. Second, the A02-NS4b214-222 specific T-cell repertoire may be so diverse that little overlap is to be expected between random subsamples of it. Further accumulation of antigen-specific TCR sequence data — acquired by sequencing of multimer-specific cells, longitudinal studies as done here, and from disease-associated studies with large cohorts Emerson2017 ; Faham ; Pogorelyy2017b — will provide the means for disease diagnostics and extraction of clinically relevant information from T-cell repertoire data.
Materials and methods
Blood donors and samples
Three pairs of healthy monozygous twins participated in this study. Monozygosity was confirmed using polymorphic Alu-insertion genotyping Mamedov2010 . All donors were HLA-typed using an in-house HTS-based solution (see Table S1). None of the participants have ever been vaccinated with YFV-vaccine or traveled to Africa or South America. The blood was collected with informed consent in a certified diagnostics laboratory. For each unsorted PBMC sample we used 4 ml of whole blood per biological replicate, and another 4 ml for CD4+ and CD8+ subpopulation isolation using Dynabeads CD4+ and CD8+ positive selection kits (Invitrogen), and 4 ml for CD45RO+ subpopulation isolation using the CD45RO+ positive isolation kit (Miltenyi Biotec). PBMC were isolated with the Ficoll-Paque method according to the manufacturer’s protocol. All isolated cells were immediately lysed with the Trizol reagent (Invitrogen).
MHC-dextramer staining
Staining with HLA-A*02 the dextramer loaded with the NS4b214-222 peptide (LLWNGPMAV) from YFV-17D (Immudex) was performed according to the manufacturer’s protocol. 25 ml of whole blood was used for PBMC isolation using the Ficoll protocol, PBMCs were stained with MHC-dextramer-PE, and also anti-CD8-FITC (Beckman Coulter, dilution 1:100) and anti-CD3-PC5 antibodies (eBioscience, dilution 1:100).
HLA-DR staining
Isolated PBMCs were stained with anti-CD8-FITC (Invitrogen, dilution 1:100), anti-CD38-PE (eBioScience, dilution 1:100), anti-HLA-DR-PerCP (Invitrogen dilution, 1:100) according to the manufacturer’s instructions.
IFN-gamma secretion assay
The IFN-gamma secretion assay was performed using the IFN-gamma Secretion Assay - Cell Enrichment and Detection Kit (PE human, Myltenyi Biotec). 2.5 ml of whole blood was incubated with /ml YFV-17D particles and 5 ug/ml of the anti-CD28 antibody (eBioscience) for 5 hours. The same amount of blood was incubated with the same amount of media without virus particles and with 5 ug/ml of the anti-CD28 antibody and used as negative control. After stimulation erythrocytes were lysed with ACK Lysing Buffer (Gibco, Thermo Fisher Scientific), and white blood cells were washed by PBS. The secretion assay and IFN-gamma positive cells isolation were performed according to the manufacturer’s protocol using MACS LS Columns (Myltenyi Biotec). anti-CD8-PС5 (Beckman Coulter, dilution 1:100) and anti-CD3-FITC (eBioscience, dilution 1:100) antibodies were added along with the IFN-gamma detection antibody at the corresponding step. Aliquot (1/10) of isolated cells were analyzed by FACS and all other cells were lysed in 500 ul of Trizol reagent (Invitrogen) and used for subsequent RNA isolation.
Analysis of sequencing data of functional assays
All three functional assays (IFN-gamma secretion assay, CD8+CD38+HLA-DR+ staining and A02-NS4b214-222 dextramer staining) provided us with TCR repertoire sequencing information. However, both fluorescence activated cell sorting after dextramer staining, activation marker staining and magnetic column enrichment are not completely precise. These methods enrich resulting samples with YF-specific cells, but abundant irrelevant cells are still found in the corresponding repertoires. To detect clonotypes enriched in the CD8+CD38+HLA-DR+ population, the IFN-gamma producers population or the tetramer-positive population in comparison to the bulk population at the same timepoint we used Fisher’s exact test, as suggested in Ref. DeWitt2015 . For each clone the number of barcodes occupied by it in the activated population, the number of barcodes occupied by other clonotypes in the activated population, the number of barcodes occupied by the clone in the bulk population and the number of barcodes occupied by all other clones in the bulk population formed a contingency table, and then one way Fisher’s exact test was applied. This procedure was repeated for each clone found in the activated population, clones with BH-corrected p-values0.05 were considered significantly enriched in the activated population.
TCR cDNA library preparation and sequencing
TCR cDNA library preparation was performed as described in Ref. Pogorelyy2017 . Briefly, PBMC were isolated from whole blood using the Ficoll density gradient, the total RNA was isolated using the Trizol reagent (Invitrogen). cDNA synthesis with template switch was followed by two steps of PCR amplification to introduce adapter sequences necessary for sequencing on the Illumina platform. Unique molecular identifiers (UMI) were introduced into each cDNA molecule using the template switch effect on the cDNA synthesis step. This allowed us to know the number of cDNA molecules corresponding to each clone, instead of number of raw sequencing reads and thus to correct for PCR bias.
Samples were sequenced on the Illumina HiSeq 2500 with read length. Samples from twin donors were processed and sequenced separately, to prevent contamination and sample barcode exchange on Illumina flow cell.
Raw data analysis
Raw data was demultiplexed and clustered by UMI using the MIGEC software Shugay2014 , alignment of V,D,J templates was then performed by MiXCR Bolotin2015 .
Statistical analysis
Candidate responding clones were identified using a model of mRNA count statistics accounting for differential expression and the sequencing process [Puelma Touzel et al, in preparation]. The normalized clone size, , is distributed according to the probability density function , bounded by , where is an estimate of the total number of lymphocytes in an individual. Based on previous observations Weinstein2009 ; Mora2010 ; Mora2016 , is set as a power-law, i.e. . A clone of size appears in a sample containing lymphocytes on average as cells. To account for overdispersed count statistics, the number of cells is set to be Negative-Binomial distributed with mean and variance , with the coefficient and the power controlling the over-dispersion. For each clone, the number of detected mRNA molecules (i.e. UMI) is distributed according to a Poisson distribution with mean , where is the average number of UMI per cell, obtained using the observed total number of molecules, .
We inferred the parameters of this model, , from day-0 replicates by maximizing the likelihood of the observed count pairs, , where , , for each replicate , and is common to both replicates. For a given pair, the likelihood, , is obtained by marginalizing over , and .
We introduce a selection factor defined as the log-fold change between a clone’s frequency on one day, , and that on another, , and define as before, but replacing by in the definition of . Given a prior distribution over parametrized by a set of parameters distinct from , we used Bayes rule to obtain the posterior log fold-change probability function given an observed count pair, . In analogy with -values, we used the posterior probability corresponding to the null hypothesis that they are not expanded, to rank the clones by the significance of their expansion, using a threshold of . We parametrize our prior as , with the fraction of clones that respond to the change, and their typical effect size. We set the values of the parameters of this prior by again maximizing the likelihood of the count pair data given the model over , .
Identification of expanded clones using edgeR
To check robustness of our clonal expansion model we also used an independent approach to detect expanded clones. edgeR Robinson2009 is a package used to analyse a variety of count data produced with HTS. It was applied for differential gene expression analysis, differential splicing analysis and bisulfite sequencing. Here we apply statistical tests implemented in the edgeR package to identify clones expanded after YFV immunization. Two biological replicates were used for each timepoint, TMM-normalization and trended dispersion estimates was performed as described in the edgeR manual. An exact test based on the quantile-adjusted conditional maximum likelihood (qCML) was used to identify clones significantly expanded between pairs of timepoints. A clonotype was considered significantly expanded, if it’s fold change estimate FC5 and it’s p-value after multiple testing correction was lower than 0.01. We reproduced the main results described in the manuscript text using clonotypes identified as significant by edgeR (see SI Fig. S6), so two differential clone expansion models agree with each other.
Sequence similarity analysis
We used the Hamming distance to quantify CDR3 sequence similarity in each YFV-reactive repertoire. We counted the number of CDR3 amino acid sequence pairs, which are 0 mismatches (same amino acid, but different nucleotide sequences), 1 mismatch or less, 2 mismatches or less from each other. Since the number of YFV-reactive clones varied among donors, the number of similar clones inside each YFV-reactive repertoire needed to be normalized. We divided it by , which is the total number of possible clone pairs. We randomly sampled clonotypes from the same timepoint for comparison, and found a smaller number of similar pairs. In Fig. 4A. we plot the normalized sharing in log scale to compare these values.
Nucleotide sequence sharing analysis of YFV-reactive clonotypes
To see, if the excess of nucleotide sequence sharing in twins may be explained by convergent recombination, we performed the following simulation: for each donor, for each shared YFV-specific TCR amino acid sequence we generated nucleotide variants using a previously published TCR recombination model Murugan2012 and compared the resulting simulated nucleotide sequence variants between donors. Then the total number of shared nucleotide sequences between twins in this simulation was compared to the total number of shared nucleotide sequences between the twins in the data. The simulation was performed 1000 times: in 979 cases out of 1000 the number of nucleotide sequences shared between twins was less than in the data, which gives a p-value0.021. This result suggests, that at the least some of the nucleotide sequences of YF-reactive clones may be shared prenatally between twin donors, because this extensive sharing of nucleotide sequences cannot be explained by convergent recombination and selection. On the contrary, the number of shared nucleotide sequences between unrelated donors in the simulation was rarely less than in the data (in 295 cases out of 1000), which means that the nucleotide sequence sharing between unrelated individuals can easily be achieved by convergent recombination alone (p-value=0.7).
Acknowledgments
TCR libraries sequencing, raw sequencing data processing and reconstruction of TCR repertoires were supported by the Russian Science Foundation grant n.15-15-00178. M.V. Pogorelyy and E.S. Egorov are supported by Skoltech Systems biology fellowships. This work was partially supported by the European Research Council Consolidator Grant n. 724208. We thank Dr. I.V. Zvyagin for his help in finding appropriate donors for this study and M.F. Vorovitch for YFV-17D purification. The experiments were in part conducted using the equipment provided by the CKP IBCH RAS core facility.
References
- (1) Benichou J, Ben-Hamo R, Louzoun Y, Efroni S (2012) Rep-Seq: uncovering the immunological repertoire through next-generation sequencing. Immunology 135:183–91.
- (2) Dash P, et al. (2017) Quantifiable predictive features define epitope-specific T cell receptor repertoires. Nature 547:89–93.
- (3) Glanville J, et al. (2017) Identifying specificity groups in the T cell receptor repertoire. Nature 547:94–98.
- (4) Davis MM, Altman JD, Newell EW (2011) Interrogating the repertoire: broadening the scope of peptide–MHC multimer analysis. Nature Reviews Immunology 11:551–558.
- (5) Robinson J, et al. (2013) The IMGT/HLA database. Nucleic acids research 41:D1222–7.
- (6) Monath TP, Vasconcelos PF (2015) Yellow fever. Journal of Clinical Virology 64:160–173.
- (7) Miller JD, et al. (2008) Human effector and memory CD8+ T cell responses to smallpox and yellow fever vaccines. Immunity 28:710–22.
- (8) Akondy RS, et al. (2009) The yellow fever virus vaccine induces a broad and polyfunctional human memory CD8+ T cell response. Journal of immunology (Baltimore, Md. : 1950) 183:7919–30.
- (9) Akondy RS, et al. (2015) Initial viral load determines the magnitude of the human CD8 T cell response to yellow fever vaccination. Proceedings of the National Academy of Sciences of the United States of America 112:3050–3055.
- (10) Blom K, et al. (2013) Temporal dynamics of the primary human T cell response to yellow fever virus 17D as it matures from an effector- to a memory-type response. Journal of immunology (Baltimore, Md. : 1950) 190:2150–8.
- (11) Kohler S, et al. (2012) The early cellular signatures of protective immunity induced by live viral vaccination. European journal of immunology 42:2363–73.
- (12) Kongsgaard M, et al. (2017) Adaptive immune responses to booster vaccination against yellow fever virus are much reduced compared to those after primary vaccination. Scientific Reports 7:1–14.
- (13) Fuertes Marraco SA, et al. (2015) Long-lasting stem cell-like memory CD8<sup>+</sup> T cells with a naïve-like profile upon yellow fever vaccination. Science Translational Medicine 7.
- (14) DeWitt WS, et al. (2015) Dynamics of the Cytotoxic T Cell Response to a Model of Acute Viral Infection. Journal of Virology 249:JVI.03474–14.
- (15) Zvyagin IV, et al. (2014) Distinctive properties of identical twins’ TCR repertoires revealed by high-throughput sequencing. Proceedings of the National Academy of Sciences 111:5980–5985.
- (16) Rubelt F, et al. (2016) Individual heritable differences result in unique cell lymphocyte receptor repertoires of naïve and antigen-experienced cells. Nature communications 7:11112.
- (17) Qi Q, et al. (2016) Diversification of the antigen-specific T cell receptor repertoire after varicella zoster vaccination. Science Translational Medicine 8:332ra46–332ra46.
- (18) Pogorelyy MV, et al. (2017) Persisting fetal clonotypes influence the structure and overlap of adult human T cell receptor repertoires. PLOS Computational Biology 13:e1005572.
- (19) Robinson MD, McCarthy DJ, Smyth GK (2009) edgeR: A Bioconductor package for differential expression analysis of digital gene expression data. Bioinformatics 26:139–140.
- (20) Shugay M, et al. (2017) VDJdb: a curated database of T-cell receptor sequences with known antigen specificity. Nucleic Acids Research 46:419–427.
- (21) Miles JJ, Douek DC, Price Da (2011) Bias in the T-cell repertoire: implications for disease pathogenesis and vaccination. Immunology and Cell Biology 89:375–387.
- (22) De Boer RJ, Homann D, Perelson AS (2003) Different Dynamics of CD4+ and CD8+ T Cell Responses During and After Acute Lymphocytic Choriomeningitis Virus Infection. The Journal of Immunology 171:3928–3935.
- (23) Buchholz VR, et al. (2013) Disparate individual fates compose robust CD8+ T cell immunity. Science 340:630–635.
- (24) James Ea, et al. (2013) Yellow fever vaccination elicits broad functional CD4+ T cell responses that recognize structural and nonstructural proteins. Journal of virology 87:12794–804.
- (25) Emerson RO, et al. (2017) Immunosequencing identifies signatures of cytomegalovirus exposure history and HLA-mediated effects on the T cell repertoire. Nature Genetics 49:659–665.
- (26) Faham M, et al. (2017) Discovery of T Cell Receptor Motifs Specific to HLA-B27-Positive Ankylosing Spondylitis by Deep Repertoire Sequence Analysis. Arthritis & Rheumatology 69:774–784.
- (27) Pogorelyy MV, et al. (2017) Method for identification of condition-associated public antigen receptor sequences. biorxiv pp 1–9.
- (28) Mamedov IZ, et al. (2010) A new set of markers for human identification based on 32 polymorphic Alu insertions. European journal of human genetics : EJHG 18:808–14.
- (29) Shugay M, et al. (2014) Towards error-free profiling of immune repertoires. Nature methods 11:653–5.
- (30) Bolotin DA, et al. (2015) MiXCR: software for comprehensive adaptive immunity profiling. Nature Methods 12:380–381.
- (31) Weinstein JA, Jiang N, White RA, Fisher DS, Quake SR (2009) High-Throughput Sequencing of the Zebrafish Antibody Repertoire. Science 324:807–810.
- (32) Mora T, Walczak AM, Bialek W, Callan CG (2010) Maximum entropy models for antibody diversity. Proceedings of the National Academy of Sciences of the United States of America 107:5405–10.
- (33) Mora T, Walczak A (2016) Quantifying lymphocyte receptor diversity. pp 1–10.
- (34) Murugan A, Mora T, Walczak AM, Callan CG (2012) Statistical inference of the generation probability of T-cell receptors from sequence repertoires. Proceedings of the National Academy of Sciences 109:16161–16166.
.
| Locus | S1 and S2 | P1 and P2 | Q1 and Q2 |
|---|---|---|---|
| A | 02:01:01/03:01:01 | 02:01:01/02:01:01 | 02:01:01/02:01:01 |
| B | 38:01:01/07:02:01 | 51:01:01/07:02:01 | 13:02:01/44:02:01 |
| C | 07:02:01/12:03:01 | 07:02:01/14:02:01 | 05:01:01/06:02:01 |
| DQB1 | 06:03:01/06:02:01 | 03:01:01/04:02:01 | 02:02:01/06:03:01 |
| DRB1 | 13:01:01/15:01:01 | 08:03:02/08:01:03 | 07:01:01/13:01:01 |
| DRB3 | 01:01:02 | - | 01:01:02 |
| DRB4 | - | - | 01:03 |
| S2 | S1 | P2 | P1 | Q2 | Q1 | |
|---|---|---|---|---|---|---|
| CMV, 0 mism | 0 | 0 | 0 | 0 | 0 | 0 |
| YFV, 0 mism | 6 | 3 | 1 | 2 | 4 | 3 |
| CMV, 1 mism | 0 | 0 | 1 | 0 | 2 | 0 |
| YFV, 1 mism | 9 | 24 | 9 | 12 | 21 | 5 |
| CMV, 2 mism | 8 | 5 | 3 | 5 | 10 | 2 |
| YFV, 2 mism | 29 | 27 | 11 | 24 | 37 | 19 |
| S2 | S1 | P2 | P1 | Q2 | Q1 | |
|---|---|---|---|---|---|---|
| Fraction of public YFV-reactive clones | 0.03 | 0.04 | 0.03 | 0.03 | 0.02 | 0.04 |
| Cumulative freq. of public YFV-reactive clones | 0.05 | 0.08 | 0.06 | 0.03 | 0.03 | 0.34 |
| S2 | S1 | P2 | P1 | Q2 | Q1 | |
|---|---|---|---|---|---|---|
| S2 | 970/955 | 5/20 | 0/3 | 0/4 | 2/9 | 1/3 |
| S1 | 5/20 | 774/763 | 0/3 | 0/5 | 1/12 | 0/4 |
| P2 | 0/3 | 0/3 | 800/792 | 1/18 | 0/2 | 0/0 |
| P1 | 0/4 | 0/5 | 1/18 | 1151/1142 | 0/7 | 0/1 |
| Q2 | 2/9 | 1/12 | 0/2 | 0/7 | 1537/1503 | 4/20 |
| Q1 | 1/3 | 0/4 | 0/0 | 0/1 | 4/20 | 520/510 |