DIFFERENCES IN THE GAS AND DUST DISTRIBUTION IN THE TRANSITIONAL DISK OF A SUN-LIKE YOUNG STAR, PDS 70
Abstract
We present ALMA 0.87 mm continuum, HCO+ J=4–3 emission line, and CO J=3–2 emission line data of the disk of material around the young, Sun-like star PDS 70. These data reveal the existence of a possible two component transitional disk system with a radial dust gap of , an azimuthal gap in the HCO+ J=4–3 moment zero map, as well as two bridge-like features in the gas data. Interestingly these features in the gas disk have no analogue in the dust disk making them of particular interest. We modeled the dust disk using the Monte Carlo radiative transfer code HOCHUNK3D (Whitney et al., 2013) using a two disk components. We find that there is a radial gap that extends from 15-60 au in all grain sizes which differs from previous work.
1 Introduction
Large interferometer telescopes such as the Atacama Large Millimeter/submillimeter Array (ALMA) and the Very Large Telescope Interferometer (VLTI) have recently facilitated an increasingly detailed examination of circumstellar disks around young stars. They have the ability to detect molecular emission spectra, as well as dust continuum emission, at very high angular resolutions even at the millimeter and sub-millimeter wavelengths. The much higher angular resolution, when compared to a single telescope at similar wavelengths, allows us to probe closer to the central star, and study the spatial relationships between gas and dust on a finer scale than ever before.
PDS 70 is a pre-main-sequence star with spectral type K5 and assumed to be part of the Centaurus association, estimated to be at a distance of 140 pc (Riaud et al., 2006). It has previously been imaged in both -band polarized light using Subaru (Hashimoto et al., 2012), as well as more recently at 1.3 mm with the Sub Millimeter Array (SMA) (Hashimoto et al., 2015). In this paper we present a detailed examination of the circumstellar disk of PDS 70 in the 0.87 mm continuum, CO J=3–2 emission, and HCO+ J=4–3 emission based on ALMA observations. These data are at a much higher resolution than the SMA data, compared to , and provide us with a good probe of the larger grains within the disk. They also allow us to examine the gas distribution and detect fine structures within disk gas. This is of particular interest to our study due to the existence of features which appear in the gas disk but are not present in the dust disk. PDS 70 has proven to be a system with a different structure in each of our continuum, CO J=3–2, HCO+ J=4–3 measurements presented below. In addition to our observational data we present a Monte Carlo Radiative Transfer (MCRT) model of the disk using HOCHUNK3D (Whitney et al., 2013) to simultaneously fit existing imagery as well as the spectral energy distribution (SED) of PDS 70. Following the discussion of the data and model, we also present additional SpeX and REM observations of PDS 70 as well as analysis of these data sets in the Appendix including gas accretion, mass, and age estimates.
2 Observations and Data Reduction
Observations were conducted on August 14 and 18, 2016 in the ALMA cycle 3 program (No. 2015.1.000888.S). We used 38 to 39 of the 12 m diameter antennas in the observation. The array configuration provides a maximum and minimum baseline length of 1.5 km and 15.1 m, respectively. Sky conditions were relatively stable with the precipitable water vapor between 0.45 mm and 0.82 mm. The system temperature was between 90 K and 280 K during observations. The correlator was tuned at the center frequency of 345.761 GHz for CO J=3–-2, 356.698 GHz for HCO+ J=4–-3, and 343.955 GHz and 355.497 GHz for continuum observations in dual polarization mode. The effective bandwidths for both emission lines are 468.75 MHz and their frequency resolution is 244.141 kHz, corresponding to approximately 0.21 km s-1 in the velocity resolution.
Data reduction was performed using version 4.7 of the Common Astronomy Software Applications package (CASA). A quasar J1427-4206 was used for bandpass, flux, and phase calibrations, and another quasar J1407-4302 was selected as a second calibrator. We used the task CLEAN in CASA and a continuum image was generated by combining the line-free channels in all of the spectral windows. The self-calibration was performed by applying the obtained continuum image as a model, and gain calibration was repeated until the rms reached minimum. The gain table obtained after the self-calibration of the continuum data was applied to both the CO J=3–2 and HCO+ J=4–3 to generate self-calibrated visibilities. Because the line and continuum observations were simultaneously conducted, and the atmospheric variation equally affects the phase variation of line and continuum data, the calibration table obtained from the continuum data can be applied to line emission calibration. Natural weighting was applied in both continuum and line imaging for better sensitivity. The achieved rms was 0.0551 mJy beam-1 for the continuum, 1.204 mJy beam-1 for CO J=3–2, and 1.118 mJy beam-1 for HCO+ J=4–3. The field of view was approximately 18 and the final synthesized beam of approximately for the continuum image and CO J=3–2 map, and for the HCO+ J=4–3 map after calibration and flagging as denoted in Figures 1, 2. The total integration time on source after flagging is about 56 minutes.
3 Results
3.1 0.87 mm Continuum Measurements
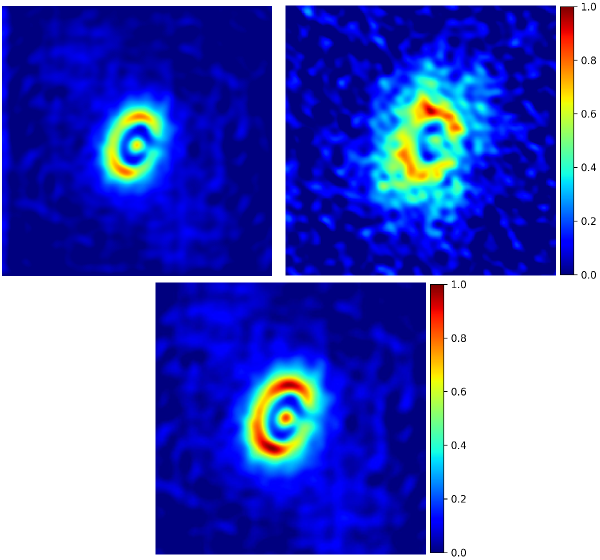
The 0.87 mm continuum image gives us a good measure of the radial extent of the dust disk, the flux density, and reveals some other interesting features. The major axis of the disk lies at 159 East of North, measured via ellipse fitting of the brightest emission along the ring of the disk, (Figure 1) and measures a radial distance of (60 au) from the center at the edge and (110 au) at the outer edge. Both edges were found by measuring a distance equal to half the width of the beam size from the inner and outer edges of the disk that are detectable above noise. The measured flux density is 233 3 mJy integrated at a radius of , past which there is no detectable emission above . In Figure 1 the disk brightness is clearly not symmetrical about the minor axis, similar to what is seen in Kraus et al. (2017), with the NW side 15 brighter than the SE side.
There also appears to be material visible near the center of the disk in the continuum, seen more clearly in the log scaled image (Figure 1, left), which is separated from the outer disk by a radial gap. It is slightly larger than the resolution of the measurement, extending out approximately 0.2 where the resolution of the instrument is and is likely an inner disk component.
3.1.1 HCO+ J=4–3 Measurements
The HCO+ J=4–3 moment 0 emission (Figure 2) reveals a similar gap to what is seen in the dust continuum (Figure 1), though it extends to only au while the outer edge of the HCO+ J=4–3 moment 0 emission extends to au. The gas disk also extends out farther than the dust though not as far as in many very young pre-main-sequence (PMS) stars such as DM Tau (Öberg et al., 2010). It contains a bright blob ( 10 ) to the N, as well as a bridge structure connecting the inner region and the outer disk in the SW, and a gap due W which lies directly adjacent to the bridge. There is also evidence of an azimuthal gap or depleted region to the NE.
The bridge structure is likely to be real, with a signal-to-noise ratio of 5. In order to help verify this we generated a rough model of the bridge and azimuthal gap (Figure 3). This was produced using the CASA 5.2 task simobserve with the thermal noise set to default and the antennas set to the ALMA cycle 4 configuration, alma.cycle4.3.cfg. The seed image for the model is a simple, two-component system generated using HOCHUNK3D with the bridge and depleted region added to the seed using image editing software. We found that in order to produce any asymmetric features to the degree of those seen in Figure 2, the inclusion of dimmer region to reproduce the gap and a bridge connecting the inner and outer disks was needed.
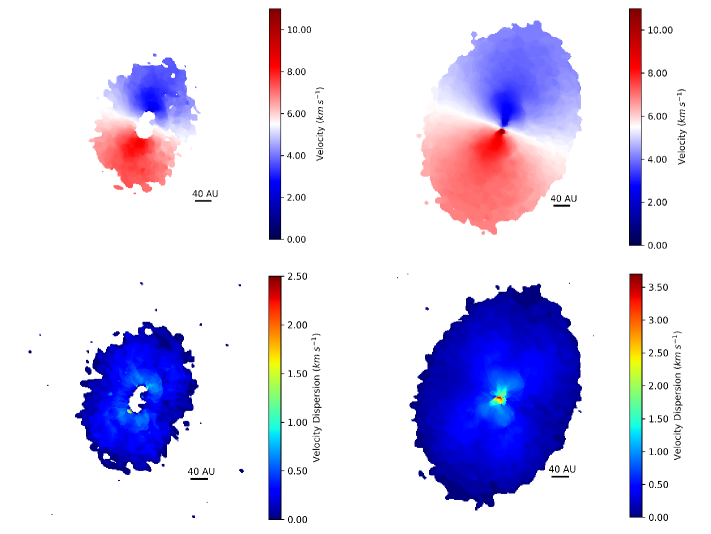
The bridge feature itself appears to be mass transfer between the inner and outer disks similar to what is suggested for HD 142527 (Casassus et al., 2013). If this were the case we would expect to see a radial velocity component roughly perpendicular to the Keplerian motion of the disk which is not seen here (Figure 4). It has also been suggested that bridges such as this can be caused by a polar outflow of gas (Alves et al., 2017). Again however, this is likely not the case however as there appears to be no significant change in velocity in the region of the bridge, and it truncates at the outer disk instead of continuing to expel matter outside of the disk. Its close proximity to the western gap suggests that the two are related and could be due to large body formation which has been shown to cause both depleted regions as well as spiral arms in other disks (Edgar & Quillen, 2008; Dong et al., 2015; Matter et al., 2016). Interestingly enough however, there is no evidence of the bridge feature or an azimuthal gap in the 0.87 mm continuum ring or in -band polarized imagery (Dong et al., 2012).
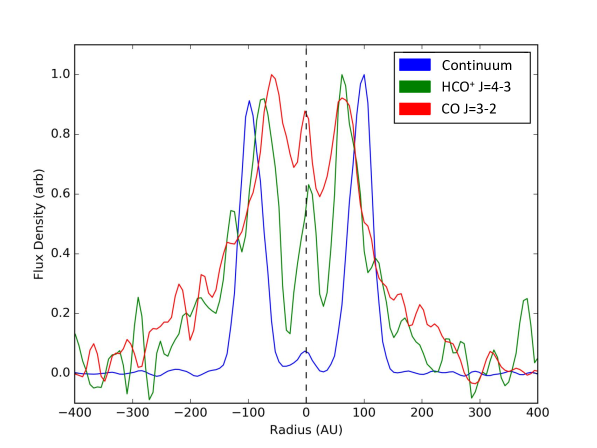
As can be seen in Figure 2, the inner HCO+ J=4–3 disk appears slightly offset from the inner dust disk. To verify this we created radial traces of the continuum and moment 0 gas data, shown in Figure 5. There also may be some asymmetry in the outer gas disk as the HCO+ J=4–3 moment 0 peak intensities lie at different distances from the center of the disk. In the HCO+ J=4–3 moment 1 and 2 maps, the central region was clipped out due to excess noise in the region (Figure 6).
3.1.2 CO J=3–2 Measurements
The CO J=3–2 moment 0 emission lies interior to the continuum and HCO+ J=4–3 emission, exhibiting little to no gap between the inner and outer disk. Similar to the HCO+ J=4–3 moment 0 data this disk extends further out than the dust disk, to au, but again not as much as much younger PMS stars. This is promising for planet formation similar to what is seen in our solar system as there is still mass within 40 au of the star. The emission contains a blob in the S similar to what is seen in HCO+ J=4–3, but almost directly opposite its location in the disk.
Again, similar to what is seen in HCO+ J=4–3, there is a bar feature towards the center of the image. This, however, appears to extend to either side of the disk and, as CO J=3–2 is generally considered optically thick in protoplanetary disks, could be causing the dimmed regions seen at either end of the bridge. It appears the bridge feature lies within the plane of the disk as the moment 1 data shows no deviation from Keplerian rotation in the region of the bridge (Figure 4).
The CO moment 2 map contains a butterfly pattern surrounding the central region. This pattern exists in the same locations as the four bright regions in the moment 0 data, but are due to crowded isovelocity curves in the moment 1 data and are likely not related.
3.2 Model
3.2.1 Initial Model
For our modeling we used the MCRT code HOCHUNK3D (Whitney et al., 2013). This code allows for two distinct grain populations as well as an envelope which can be manipulated into a third distinct grain population if necessary. The locations of these populations can also be changed to produce radial gaps in the disk.
We used a model similar to those of Hashimoto et al. (2015) and Dong et al. (2012) as our starting point. For the star we used a pre-main-sequence star with spectral type K5, a radius of 1.39 R, and a temperature of 4400 K as suggested by Gregorio-Hetem & Hetem (2002). We also use a mass of 0.82 M, estimated by Riaud et al. (2006) using spectral type, and further supported by dynamical fitting (Hashimoto et al., 2015). We then constructed a disk consisting of two rings with a large gap in the middle, a mass of 4.5 MJ, an inclination of 50 (Hashimoto et al., 2012), and a large grain to total grain mass ratio of 0.9667 in order to decrease the optical thickness of the small grains and increase the 10 and 20 m silicate peaks. We also used the same grain types as the Hashimoto et al. (2015) model for the large and small grains which make up the disk.
Our initial model consisted of one that included both grain types in the inner disk which extended from the sublimation radius 0.05 au to 1 au which was used to reproduce the near IR emission seen in the SED. This was followed by a gap which extended to 65 au for the smaller grains and 80 au for the larger grains based on the -band data (Dong et al., 2012), the 1.3 mm data (Hashimoto et al., 2015), and a distance of 140 pc (Riaud et al., 2006). This reproduced a fit to both the SED and 1.3 mm image seen in Hashimoto et al. (2015) as well as Dong et al. (2012).
3.2.2 Model Fitting
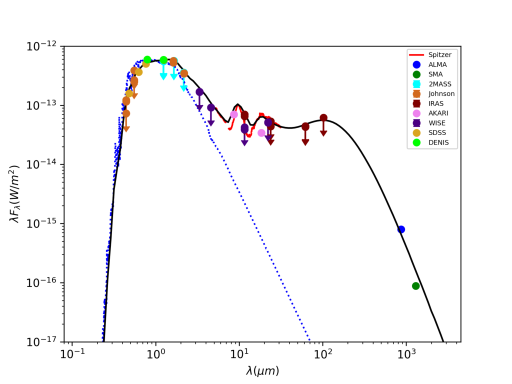
Since the population of small grains is constrained by the character of the silicate emission bands near the 10 and 20 wavelengths, we also include data obtained with the InfraRed Spectrograph (IRS) in our analysis. Both of these features are the result of warm silicate emission close to the star and required modifying the initial model to provide a reasonable fit.
It is important to note also that the AKARI 18 point disagrees with the spectrum despite the band pass of the filter, and could indicate that either there is some variability of the disk or one of the data sets is incorrect. The grains which produce this peak lie approximately 0.5-3 au from the star which, assuming that the star is 0.82 M, suggests orbital periods 0.395.7 years. It is possible therefore, that the disk could have changed between the two data sets. Additionally, it has been suggested that thermal instabilities due to active accretion could result in variability (Sitko et al., 2012). However PDS 70 seems to exhibit no accretion (Appendix A).
A second difference is the inclusion of the newly-acquired of ALMA 0.87 mm continuum data described in Section 2. The ALMA data have a much higher resolution than the SMA data used by Hashimoto et al. (2015), which allows for much better spatial estimates of the disk. These data exhibit a different, 60 au, gap radius and lack the highly asymmetric spatial distributions in the SMA dust emission. This is in agreement with the gap radius found in scattered light (Dong et al., 2012) which suggests that the apparent difference in gap radius for the two grain populations is not real.
To fit the model with these new constraints we included a less dense, though still optically thick, inner disk disk comprised of only small grains which extends from the sublimation radius to 15 au. We also raised the disk mass from 4.5 MJ to MJ to fit the ALMA 0.87 mm point and raised the large grains to total grains ratio to 0.995. This produced very strong silicate peaks, but does not reach the depth of the dips before the 10 and 20 peaks. The inner disk is followed by a gap extending to 60 au and an outer disk extending from 60 au to 110 au, based on the 0.87 mm continuum image. The higher spatial resolution of the ALMA data also allows for better comparison of the disk inclination to the model. We found the apparent inclination of the disk is best reproduced with a model inclination of 45 from face on.
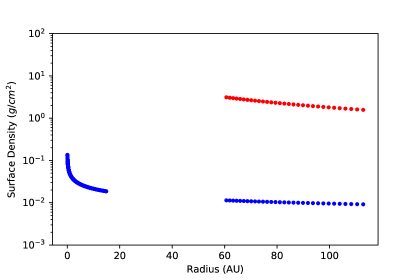
In order to probe the optical depth of the outer disk we examined the thickness of the disk, defined by where z is the scale height (thickness) of the disk, is a constant, r is the radial distance from the star, and b is the flaring exponent (Whitney et al., 2003). Similarly the radial density is defined by where is the density of the disk, is a constant, r is the radial distance from the star, and a is the density exponent (Whitney et al., 2003). To match the SED we find b = 1.15 0.02 and a = 2.25 0.02 for the large grains in our disk and b = 1.15 0.02 and a = 1.5 0.02 for the small grains. Based on these parameters we find that the optical depth of the outer disk is au which is larger than the thickness of the outer disk suggesting that the disk is mostly optically thin at 0.87 mm. These two exponents can also be used to calculate the surface density of the disk via the method described in Whitney et al. (2013) eq. 15 () where is a constant set by the mass of the disk, is the cylindrical radius, and . The surface density profile for the disk can be seen in Figure 7.
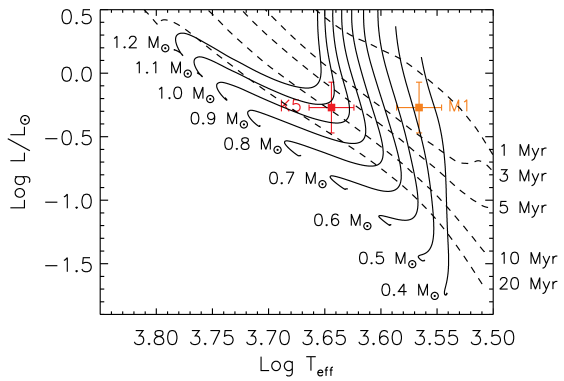
Because of the higher resolution of our data and the differences seen between this and the SMA data (Hashimoto et al., 2015), such as the outer disk extent, we used the CO J=3–2 moment 1 data to find the dynamical mass of PDS 70. Here we assumed a disk inclination of 45, based on our modeling, and similar to what is found in Hashimoto et al. (2015) we see that a mass of 0.6 - 0.8 M (Figure 8) produces a good fit to the data and is in agreement with the Riaud et al. (2006) estimation. This falls within the range of 0.5 - 1.1 M found from comparing the location of PDS 70 to isochrones (Appendix) derived in Tognelli et al. (2011) and seen in Figure 16.
3.2.3 Final Model
To test the accuracy of our model, we compared model images to both the 0.87 mm continuum data (Figure 10) and the -band data (Hashimoto et al., 2012) (Figure 11) after convolving with beam shape and point-spread function of these data respectively. In the case of the 0.87 mm model image we see a ratio of emission between the inner and outer disks which is in agreement with the ALMA image, in both cases, which suggests the inner disk is essentially devoid of large grains. The -band data reproduces the apparent dip in brightness seen in the NE side of the disk (Figure 11). This dip is the result of co-planar shadowing from the the inner disk. The final model parameters can bee seen in Table 1.
4 Discussion
4.1 Asymmetry in 0.87 mm Continuum Image
If we assume the 0.87 mm continuum is optically thin, section 3.2.2, the difference in brightness should correspond to a difference in mass density between the two locations, suggesting that there is more mass density in the NW side of the outer disk. There exists the possibility however, that the difference in brightness could be a result of apocenter glow (Pan et al., 2016), though we do not detect a pericenter offset in this system. Given the resolution of the image however, there could be an offset up to au which would result in an apocenter glow of according to the calculation proposed in Pan et al. (2016).
4.2 Differences in Gas and Dust Imagery
Most of the gas features seen in the HCO+ J=4–3 and CO J=3–2 maps do not have an analogue in the 0.87 mm continuum or -band imagery. The only notable exceptions are the excess flux in the NW of the continuum image, an inner gap, and an inner disk which is present in all available data.
4.2.1 Azimuthal Gap in HCO+ J=4–3
While some of these features are easily explained by known properties, such as the diminished, central region in the CO J=3–2 emission and the larger radial extent of both HCO+ J=4–3 and CO J=3–2 emission, of the gas the lack of an azimuthal gap in the continuum or -band data is not. It is likely not a gravitational depletion of the disk by a compact body as there should be no difference in how the dust and gas are affected gravitationally. This suggests a more exotic cause for the apparent difference.
Options we have considered are a large stellar flare from a coronal mass ejection, an embedded planet, or shadowing from an inner optically thick blob of material. A large stellar flare could disturb the gas in a localized region of the disk and possibly move the dust in that region as well. This could neatly link the azimuthal gap seen in the HCO+ J=4–3 data as well as the large blob of mass seen in the 0.87 mm continuum. A similar effect was seen in AU Mic where it is suggested that a stellar flare caused fast moving features in the dust of the disk (Boccaletti et al., 2015). However, though this could cause feature propagation in the dust disk, we would expect the density wave to travel around the disk or perhaps cause dust blowout from the impact. The difference in density from either scenario is not seen in the 0.87 mm continuum and there seems to be no difference in the location of the bright blob in the 1.3 mm continuum (Hashimoto et al., 2015) and the 0.87 mm continuum.
An embedded planet could cause the local region around it to undergo various chemical changes due to heating from the planet (Cleeves et al., 2015). Though the heating would initially cause any frozen out gasses to sublimate, it may also catalyze complicated chemical interactions which could locally deplete the HCO resulting in an apparent gap in the gas disk. It has been shown that a Jupiter-sized planet can cause an effect in a radius of several au surrounding the planet (Cleeves et al., 2015) which grows as the planet moves further from the star. Unfortunately a planet of this size would not be visible in the currently available data.
Shadowing from an inner disk would result in an apparent gap in the disk dust (Long et al., 2017; Stolker et al., 2016) and should similarly effect the gas if the inner disk is optically thick enough. In this instance, however, the shadowing body would necessarily have an asymmetric distribution as there is no equivalent azimuthal gap on the western side of the HCO+ J=4–3 disk, only minor dimming. This could explain the apparent inner disk offset seen in the HCO+ J=4–3 moment zero data as it lies on the NE side of the star closely aligned with the apparent gap. If this is the source of the apparent gap, then we would expect the shadow to move as the shadowing body moves around the star. This should happen within several months given that the shadowing body would appear to be at a radius of au.
4.2.2 Gas-poor inner disk region
As previously mentioned the SED suggests the existence of dust close to sublimation radius of the star which is further supported by our modeling. In contrast, we see in our SpeX data (discussed more thoroughly in the Appendix) that the innermost regions of the disk, less than 1 au, seem to be devoid of gas as there is no net emission for hydrogen or CO gas (Figure 15) above photospheric. There is however some Ca II emission which suggests that there is chromoshperic activity similar to what is seen in HD 163296 (Sitko et al., 2008). The lack of gas emission close to the star suggests that there is also no active accretion of gas onto the star.
4.2.3 Bar across CO
The CO J=3–2 moment 1 data reveals what appears to be a bar along the minor axis of the disk. At opposite sides of the disk, directly adjacent to the bridge feature there appear to be dips in brightness in the CO moment 1 map. If the bridge feature is optically thick, as expected from CO gas, it could in turn shadow the gas in the outer disk. This however raises the question as to how the bridge structure could have formed. It could be a mass transfer between the inner and outer disk, though over time we would expect that the bridge would not remain solely along the minor axis, but instead would smear out due to Keplerian motion. We would also expect that some dust would be transferred as well which is not seen in the continuum data. This suggests it could lie in a plane nearly perpendicular the plane of the outer disk. However, as mentioned in Section 3, there appears to be no deviation from Keplerian motion in the vicinity of the bridge. The lack of deviation also means it is likely not an outflow from the inner disk as well.
5 Conclusion
In this paper we presented the imagea of the dust continuum at 0.87 mm, the HCO+ J=4–3 emission, and the CO J=3–2 emission of the disks around PDS 70. We use these along with the SED of the system and -band polarized data to produce a MCRT model of the system. The main results of our modeling and observation are as follows.
-
•
There is an azimuthal gap in the HCO+ J=4–3 emission which has not been observed in other gas disks. Several possible causes include gravitational depletion by an embedded body, a large stellar flare, chemical changes due to the heating of an embedded body, and shadowing of the gas by an inner disk component. Further study is needed however to determine the most likely candidate.
-
•
The sub-au region of the disk is gas poor despite evidence for a dusty inner disk component. This suggests that there is likely no gas accretion onto the star.
-
•
There appears to be an arm in the HCO+ J=4–3 emission. The arm could be caused by a planet either very close to the star (5 au), or in the radial gap seen in the HCO+ J=4–3 and the ring seen the continuum image.
-
•
The CO J=3–2 data exhibits a bridge along it’s minor axis. The bars linear shape and the lack of deviation from Keplerian motion in the moment 1 data in that region indicate that it lies within the plane of the disk, but has not been smeared out due to Keplerian rotation. The optical thickness of CO gas, and the close proximity of the bridge to the two dim regions in the CO J=3–2 emission, suggest the bridge could be shadowing the gas disk.
-
•
MCRT modeling, 0.87 mm continuum, and -band polarized data suggest that PDS 70 has a two component dust disk. The inner disk component extends from the sublimation radius out to 15 au and is followed by a radial gap to 60 au. The outer disk component then extends from 60 au to 110 au.
-
•
We do not observe a difference between the small and large dust grain locations in the outer disk as proposed in previous work. Our 0.87 mm continuum image, which probes large grains on the order of 1 mm in size, exhibits a similar radial extent to that of the -band polarized imagery, which probes small grains. The difference between our findings and that of Hashimoto et al. (2015) is likely due to the low angular resolution of SMA data when compared to ALMA data.
-
•
The CO J=3–2 moment 1 measurements suggests a dynamical mass of PDS 70 of 0.6 - 0.8 M similar to what has been seen in Hashimoto et al. (2015) and is consistent with the extended kinematics around a K5 star.
In this paper we have discussed various features which appear in the gas disk of PDS 70 but are not present in the dust disk. Although we cannot determine a definitive cause for these features with existing data, their existence does provide new incentives to observe this disk with other high angular resolution, high contrast instruments such as VLTI MATISSE or the NIRISS aperture masking interferometry mode of the James Webb Space Telescope. These instruments would allow us to probe the inner regions of the disk where we suspect large planets could be causing many of these features.
We also discussed the overall structure of the dust disk found from continuum data and MCRT modeling. The disk seems to have no strong segregation between the dust grain sizes in the outer disk, but the inner disk does appear to be devoid of large grains. This is contrary to what is suggested in previous work, but is supported by the large silicate peaks in the SED. Further investigation of the inner disk is necessary to confirm its radial extent and optical depth, and may be accomplished through use of the instruments mentioned above.
References
- Alves et al. (2017) Alves, F. O., Girart, J. M., Caselli, P., et al. 2017, A&A, 603, L3
- Asplund et al. (2005) Asplund, M., Grevesse, N., & Sauval, A. J. 2005, in Astronomical Society of the Pacific Conference Series, Vol. 336, Cosmic Abundances as Records of Stellar Evolution and Nucleosynthesis, ed. T. G. Barnes, III & F. N. Bash, 25
- Asplund et al. (2009) Asplund, M., Grevesse, N., Sauval, A. J., & Scott, P. 2009, ARA&A, 47, 481
- Boccaletti et al. (2015) Boccaletti, A., Thalmann, C., Lagrange, A.-M., et al. 2015, Nature, 526, 230
- Casassus et al. (2013) Casassus, S., van der Plas, G., M, S. P., et al. 2013, Nature, 493, 191
- Cleeves et al. (2015) Cleeves, L. I., Bergin, E. A., & Harries, T. J. 2015, ApJ, 807, 2
- Cushing et al. (2004) Cushing, M. C., Vacca, W. D., & Rayner, J. T. 2004, PASP, 116, 362
- Debes et al. (2013) Debes, J. H., Jang-Condell, H., Weinberger, A. J., Roberge, A., & Schneider, G. 2013, ApJ, 771, 45
- Dong et al. (2015) Dong, R., Zhu, Z., Rafikov, R. R., & Stone, J. M. 2015, ApJ, 809, L5
- Dong et al. (2012) Dong, R., Hashimoto, J., Rafikov, R., et al. 2012, ApJ, 760, 111
- Edgar & Quillen (2008) Edgar, R. G., & Quillen, A. C. 2008, MNRAS, 387, 387
- Gregorio-Hetem & Hetem (2002) Gregorio-Hetem, J., & Hetem, A. 2002, MNRAS, 336, 197
- Hashimoto et al. (2012) Hashimoto, J., Dong, R., Kudo, T., et al. 2012, ApJ, 758, L19
- Hashimoto et al. (2015) Hashimoto, J., Tsukagoshi, T., Brown, J. M., et al. 2015, ApJ, 799, 43
- Henden et al. (2016) Henden, A. A., Templeton, M., Terrell, D., et al. 2016, VizieR Online Data Catalog, 2336
- Ingleby et al. (2011) Ingleby, L., Calvet, N., Bergin, E., et al. 2011, ApJ, 743, 105
- Kastner et al. (2014) Kastner, J. H., Hily-Blant, P., Rodriguez, D. R., Punzi, K., & Forveille, T. 2014, ApJ, 793, 55
- Kim et al. (1994) Kim, S.-H., Martin, P. G., & Hendry, P. D. 1994, ApJ, 422, 164
- Kiraga (2012) Kiraga, M. 2012, VizieR Online Data Catalog, 1206
- Kraus et al. (2017) Kraus, S., Kreplin, A., Fukugawa, M., et al. 2017, ApJ, 848, L11
- Long et al. (2017) Long, Z. C., Fernandes, R. B., Sitko, M., et al. 2017, ApJ, 838, 62
- Matter et al. (2016) Matter, A., Labadie, L., Augereau, J. C., et al. 2016, A&A, 586, A11
- Metchev et al. (2004) Metchev, S. A., Hillenbrand, L. A., & Meyer, M. R. 2004, ApJ, 600, 435
- Öberg et al. (2010) Öberg, K. I., Qi, C., Fogel, J. K. J., et al. 2010, ApJ, 720, 480
- Pan et al. (2016) Pan, M., Nesvold, E. R., & Kuchner, M. J. 2016, ApJ, 832, 81
- Pecaut & Mamajek (2013) Pecaut, M. J., & Mamajek, E. E. 2013, ApJS, 208, 9
- Preibisch & Mamajek (2008) Preibisch, T., & Mamajek, E. 2008, The Nearest OB Association: Scorpius-Centaurus (Sco OB2), 235
- Rayner et al. (2003) Rayner, J. T., Toomey, D. W., Onaka, P. M., et al. 2003, PASP, 115, 362
- Riaud et al. (2006) Riaud, P., Mawet, D., Absil, O., et al. 2006, A&A, 458, 317
- Sitko et al. (2008) Sitko, M. L., Carpenter, W. J., Kimes, R. L., et al. 2008, ApJ, 678, 1070
- Sitko et al. (2012) Sitko, M. L., Day, A. N., Kimes, R. L., et al. 2012, ApJ, 745, 29
- Skrutskie et al. (2006) Skrutskie, M. F., Cutri, R. M., Stiening, R., et al. 2006, AJ, 131, 1163
- Song et al. (2012) Song, I., Zuckerman, B., & Bessell, M. S. 2012, AJ, 144, 8
- Stolker et al. (2016) Stolker, T., Dominik, C., Avenhaus, H., et al. 2016, A&A, 595, A113
- Tognelli et al. (2011) Tognelli, E., Prada Moroni, P. G., & Degl’Innocenti, S. 2011, A&A, 533, A109
- Vacca et al. (2003) Vacca, W. D., Cushing, M. C., & Rayner, J. T. 2003, PASP, 115, 389
- Whitney et al. (2013) Whitney, B. A., Robitaille, T. P., Bjorkman, J. E., et al. 2013, ApJS, 207, 30
- Whitney et al. (2003) Whitney, B. A., Wood, K., Bjorkman, J. E., & Wolff, M. J. 2003, ApJ, 591, 1049
- Wood et al. (2002) Wood, K., Wolff, M. J., Bjorkman, J. E., & Whitney, B. 2002, ApJ, 564, 887
6 Appendix
6.1 Appendix A
6.1.1 SpeX and REM Observations of PDS 70
PDS 70 was observed on 13 Jan. 2017 UT using the SpeX spectrograph (Rayner et al., 2003) on NASA’s Infrared Telescope Facility (IRTF). For these observations the SXD grating (0.7-2.4 m) and 0.8 arcsec wide slit were used. Data reduction was done using the Spextool package (Cushing et al., 2004) running under IDL. Telluric correction and flux calibration (Vacca et al., 2003) were done using the A0V star HD 130163.
We also observed PDS 70 on 10 June 2016 UT using the Rapid Eye Mount (REM) telescope in the g′r′i′z′JH filters. Two flux calibration stars were used, SA94-242 and GSPC-P525E. Our REM data is shown in Figure 12, along with the g′r′i′ data from the AAVSO Photometric All Sky Survey (APASS; Henden et al. (2016)) and JHK data from the 2MASS survey (Skrutskie et al., 2006). These were used to determine the approximate absolute fluxes for the SXD data.
In Figure 13 we compare our SpeX spectrum with a sample of similar data sets from the IRTF Spectral Library (http://irtfweb.ifa.hawaii.edu/~spex/IRTF_Spectral_Library/). Despite K5V classification usually adopted for the star (Gregorio-Hetem & Hetem, 2002; Riaud et al., 2006), at near-IR wavelengths it resembles an early M star. Similar differences in classification between visible and infrared wavelengths have been seen before in other stars such as TW Hydrae (Debes et al., 2013) and V4046 Sgr (Kastner et al., 2014).
6.1.2 Gas Accretion in the PDS 70 System
To determine the potential gas accretion characteristics in PDS 70, we subtracted off a spectral model consisting of the photospheric flux and the thermal contribution of the dust (Figure 14), in a manner similar to that of Sitko et al. (2012). For the template photosphere, we used the SpeX spectrum of a K5V star. Despite the fact that Gregorio-Hetem & Hetem (2002) found H emission, we find that the Pa line commonly used as a measure of accretion in PMS stars showed no detectable emission (Figure 15). The CO bandhead emission between 2.3 and 2.4 m that are sometimes seen in emission in gas-rich debris disks also look as if there is no appreciable CO in emission. In contrast, the lines of Ca II are weakly in emission. It is known that in late type PMS stars, lines of Ca II can be in emission when accretion is otherwise weak or absent (Ingleby et al., 2011), suggesting that this line, and possibly H , are chomospheric in origin, and not due to gas accretion onto the star. These data suggest that the inner regions of the disk system in PDS 70 are gas-poor, and that the CO gas detected with ALMA in the inner regions of PDS 70 do not extend down to the star itself. This is also suggested from CO J=3–2 moment 1 data where we can infer that the gas only extends down to au.
6.1.3 Mass and Age of PDS 70
Using the V magnitude of PDS 70 (Kiraga, 2012), the 140 pc distance from the association with the Sco-Cen Association, and the bolometric correction and initially adopting an effective temperature for a K5 PMS stars from Pecaut & Mamajek (2013) we derived a luminosity of 0.65 L☉. Figure 16 shows the location of PDS 70 relative to the PMS evolution tracks and isochrones (Tognelli et al., 2011), for z = 0.02, helium mass fraction of 0.27, convective parameter = 1.68, and a deuterium abundance of . The on-line versions of these use the abundances of Asplund et al. (2005) but are nearly indistinguishable from those based on the revised abundances of Asplund et al. (2009) as seen in the figures in Tognelli et al. (2011). From these we derived a mass of 1.1 M☉ and an age of 10 Myr. If instead, we do the same determination for an M1V classification, the mass drops to 0.5 M☉ and the age to around 2 Myr. Based on the equivalent width of the Li lines in PDS 70 from Gregorio-Hetem & Hetem (2002), Metchev et al. (2004) derive an age of 10 Myr. The location in the sky would put PDS 70 in the Upper Centaurus Lupus (UCL) region (Preibisch & Mamajek, 2008) of the Sco-Cen Association. Song et al. (2012) have looked at a large number of G, K, and M stars in the Sco-Cen complex. Based on PMS evolutionary tracks and Li line strengths, they find an age of 10 Myr for this region. This number is consistent with the age we obtained for the K5V classification for PDS 70.
| Model Parameters | ||
|---|---|---|
| Parameter | Value | Source |
| Stellar Radius | 1.39 R | (Gregorio-Hetem & Hetem, 2002) |
| Stellar Mass | 0.82 M | (Riaud et al., 2006) |
| Stellar Distance | 140 pc | (Riaud et al., 2006) |
| Stellar Temperature | 4400 K | (Gregorio-Hetem & Hetem, 2002) |
| Spectral Type | K5V | (Gregorio-Hetem & Hetem, 2002) |
| Small Grains | ISM | (Kim et al., 1994) |
| SG Inner Radius | 0.05 au | - |
| SG Outer Radius | 110 au | - |
| Large Grains | Model 2 | (Wood et al., 2002) |
| LG Inner Radius | 60 au | - |
| LG Outer Radius | 110 au | - |
| Disk Inclination | 45 | - |
| Gap | 15-60 au | - |
| Disk Mass | 0.42 MJ | - |