ifaamas \acmDOIdoi \acmISBN \acmConference[AAMAS’18]Proc. of the 17th International Conference on Autonomous Agents and Multiagent Systems (AAMAS 2018), M. Dastani, G. Sukthankar, E. Andre, S. Koenig (eds.)July 2018Stockholm, Sweden \acmYear2018 \copyrightyear2018 \acmPrice
0000-0002-0561-9641 \affiliation \institutionCollective Learning Group, The MIT Media Lab \cityMassachusetts Institute of Technology, 22 Ames Street, Cambridge \stateMassachusetts \postcode02139
INESC-ID and Instituto Superior Técnico,
Universidade de Lisboa
\state2744-016 Porto Salvo, Portugal
Local Wealth Redistribution Promotes Cooperation in Multiagent Systems
Abstract.
Designing mechanisms that leverage cooperation between agents has been a long-lasting goal in Multiagent Systems. The task is especially challenging when agents are selfish, lack common goals and face social dilemmas, i.e., situations in which individual interest conflicts with social welfare. Past works explored mechanisms that explain cooperation in biological and social systems, providing important clues for the aim of designing cooperative artificial societies. In particular, several works show that cooperation is able to emerge when specific network structures underlie agents’ interactions. Notwithstanding, social dilemmas in which defection is highly tempting still pose challenges concerning the effective sustainability of cooperation. Here we propose a new redistribution mechanism that can be applied in structured populations of agents. Importantly, we show that, when implemented locally (i.e., agents share a fraction of their wealth surplus with their nearest neighbors), redistribution excels in promoting cooperation under regimes where, before, only defection prevailed.
Key words and phrases:
Emergent behaviour; Social networks; Social simulation; Simulation of complex systems; Cooperation¡ccs2012¿ ¡concept¿ ¡concept_id¿10010147.10010178.10010219.10010220¡/concept_id¿ ¡concept_desc¿Computing methodologies Multi-agent systems¡/concept_desc¿ ¡concept_significance¿500¡/concept_significance¿ ¡/concept¿ ¡concept¿ ¡concept_id¿10010147.10010178.10010219.10010223¡/concept_id¿ ¡concept_desc¿Computing methodologies Cooperation and coordination¡/concept_desc¿ ¡concept_significance¿500¡/concept_significance¿ ¡/concept¿ ¡/ccs2012¿
[500]Computing methodologies Multi-agent systems \ccsdesc[500]Computing methodologies Cooperation and coordination
1. Introduction
Explaining cooperation among selfish and unrelated individuals has been a central topic in evolutionary biology and social sciences Nowak (2012). Simultaneously, the challenge of designing cooperative Multiagent Systems (MAS) has been a long standing goal of researchers in artificial intelligence (AI) Genesereth et al. (1986); Jennings et al. (1998). More than thirty years ago it was already clear that ”Intelligent agents will inevitably need to interact flexibly with other entities. The existence of conflicting goals will need to be handled by these automated agents, just as it is routinely handled by humans.“ Genesereth et al. (1986).
In Cooperative multiagent interactions, agents need to collaborate towards common goals, which introduces challenges associated with coordination, communication and teamwork modeling Panait and Luke (2005); Jennings et al. (1998). Self-interested interactions, in contrast, require the design of indirect incentive schemes that motivate selfish agents to cooperate in a sustainable way Ephrati and Rosenschein (1996); Jennings et al. (1998). Cooperation is often framed as an altruistic act that requires an agent to pay a cost () in order to generate a benefit () to another. Refusing to incur in such a cost is associated with an act of defection and results in no benefits generated. Whenever the benefit exceeds the cost () and plays occur simultaneously, agents face the Prisoner’s Dilemma, a decision-making challenge that embodies a fundamental social dilemma within MAS Macy and Flache (2002): rational agents pursuing their self-interests are expected to defect, while the optimal collective outcome requires cooperation. If defection is the likely decision of rational agents, however, how can we justify the ubiquity of cooperation in the real world? Evolutionary biology has pursued this fundamental question by searching for additional evolutionary mechanisms that might help to explain the emergence of cooperative behavior Nowak (2012, 2006). Some of these mechanisms allowed to develop solutions that found applications in computer science, such as informing about ways of incentivizing cooperation in p2p networks Golle et al. (2001); Feldman and Chuang (2005), wireless sensor networks Akyildiz et al. (2002), robotics Waibel et al. (2011) or resource allocation and distributed work systems Seuken et al. (2010) – to name a few.
Network reciprocity is one of the most popular mechanisms to explain the evolution of cooperation in social and biological systems Nowak and May (1992); Santos and Pacheco (2005); Ohtsuki et al. (2006); Pinheiro et al. (2012, 2016); Pinheiro and Hartmann (2017). In this context, populations are structured and interactions among agents are constrained. These constraints are often modelled by means of a complex network of interactions. Applications of this mechanism have been explored in the design of MAS that reach high levels of cooperation Hofmann et al. (2011); Peleteiro et al. (2014); Ranjbar-Sahraei et al. (2014); Airiau et al. (2014). Despite these advances, cooperation on structured populations is still hard to achieve when considering social dilemmas with high levels of temptation to defect. Additional complementary mechanisms are required.
Here we consider that agents contribute a percentage of their surplus (defined below), which is later divided among a Beneficiary Set of other agents. In this context, we aim at answering the following questions:
-
•
Does redistribution of wealth promote the evolution of cooperation?
-
•
How should Beneficiary Sets be selected?
-
•
What are the potential disadvantages of such a mechanism?
Using methods from Evolutionary Game Theory (EGT) Sigmund (2010) and resorting to computer simulations, we explore how wealth redistribution impacts the evolution of cooperation on a population of agents without memory (i.e. unable to recall past interactions) and rationally bounded (i.e. lacking full information on payoff structure of the game they are engaging). We assume that agents resort to social learning through peer imitation, which proves to be a predominant adaptation scheme employed by humans Rendell et al. (2010). Also, we consider that strategies are binary – Cooperate and Defect – opting to focus our attention on the complexity provided by 1) heterogeneous populations, 2) the redistribution mechanism and 3) the self-organizing process of agents when adapting over time. The role of larger strategy spaces (such as in Peleteiro et al. (2014); Ranjbar-Sahraei et al. (2014); Santos et al. (2017)) lies outside the scope of the present work.
With redistribution, we show that cooperation emerges in a parameter region where previously it was absent. Moreover, we show that the optimal choice of redistributing groups consists in picking the nearest neighbors (local redistribution). This result fits with a local and polycentric view of incentive mechanisms Ostrom (2015); Vasconcelos et al. (2015) in MAS, which may not only be easier to implement but, as we show, establish an optimal scale of interaction in terms of eliciting cooperation.
2. Related Work
The problem of Cooperation is a broad and intrinsically multidisciplinary topic, which has been part of the MAS research agenda for a long time Jennings et al. (1998); Genesereth et al. (1986). In the realm of evolutionary biology, several mechanisms were proposed to explain the evolution of cooperation Nowak (2006). Kin selection Hamilton (1964), direct reciprocity Trivers (1971), indirect reciprocity Nowak and Sigmund (2005); Santos et al. (2018) and network reciprocity Santos and Pacheco (2005); Ohtsuki et al. (2006) constitute some of the most important mechanisms proposed. Remarkably, these mechanisms have been applied in AI in order to design MAS in which cooperation emerges. For example, Waibel et al. associated kin selection with evolutionary robotics Waibel et al. (2011); Griffiths employed indirect reciprocity to promote cooperation in p2p networks while Ho et al. investigated the social norms that, through a system of reputations and indirect reciprocity, promote cooperation in crowdsourcing markets Griffiths (2008); Ho et al. (2012). Similarly, Peleteiro et al. combined indirect reciprocity with complex networks to design a MAS where, again, cooperation is able to emerge Peleteiro et al. (2014). On top of that, Han applied EGT – as performed in our study – in order to investigate the role of punishment and commitments in multiagent cooperation, both in pairwise Han (2016) and group interactions Han et al. (2017). Regarding alternative agent-oriented approaches to sustain cooperation in MAS, we shall underline the role of electronic institutions Esteva et al. (2004); Arcos et al. (2005) whereby agents’ actions are explicitly constrained so that desirable collective behaviors can be engineered.
The role of population structure and network reciprocity is, in this context, a prolific area of research. In Pinheiro et al. (2012) it was shown that complex networks are able to fundamentally change the dilemma at stake, depending on the particular topology considered Pinheiro et al. (2012); Ichinose et al. (2017); Ranjbar-Sahraei et al. applied tools from control theory in order to study the role of complex networks on the evolution of cooperation Ranjbar-Sahraei et al. (2014). Importantly, the role of dynamic networks – i.e., agents are able to rewire their links – was also shown to significantly improve the levels of cooperation, especially in networks with a high average degree of connectivity Santos et al. (2006); Pinheiro et al. (2016). A survey on the topic of complex networks and the emergence of cooperation in MAS can be accessed in Hofmann et al. (2011).
Previous works found that cooperation in structured population substantially decreases when the temptation to defect increases (see Model for a proper definition of Temptation). Thereby, here we contribute with an additional mechanism of cooperation on structured populations. We consider a mechanism of redistribution, inspired in the wealth redistribution mechanisms that prevail in modern economic/political systems, mainly through taxation. We are particularly interested in understanding how to sample redistribution groups in an effective way. In this context, we shall underline the works of Salazar et al. and Burguillo-Rial, in which a system of taxes and coalitions was shown to promote cooperation on complex networks Salazar et al. (2011) and regular grids Burguillo-Rial (2009). While Salazar et al. (2011) and Burguillo-Rial (2009) do an excellent job showing how coalitions – leaded by a single agent – emerge, here we consider a simpler/decentralized model (e.g. no leaders are considered and taxes are redistributed rather than centralized in a single entity) and focus our analysis on showing that local redistribution sets are optimal. Our approach does not require additional means of reciprocity, memory, leadership, punishment or knowledge about features of the network. We cover a wide range of dilemma strengths and explicitly show when the local redistribution promotes cooperation by itself. Notwithstanding, the analysis performed in Salazar et al. (2011) and Burguillo-Rial (2009) surely provides important insights to address in future works, on how to explicitly model the adherence to beneficiary sets and guarantee their stability. Also, while here we assume an egalitarian redistribution over each individual in the Beneficiary Set, we shall note that different redistribution heuristics may imply different levels of allocation fairness Pitt et al. (2012). In this context, a recent work introduces the concept of Distributed Distributed Justice Kurka and Pitt (2016) and shows that local interactions may provide a reliable basis to build trust and reputation between agents, which can be used to regulate, in a decentralized way, the levels of justice in agents’ actions. This way, it is rewarding to note that local interactions not only constitute an optimal scale to form cooperative Beneficiary Sets (as we show, see below), but also provide the convenient interaction environment to allow justice in contributions to be sustained.
3. Model
3.1. Three Stage Redistribution Game
Here we propose a sequential game dynamics made of three stages. Focusing on an arbitrary agent , these stages can be described as follows:
-
(1)
Agent participates in a one-shot game (here a Prisoner’s Dilemma) with all his/her neighbors . From each interaction , he/she obtains a payoff . After all interactions, agent accumulates a total payoff ;
-
(2)
Next, agent contributes a fraction of his/her payoff surplus () to be redistributed. The group that benefits from agent contribution is called Beneficiary Set ().
-
(3)
Finally, agent receives his/her share from each Beneficiary Set that he/she is part of.
We refer to as the level of taxation, as it defines the fraction of the surplus that agents contribute, while is the threshold level of payoff that defines the surplus. By definition, agents with negative payoff cannot contribute (i.e., ); they might, however, receive benefits from the Beneficiary Sets. Each agent contributes only to one Beneficiary Set from which they cannot be part of, that is, agents do not receive from the Beneficiary Set they contribute to. A central question of this work is how to select for each . As we show, this decision has a profound and non-trivial impact on the overall cooperation levels in the system.
3.2. The Prisoner’s Dilemma Game
In general, all the possible outcomes of a two-strategy two-player game, in which two agents engage in a one-shot interaction that requires them to decide – independently and simultaneously – whether they wish to Cooperate (C) or to Defect (D), can be summarized in a payoff matrix, such as
| C | D | |
|---|---|---|
| C | ||
| D |
which reads as the payoff obtained by playing the row strategy when facing an opponent with the column strategy. Here, represents the Reward payoff for mutual cooperation and the Punishment for mutual defection. When one of the individuals Defects and the other Cooperates, the first receives the Temptation payoff () while the second obtains the Sucker’s payoff (). In this manuscript we consider that agents interact according to the Prisoner’s Dilemma (PD). Agents are said to face a PD whenever the relationship between the payoffs is such that Sigmund (2010). In such a scenario, rational agents seeking to optimize their self-returns are expected to always Defect. However, since the best aggregated outcome would have both players cooperating (), agents are said to face a social dilemma: optimizing self-returns clashes with optimizing the social outcome. In this sense, mutual cooperation is Pareto Optimal and contributes to increase both average payoff (over mutual defection) and egalitarian social welfare (over unilateral cooperation) Endriss and Maudet (2003). It is noteworthy to mention that other situations – with different optimal rational responses – arise when the parameters take a different relationship Macy and Flache (2002): the Stag Hunt game when ; the Snowdrift Game when ; the Harmony Game when ; or the Deadlock Game when , to name a few. Notwithstanding, the PD is by far the most popular metaphor of social dilemmas Sigmund (2010) and the one that presents the biggest challenge for cooperation to emerge. For these reasons, PD shall be the main focus of study in this manuscript. We further simplify the parameter space by considering that , , and with the game being fully determined by the Temptation value (T). In that sense, higher temptation creates more stringent conditions for the emergence of cooperation.
3.3. Prisoner’s Dilemma with Wealth Redistribution
As an introductory example, let us start by analyzing the particular case of two interacting agents ( and ) in a one-shot event. In this case, the Beneficiary Sets of each agent ( and ) are composed only by the opponent. Wealth/payoff redistribution can thus be analyzed by considering a slightly modified payoff matrix, that takes into account the second and third stages. The resulting payoff matrix becomes
| C | D | |
|---|---|---|
| C | ||
| D |
where is the payoff threshold and is the level of taxation. The rationale to arrive at this payoff structure is the following: whenever both players choose to act the same way the payoff remains the same as their contributions (from taxes) and benefits (from receiving the contributions of their opponent) cancel out. A Defector playing against a Cooperator sees his payoff of subtracted by an amount while not receiving any benefit, since the Cooperator has negative payoff and does not contribute. Likewise, the Cooperator is exempt from contributing but receives an additional contribution of , which represents the amount taxed to the Defector.
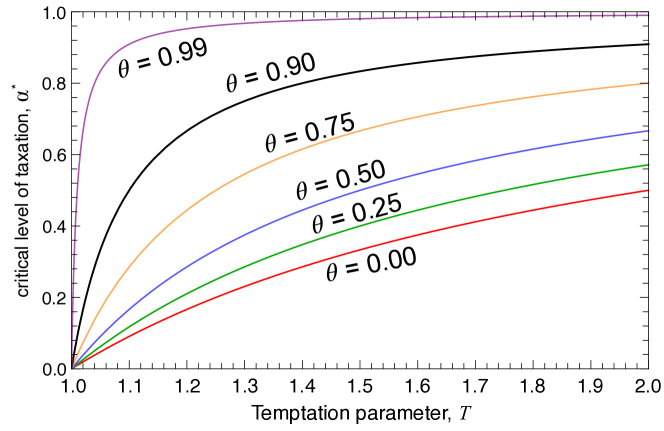
To inspect whether wealth redistribution changes the nature of the social dilemma (i.e. from a Prisoner’s Dilemma to another type of game) we have to inspect whether there is a difference in the relationship between the payoffs and or and . This sums up to solving a single inequality,
| (1) |
which results in the critical values of ,
| (2) |
Hence, depending on the choice of and for a given , is the minimum level of taxation required to observe a change in the nature of the game faced by agents. It is straightforward to notice that the nature of the game changes from a Prisoner’s Dilemma to an Harmony Game as the relationship moves from to . Figure 1 shows for different values of and . Clearly, in well-mixed populations and under the simple scenario of a MAS composed by two agents, the redistribution mechanism has the simple effect of reshaping the payoff matrix, trivially changing the nature of the dilemma. Such a trivial conclusion cannot be drawn with large populations playing on networks, where we will show that different ways of assigning the Beneficiary Sets have a profound impact on the ensuing levels of cooperation.
3.4. Structured Populations
Let us consider a population of agents in which agents correspond to the nodes/vertices of a complex network, while links dictate who interacts with whom. The structure reflects the existence of constraints that limit interactions between agents. These constraints can arise from spatial or communication limitations.
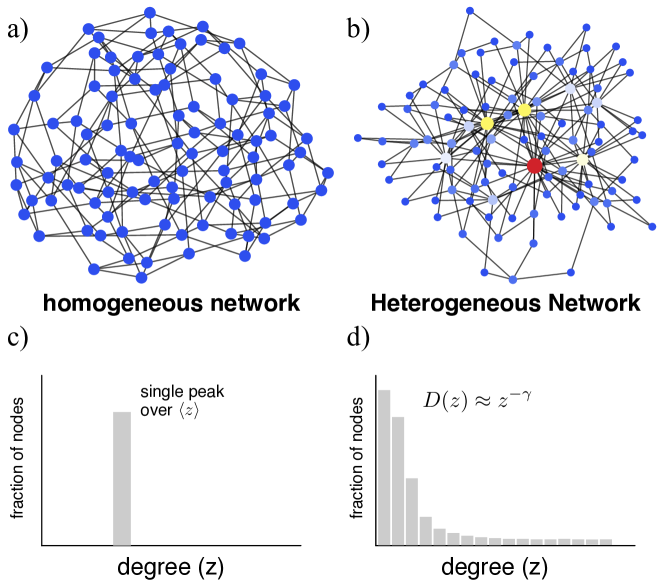
The number of interactions that each agent participates in defines his/her degree . The distribution of degrees, , describes the fraction of agents that has degree . In this work we consider two structures: Homogeneous Random Graphs Santos et al. (2005, 2017) and Scale-Free Barabási Networks Albert and Barabási (2002).
Homogeneous Random Graphs are generated by successively randomizing the ends of pairs of links from an initially regular graph (e.g. Lattice or Ring). The resulting structure has a random interaction structure but all nodes in the network have the same degree. Figure 2a) depicts graphically an example of such structures and Figure 2c) the corresponding Degree distribution.
Scale-free networks are generated by an algorithm of growth and preferential attachment Albert and Barabási (2002). This algorithm is as follows: 1) start from three fully connected nodes; 2) add, sequentially, each of the remaining nodes; 3) each time a new node is added, it connects to pre-existing nodes, selecting preferentially nodes with higher degree. Here we have used The resulting network is characterized by a heterogeneous degree distribution (one which decays as a power law), in which the majority of the nodes have few connections while a few have many. Figure 2b) shows a graphical example of such structure and Figure 2d) the degree distribution.
In the following we explore the case of networks with nodes and average degree of . During the simulations we make use of independently generated networks of each type.
3.5. Games on Networks
We study the expected level of cooperation attained by the population. We estimate this quantity through computer simulations. The level of cooperation corresponds to the expected fraction of cooperators in a population that evolved after iterations. We estimate this quantity by averaging the observed fraction of cooperators at the final of each simulation, over independent simulations.
Each simulation starts from a population with an equal composition of Cooperators and Defectors, which are randomly placed along the nodes of the network. In between each update round, each agent plays once with all his/her nearest neighbors (i.e., agents they are directly connected with). The accumulated payoff over all interactions an agent participates can be computed as
| (3) |
where () is the number of neighbors of that Defect (Cooperate) and is equal to 1 if is a Cooperator and 0 otherwise. From the accumulated payoff, agents contribute to a pool a fraction of the surplus . The fitness of an agent results from subtracting from his/her accumulated payoff his/her contributions plus the share he/she obtains from each of the Beneficiary Sets he/she participates in. We shall underline that, while is the same for all agents (that is, the dilemma is the same for everyone in the population), heterogeneous populations introduce an additional complexity layer by implying that different agents may vary in the maximum values of accumulated payoff that they are able to earn. This can be formalized as
| (4) |
where is equal to one if is part of the Beneficiary Set towards which contributes and zero otherwise, while denotes the size of set .
Evolution in the frequency of strategies adopted in the population happens through a process of imitation or social learning. At each iteration a random agent, say , compares his fitness with the fitness of a neighbor, say . Depending on the fitness difference, adopts the strategy of with probability
| (5) |
The meaning of this sigmoid function can be understood as follows: if is performing much better than , then updates his/her strategy, adopting the strategy of . Conversely, if is performing much worse, does not update the strategy. The parameter , often called the intensity of selection and akin to a learning rate, dictates how sharp is the transition between these two regimes, as approaches zero. Large means that individuals act in a more deterministic way, updating strategies at the minimum difference; small means that individuals are prone to make imitation mistakes.
4. Results
4.1. Wealth Redistribution and the Level of Cooperation in Structured Populations
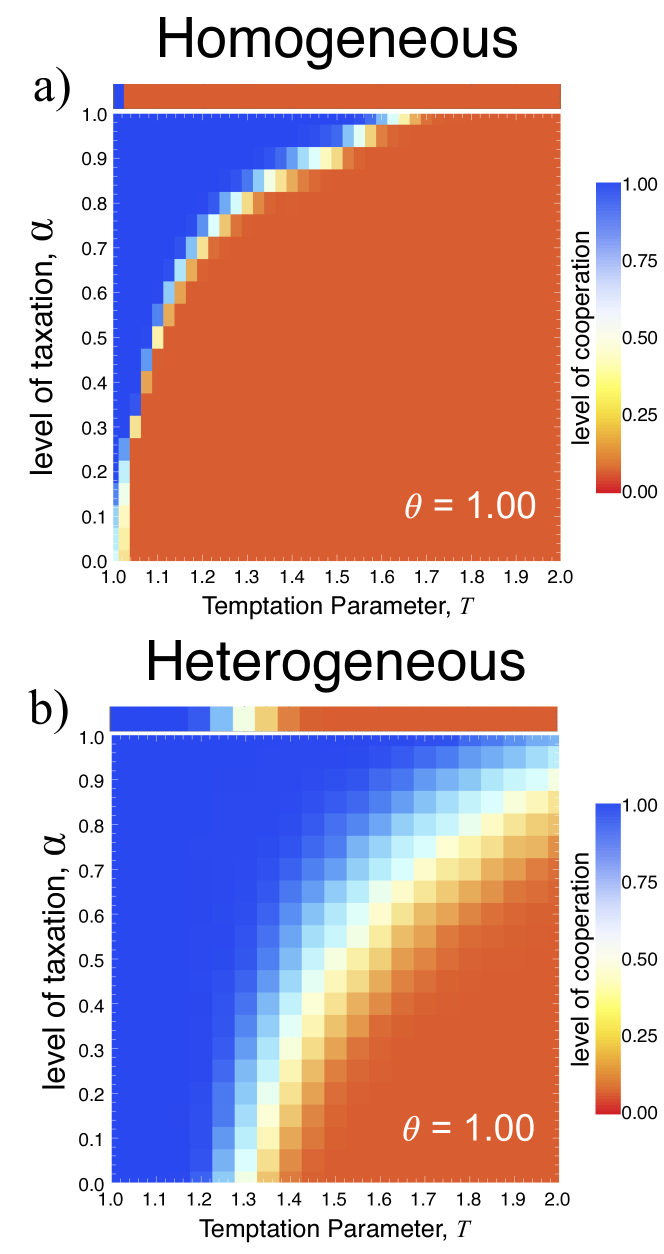
In this section we start by analyzing the scenario in which the Beneficiary Set of each agent corresponds to his/her nearest neighbors. Hence, the size of the Beneficiary set of is . These are also the agents from whom he/she interacts with and obtains a payoff from. Figure 3 shows the achieved levels of cooperation when the payoff threshold is set to , as a function of the Temptation payoff () and the level of taxation (). Figure 3a shows the results on Homogeneous networks, and Figure 3b on Heterogeneous. We find that, for a fixed payoff threshold (), increasing the level of taxation results in an increase in the levels of cooperation. This effect diminishes with an increase in the Temptation (). That is, when increasing the minimum value of necessary to promote cooperation increases as well. The same behavior is observed in both structures. However, there is a larger degree of cooperation on Heterogeneous networks, where there is always a level of taxation for a given Temptation that guarantees a 100 level of cooperation. Hence, in order for cooperation to be evolutionary viable on homogeneous networks, more stringent conditions are necessary, e.g. higher tax levels.
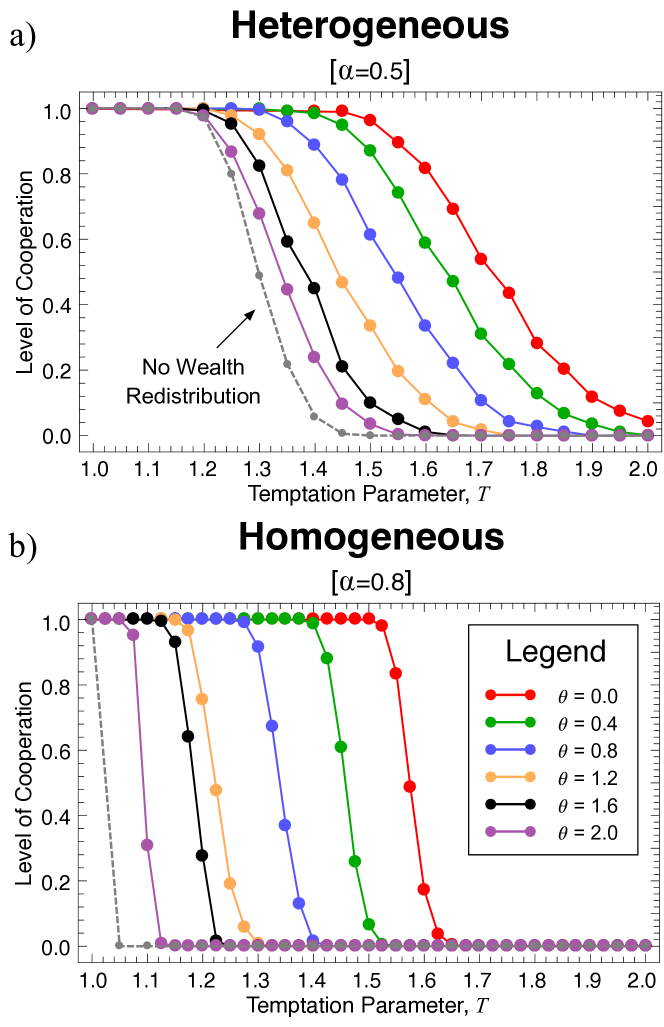
Figure 4 shows how the level of cooperation depends on variations of the fitness threshold (, in intervals of ) while keeping a fixed level of taxation () under different levels of the Temptation payoff (). Figure 4a shows the results obtained for Heterogeneous networks and panel b) the results on Homogeneous structures. For a constant level of taxation, , decreasing the payoff threshold, , increases the range of Temptation, , under which cooperation can possibly evolve. This is the case in both types of structures. However, once again, the effect is more limited in homogeneous populations.
Both Figure 3 and 4 highlight the positive impact of a local wealth redistribution mechanism in the enhancement of cooperation. It also puts in evidence that the success of such mechanism depends on the volume of payoff that is redistributed. Ultimately, this can be done by either increasing the level of taxation, or decreasing the payoff threshold, , that defines the taxable payoff.
4.2. Randomized Beneficiary Set
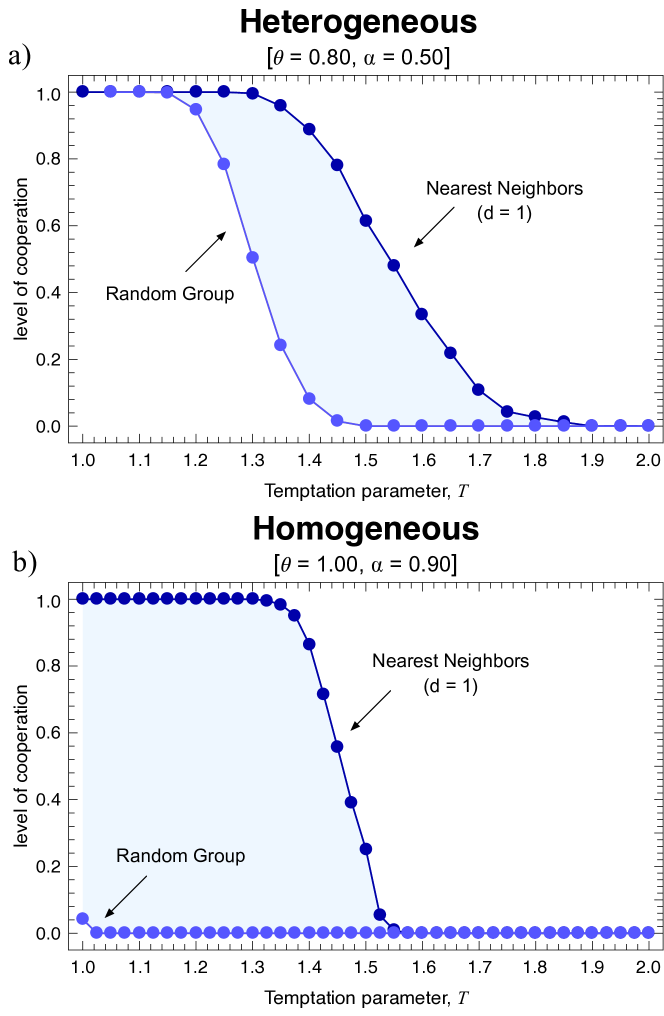
Next we explore to which extent the results obtained depend on the way agents are being assigned to each Beneficiary Set. To that end, we compare two cases: i) nearest set assignment – the Beneficiary Set of each agent corresponds to her/his nearest neighbors, as above; and ii) random set assignment – agents are assigned at random to each Beneficiary Set. The number of agents assigned to each set is equal to the degree of the contributing agent, in both cases, which guarantees that the collected payoffs from each agent are distributed among the same number of individuals in both i) and ii).
Figure 5a and b show the results obtained, respectively, on Heterogeneous and Homogeneous networks. We consider , and explore the domain . Dark blue curves show the results obtained under the nearest set assignment and light blue curves the results obtained under a random set assignment. The results show that the ability of a wealth redistribution mechanism lies in the redistribution of the taxed payoff among the agents that are spatially related. A random assignment of agents drastically decreases the levels of cooperation obtained in both networks. But to which extent do the Beneficiary Sets need to be constrained spatially?
4.3. Extended Beneficiary Set
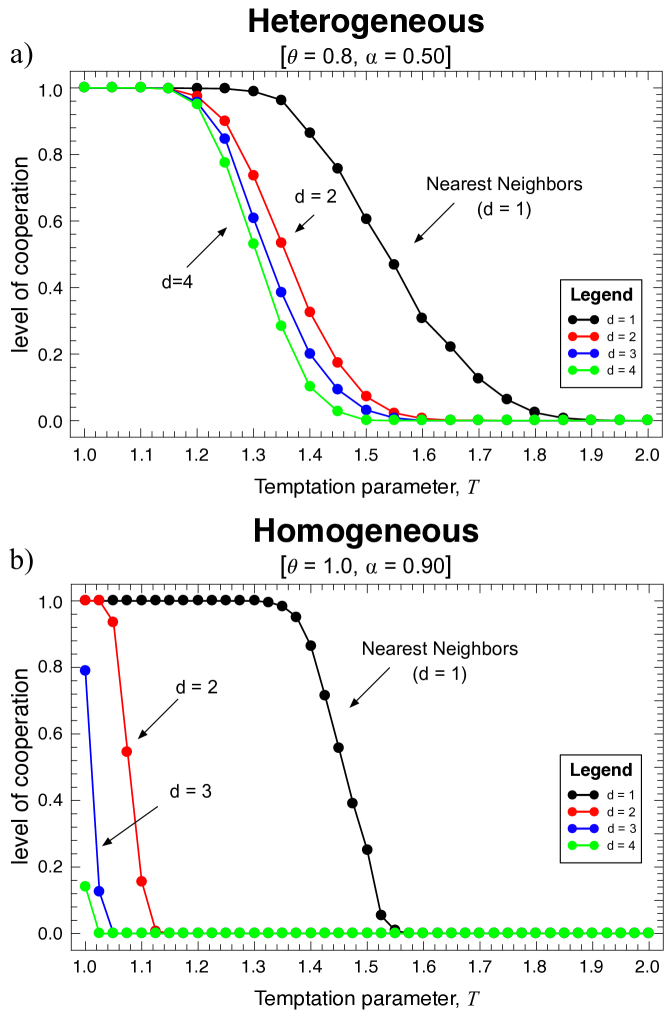
To answer the previous question, we explore the case in which all nodes (up to a distance of links) are assigned to the Beneficiary Set of a focal agent ; when the previous results are thereby obtained.
Figure 6a and b show the results up to on Heterogeneous and Homogeneous networks respectively. In both cases, we see that an expansion in the size of the Beneficiary Set leads to a decrease in the levels of cooperation. This result further reinforces the conclusion that wealth redistribution is only efficient when agents return, in form of taxes, a share of the accumulated payoffs to the agents they have engaged with. We shall underline that here both distance and size of play a role on the obtained results, while in the previous section the size of was kept constant for each across the different treatments, thus disambiguating the effect of size and distance on the resulting cooperation levels.
4.4. What is the cost of wealth redistribution?
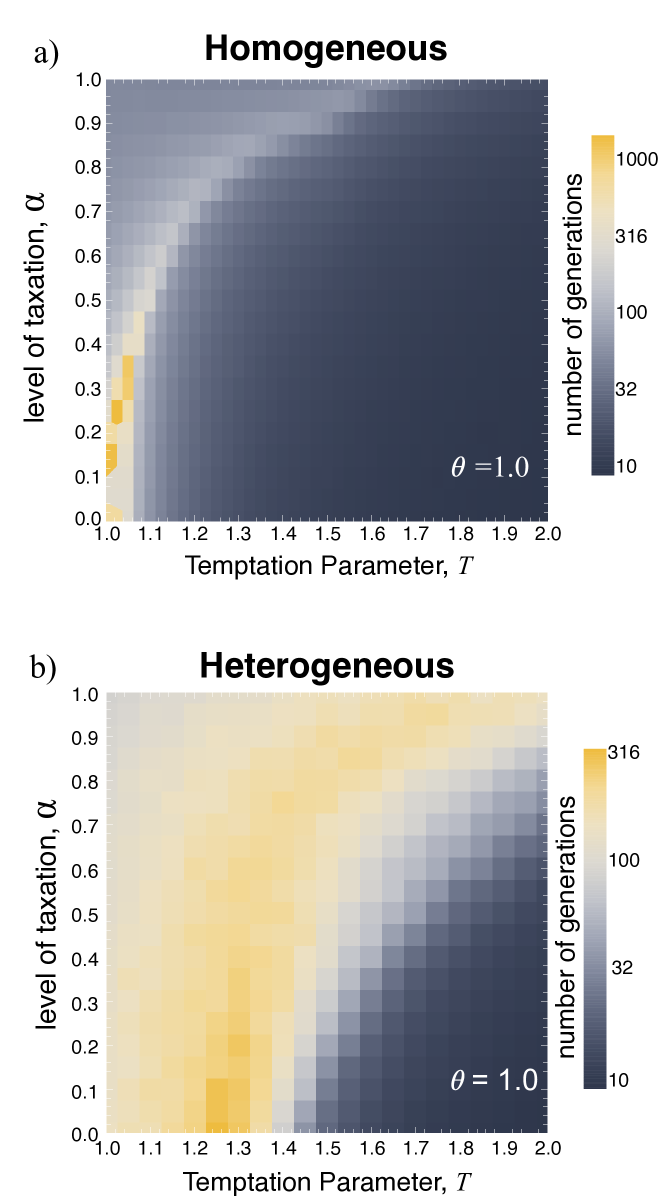
Figure 7a and b shows the fixation times of populations when along the domain bounded by and . The fixation times correspond to the expected number of generations (i.e., sets of potential imitation steps) for the population to reach a state in which only one strategy is present in the population. These plots map directly into Figure 3a and b, allowing to compare the relative fixation times of regions with high/low levels of cooperation.
We observe that the evolution of cooperation is associated with an increase in the fixation times. This increase can be in some situations an order of magnitude higher. The regions that exhibit larger fixation times lie in the critical boundary that divides areas of defectors and cooperators dominance (Figure 3). Hence, promoting cooperation by redistributing wealth also requires a longer waiting time for the population to reach a state of full cooperation. However, setting higher taxation values than the bare minimum necessary for the emergence of cooperation allows populations to reach fixation quicker.
4.5. Multiple Contribution Brackets
In the real world, taxes are unlikely to be defined by a single threshold () that separates agents who contribute from those that do not. In reality taxes are progressive, in the sense that taxation levels () increase with increasing level of income (in this case accumulated payoff). In this section we implement a similar approach and inspect the impact of increasing the number of taxation brackets.
Let us consider that, instead of a single threshold we now have taxation brackets divided by threshold levels. For each bracket we define as the effective tax and as the bottom threshold of bracket , where .
By definition corresponds to the case in which no taxes are collected, and the redistribution of wealth is absent. Moreover, , implies the existence of a single bracket were all individuals would contribute, a case that we do not explore in this manuscript. , corresponds to the case in which there are two brackets, which is the scenario that we have explored until now.
We consider the case in which taxation increases linearly with increasing brackets. Let us define . Individuals in bracket have their payoff surplus taxed by when their accumulated payoff falls into for . For the tax level is and affects all individuals with .
As an example, for each bracket would be characterized by the following tax levels
-
)
for all individuals with ;
-
)
for all individuals with ;
-
)
for all individuals with ;
-
)
for all individuals with .
In this way we use and as the upper level bound and only parameters in this condition.
We find that variations in the number of taxation brackets (=3,4,5) have only a marginal impact in the overall levels of cooperation observed when compared with the scenarios studied so far (=2).
4.6. Wealth Inequality
Finally, we discuss the effect of wealth redistribution on fitness inequality. First, it is important to highlight that the observed levels of inequality depend, by default, on the distribution of strategies and network degree. In homogeneous structures, if every agent adopts the same strategy – either Defectors or Cooperators – everyone obtains the same fitness. In heterogeneous structures, a Cooperation dominance scenario bounds the feasible equality levels, given the degree distribution of the population. In fact, some agents engage in more interactions than others and Beneficiary Sets have different sizes, depending on the particular connectivity of agents. We shall focus on this scenario.
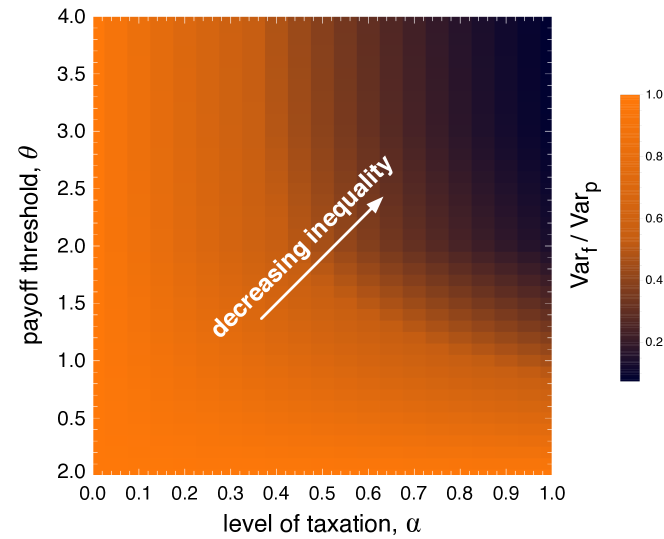
We compare the variance of fitness (i.e. gains after the redistribution step) and the variance of accumulated payoff (i.e. gains before the redistribution step) in order to quantify the relative inequality after we apply the proposed redistribution mechanism. In particular, we use the ratio between the variance of fitness and the variance of accumulated payoff as a metric of resulting wealth inequality.
Figure 8 shows how higher levels of and reduce the resulting inequality. In fact, while increasing payoff threshold limits taxation to the richer agents, increasing level of taxation increases the flow of fitness from rich agents to their Beneficiary Sets. In the most strict case – high and – the variance of the fitness distribution is reduced to as low as of the accumulated payoff distribution.
5. Conclusion
To sum up, we show that wealth redistribution embodies an effective mechanism that significantly helps cooperation to evolve. It works by fundamentally changing the nature of the dilemma at stake: by appropriately choosing the level of taxation () and payoff threshold () it is possible to shift from a Defector dominance to a Cooperator dominance dynamics. Moreover, we find that in Heterogeneous populations allow us to ease the redistribution mechanism – that is, imposing lower taxation rates and/or lower taxable surplus values when compared with Homogeneously structured populations.
Additionally, we show, for the first time, that different assignments of Beneficiary Sets significantly impact the ensuing levels of cooperation. Local Beneficiary Sets, where agents receive the contributions from their direct neighbors, constitute a judicious choice when compared with Beneficiary Sets that are formed by 1) agents randomly picked from the population or 2) by including agents at higher distances. Naturally, a Local wealth redistribution scheme may not only prove optimal in terms of achieved cooperation levels, but also reveal much simpler to implement, by exempting the need of central redistribution entities and by minimizing the number of peers that agents need to interact with. We shall highlight, however, that promoting cooperation through a wealth redistribution mechanism bears longer fixation times, in terms of the number of iterations required to achieve overall cooperation.
Here we assume that the redistribution mechanism is externally imposed. Agents are not able to opt out from the taxation scheme. Given that this mechanism increases the overall cooperation and average payoff in the system, an argument for its acceptance - by rational agents - can be formulated based on the infamous veil of ignorance proposed by John Rawls Rawls (2009): Agents should decide the kind of society they would like to live in without knowing their social position. Agents would, this way, prefer a cooperative society where redistribution exists, provided that here average payoff is maximized. Notwithstanding, future research shall analyze the role of more complex strategies that give opportunity of agents to voluntarily engage (or not) in the proposed redistribution scheme. Alongside, effective mechanisms that discourage the second order free riding problem (i.e., free riding by not contributing to the redistribution pot, while expecting others to do so) shall be examined. Future works shall also evaluate whether alternative taxation schemes are prone to be more efficient than the one proposed here. In all these cases, an evolutionary game theoretic framework – such as the one here developed – constitutes a promising toolkit to employ.
6. Acknowledgments
The authors acknowledge the useful discussions with Francisco C. Santos, Jorge M. Pacheco and Aamena Alshamsi. F.L.P. is thankful to the Media Lab Consortium for financial support. F.P.S. acknowledges the financial support of Fundação para a Ciência e Tecnologia (FCT) through PhD scholarship SFRH/BD/94736/2013, multi-annual funding of INESC-ID (UID/CEC/50021/2013) and grants PTDC/EEI-SII/5081/2014, PTDC/MAT/STA/3358/2014.
References
- (1)
- Airiau et al. (2014) Stéphane Airiau, Sandip Sen, and Daniel Villatoro. 2014. Emergence of conventions through social learning. Autonomous Agents and Multi-Agent Systems 28, 5 (2014), 779–804.
- Akyildiz et al. (2002) Ian F Akyildiz, Weilian Su, Yogesh Sankarasubramaniam, and Erdal Cayirci. 2002. Wireless sensor networks: a survey. Computer Networks 38, 4 (2002), 393–422.
- Albert and Barabási (2002) Réka Albert and Albert-László Barabási. 2002. Statistical mechanics of complex networks. Reviews of Modern Physics 74, 1 (2002), 47.
- Arcos et al. (2005) Josep Ll Arcos, Marc Esteva, Pablo Noriega, Juan A Rodríguez-Aguilar, and Carles Sierra. 2005. Engineering open environments with electronic institutions. Engineering Applications of Artificial Intelligence 18, 2 (2005), 191–204.
- Burguillo-Rial (2009) Juan C Burguillo-Rial. 2009. A memetic framework for describing and simulating spatial prisoner’s dilemma with coalition formation. In Proceedings of AAAI’09. AAAI Press, 441–448.
- Endriss and Maudet (2003) Ulle Endriss and Nicolas Maudet. 2003. Welfare engineering in multiagent systems. In International Workshop on Engineering Societies in the Agents World. Springer, 93–106.
- Ephrati and Rosenschein (1996) Eithan Ephrati and Jeffrey S Rosenschein. 1996. Deriving consensus in multiagent systems. Artificial Intelligence 87, 1-2 (1996), 21–74.
- Esteva et al. (2004) Marc Esteva, Bruno Rosell, Juan A Rodriguez-Aguilar, and Josep Ll Arcos. 2004. AMELI: An agent-based middleware for electronic institutions. In Proceedings of the Third International Joint Conference on Autonomous Agents and Multiagent Systems. IEEE Computer Society, 236–243.
- Feldman and Chuang (2005) Michal Feldman and John Chuang. 2005. Overcoming free-riding behavior in peer-to-peer systems. ACM SIGecom Exchanges 5, 4 (2005), 41–50.
- Genesereth et al. (1986) Michael R Genesereth, Matthew L Ginsberg, and Jeffrey S Rosenschein. 1986. Cooperation without communication. In Proceedings of AAAI’86. AAAI Press.
- Golle et al. (2001) Philippe Golle, Kevin Leyton-Brown, Ilya Mironov, and Mark Lillibridge. 2001. Incentives for sharing in peer-to-peer networks. In Electronic Commerce. Springer, 75–87.
- Griffiths (2008) Nathan Griffiths. 2008. Tags and image scoring for robust cooperation. In Proceedings of the 2008 International Conference on Autonomous Agents and Multi-agent Systems. International Foundation for Autonomous Agents and Multiagent Systems, 575–582.
- Hamilton (1964) William D Hamilton. 1964. The genetical evolution of social behaviour. Journal of Theoretical Biology 7, 1 (1964), 17–52.
- Han (2016) TA Han. 2016. Emergence of Social Punishment and Cooperation through Prior Commitments. In Proceedings of AAAI’16. AAAI Press, 2494–2500.
- Han et al. (2017) TA Han, Luís Moniz Pereira, Luis A Martinez-Vaquero, and Tom Lenaerts. 2017. Centralized vs. Personalized Commitments and their influence on Cooperation in Group Interactions. In Proceedings of AAAI’17. AAAI Press.
- Ho et al. (2012) Chien-Ju Ho, Yu Zhang, Jennifer Vaughan, and Mihaela Van Der Schaar. 2012. Towards social norm design for crowdsourcing markets. In AAAI’12 Technical Report WS-12-08. AAAI Press.
- Hofmann et al. (2011) Lisa-Maria Hofmann, Nilanjan Chakraborty, and Katia Sycara. 2011. The evolution of cooperation in self-interested agent societies: a critical study. In Proceedings of the 2011 International Conference on Autonomous Agents and Multi-agent Systems. International Foundation for Autonomous Agents and Multiagent Systems, 685–692.
- Ichinose et al. (2017) Genki Ichinose, Yoshiki Satotani, and Hiroki Sayama. 2017. How mutation alters fitness of cooperation in networked evolutionary games. arXiv preprint arXiv:1706.03013 (2017).
- Jennings et al. (1998) Nicholas R Jennings, Katia Sycara, and Michael Wooldridge. 1998. A roadmap of agent research and development. Autonomous Agents and Multi-agent Systems 1, 1 (1998), 7–38.
- Kurka and Pitt (2016) David Burth Kurka and Jeremy Pitt. 2016. Distributed distributive justice. In Self-Adaptive and Self-Organizing Systems (SASO), 2016 IEEE 10th International Conference on. IEEE, 80–89.
- Macy and Flache (2002) Michael W Macy and Andreas Flache. 2002. Learning dynamics in social dilemmas. Proceedings of the National Academy of Sciences 99 (2002), 7229–7236.
- Nowak (2006) Martin A Nowak. 2006. Five rules for the evolution of cooperation. Science 314, 5805 (2006), 1560–1563.
- Nowak (2012) Martin A Nowak. 2012. Evolving cooperation. Journal of Theoretical Biology 299 (2012), 1–8.
- Nowak and May (1992) Martin A Nowak and Robert M May. 1992. Evolutionary games and spatial chaos. Nature 359, 6398 (1992), 826–829.
- Nowak and Sigmund (2005) Martin A Nowak and Karl Sigmund. 2005. Evolution of indirect reciprocity. Nature (2005).
- Ohtsuki et al. (2006) Hisashi Ohtsuki, Christoph Hauert, Erez Lieberman, and Martin A Nowak. 2006. A simple rule for the evolution of cooperation on graphs. Nature 441, 7092 (2006), 502.
- Ostrom (2015) Elinor Ostrom. 2015. Governing the commons. Cambridge University Press.
- Panait and Luke (2005) Liviu Panait and Sean Luke. 2005. Cooperative multi-agent learning: The state of the art. Autonomous Agents and Multi-agent Systems 11, 3 (2005), 387–434.
- Peleteiro et al. (2014) Ana Peleteiro, Juan C Burguillo, and Siang Yew Chong. 2014. Exploring indirect reciprocity in complex networks using coalitions and rewiring. In Proceedings of the 2014 International Conference on Autonomous Agents and Multi-agent Systems. International Foundation for Autonomous Agents and Multiagent Systems, 669–676.
- Pinheiro and Hartmann (2017) Flávio L. Pinheiro and Dominik Hartmann. 2017. Intermediate Levels of Network Heterogeneity Provide the Best Evolutionary Outcomes. Scientific Reports 7, 1 (2017), 15242.
- Pinheiro et al. (2012) Flavio L Pinheiro, Jorge M Pacheco, and Francisco C Santos. 2012. From local to global dilemmas in social networks. PloS ONE 7, 2 (2012), e32114.
- Pinheiro et al. (2016) Flávio L Pinheiro, Francisco C Santos, and Jorge M Pacheco. 2016. Linking individual and collective behavior in adaptive social networks. Physical Review Letters 116, 12 (2016), 128702.
- Pitt et al. (2012) Jeremy Pitt, Julia Schaumeier, Didac Busquets, and Sam Macbeth. 2012. Self-organising common-pool resource allocation and canons of distributive justice. In Self-Adaptive and Self-Organizing Systems (SASO), 2012 IEEE Sixth International Conference on. IEEE, 119–128.
- Ranjbar-Sahraei et al. (2014) Bijan Ranjbar-Sahraei, Haitham Bou Ammar, Daan Bloembergen, Karl Tuyls, and Gerhard Weiss. 2014. Theory of cooperation in complex social networks. In Proceedings of AAAI’14. AAAI Press.
- Rawls (2009) John Rawls. 2009. A theory of justice. Harvard University Press.
- Rendell et al. (2010) Luke Rendell, Robert Boyd, Daniel Cownden, Marquist Enquist, Kimmo Eriksson, Marc W Feldman, Laurel Fogarty, Stefano Ghirlanda, Timothy Lillicrap, and Kevin N Laland. 2010. Why copy others? Insights from the social learning strategies tournament. Science 328, 5975 (2010), 208–213.
- Salazar et al. (2011) Norman Salazar, Juan A Rodriguez-Aguilar, Josep Ll Arcos, Ana Peleteiro, and Juan C Burguillo-Rial. 2011. Emerging cooperation on complex networks. In Proceedings of the 2011 International Conference on Autonomous Agents and Multi-agent Systems. International Foundation for Autonomous Agents and Multiagent Systems, 669–676.
- Santos and Pacheco (2005) Francisco C Santos and Jorge M Pacheco. 2005. Scale-free networks provide a unifying framework for the emergence of cooperation. Physical Review Letters 95, 9 (2005), 098104.
- Santos et al. (2006) Francisco C Santos, Jorge M Pacheco, and Tom Lenaerts. 2006. Cooperation prevails when individuals adjust their social ties. PLoS Computational Biology 2, 10 (2006), e140.
- Santos et al. (2005) Francisco C Santos, JF Rodrigues, and Jorge M Pacheco. 2005. Epidemic spreading and cooperation dynamics on homogeneous small-world networks. Physical Review E 72, 5 (2005), 056128.
- Santos et al. (2017) Fernando P Santos, Jorge M Pacheco, Ana Paiva, and Francisco C Santos. 2017. Structural power and the evolution of collective fairness in social networks. PloS ONE 12, 4 (2017), e0175687.
- Santos et al. (2018) Fernando P. Santos, Jorge M. Pacheco, and Francisco C. Santos. 2018. Social norms of cooperation with costly reputation building. In AAAI’18. AAAI Press.
- Seuken et al. (2010) Sven Seuken, Jie Tang, and David C Parkes. 2010. Accounting Mechanisms for Distributed Work Systems. In AAAI’10. AAAI Press.
- Sigmund (2010) Karl Sigmund. 2010. The calculus of selfishness. Princeton University Press.
- Trivers (1971) Robert L Trivers. 1971. The evolution of reciprocal altruism. The Quarterly Review of Biology 46, 1 (1971), 35–57.
- Vasconcelos et al. (2015) Vítor V Vasconcelos, Francisco C Santos, and Jorge M Pacheco. 2015. Cooperation dynamics of polycentric climate governance. Mathematical Models and Methods in Applied Sciences 25, 13 (2015), 2503–2517.
- Waibel et al. (2011) Markus Waibel, Dario Floreano, and Laurent Keller. 2011. A quantitative test of Hamilton’s rule for the evolution of altruism. PLoS Biology 9, 5 (2011), e1000615.