On-Orbit Performance of the Helioseismic and Magnetic Imager Instrument onboard the Solar Dynamics Observatory
Abstract
The Helioseismic and Magnetic Imager (HMI) instrument is a major component of NASA’s Solar Dynamics Observatory (SDO) spacecraft. Since commencement of full regular science operations on 1 May 2010, HMI has operated with remarkable continuity, e.g. during the more than five years of the SDO prime mission that ended 30 September 2015, HMI collected 98.4 % of all possible 45-second velocity maps; minimizing gaps in these full-disk Dopplergrams is crucial for helioseismology. HMI velocity, intensity, and magnetic-field measurements are used in numerous investigations, so understanding the quality of the data is important. This article describes the calibration measurements used to track the performance of the HMI instrument, and it details trends in important instrument parameters during the prime mission. Regular calibration sequences provide information used to improve and update the calibration of HMI data. The set-point temperature of the instrument front window and optical bench is adjusted regularly to maintain instrument focus, and changes in the temperature-control scheme have been made to improve stability in the observable quantities. The exposure time has been changed to compensate for a 15 % decrease in instrument throughput. Measurements of the performance of the shutter and tuning mechanisms show that they are aging as expected and continue to perform according to specification. Parameters of the tunable-optical-filter elements are regularly adjusted to account for drifts in the central wavelength. Frequent measurements of changing CCD-camera characteristics, such as gain and flat field, are used to calibrate the observations. Infrequent expected events, such as eclipses, transits, and spacecraft off-points interrupt regular instrument operations and provide the opportunity to perform additional calibration. Onboard instrument anomalies are rare and seem to occur quite uniformly in time. The instrument continues to perform very well.
keywords:
Instrumentation and Data Management; Instrumental Effects; Velocity Fields, Photosphere; Magnetic fields, Photosphere;1 Introduction
sec:intro
The Solar Dynamics Observatory (SDO) with the Helioseismic and Magnetic Imager (HMI) instrument onboard was launched 11 February 2010 to provide the observations necessary to understand the sources of solar variability and its impact on the terrestrial environment (Pesnell, Thompson, and Chamberlin, 2012; Scherrer et al., 2012). Since 1 May 2010, HMI has observed the full disk of the Sun almost continuously to measure the velocity, intensity, and magnetic field in the photosphere (Schou et al., 2012a). As of October 2016, nearly 1100 refereed articles had made use of HMI data. This article describes how the instrument has performed.
HMI operates using two CCD cameras to take sequences of polarized filtergrams of the photosphere. The full-disk images, tuned to six wavelengths across the Fe i 6173.3433 Å spectral line in each of six polarization states, are downlinked and combined to determine the basic HMI observable quantities: Doppler velocity, line-of-sight magnetic field, line width, line depth, continuum intensity, and the Stokes polarization parameters (Couvidat et al., 2016). More advanced products computed from those observables include vector magnetograms (Hoeksema et al., 2014) and subsurface-flow maps (Zhao et al., 2012).
1.1 HMI Filtergram Data Processing and Calibration
SDO data are collected continuously at a ground station in White Sands, New Mexico, and the HMI and Atmospheric Imaging Assembly (AIA) housekeeping and science-data telemetry packets are transfered in near real time to the Joint Science Operations Center (JSOC) Science Data Processing facility at Stanford University. The HMI processing pipeline produces several levels of data products from the incoming 55 megabit-per-second data stream.
The raw HMI bit stream is initially converted into Level-0 images (Lev0), and all of the relevant metadata are extracted.
Image-specific calibrations are applied during the creation of the Level-1 filtergrams. One of the main objectives of this article is to describe those calibrations and the on-orbit measurements made to enable them. CCD overscan rows and columns (extra values returned for pixels that are not part of the image) are removed from the imagest this stage, the CCD dark current is subtracted, and a flat field is applied. A limb-finder algorithm estimates the Sun-center location and the solar radius of each image. Another software module is applied to detect cosmic-ray hits and identify bad pixels. The resulting polarized filtergram images, with their lists of bad pixels, are termed Level-1 data (Lev1).
Other corrections (for image distortion, wavelength differences, and polarization cross talk) are made later, at the point when filtergrams are combined during the computation of the scientific observables as described by Couvidat et al. (2016). However, the calibration observations that enable those calibrations are described here.
Initial calibrations of HMI were carried out before launch to assess the performance of the wavelength-filter system (Couvidat et al., 2012b), polarization system (Schou et al., 2012b), and imaging optics (Wachter et al., 2012). Here we detail how the instrument has been operated, monitored, calibrated, and adjusted since launch. Schou et al. (2012a), Couvidat et al. (2012a), and Couvidat et al. (2016) describe the HMI data processing required to compute the observable quantities from the filtergrams. Additional systematic calibration issues determined after launch are addressed by Liu et al. (2012) (line-of-sight magnetic field), Hoeksema et al. (2014) and Bobra et al. (2014) (vector magnetic field), and Kuhn et al. (2012) (limb shape).
1.2 Overall HMI Data Recovery
An important requirement for HMI is high observing continuity, the strongest driver being the need for precise determination of solar-oscillation frequencies for helioseismology.
After two and a half months of commissioning, the HMI instrument formally began full science operations on 1 May 2010, although some data products are available prior to that date. Since then HMI has operated almost continuously. Most interruptions are either planned, in order to accommodate spacecraft operations and calibrations, or due to unavoidable seasonal eclipses that are a consequence of the SDO geosynchronous orbit.
HMI acquired more than 112 million images from 1 May 2010 to 31 December 2016. Table \ireftable:lev0_statistics reports the total number of Level-0 images, as well as the numbers of 4K 4K images that are missing or partially recovered. Images deliberately not collected during the dark phase of eclipses are not reported as missing in the table. About 1.19 % of the images were taken with the Image Stabilization System (ISS) turned off during some spacecraft maneuvers and around the time of eclipses.
| Parameter | Number of Images | Percentage |
|---|---|---|
| Total HMI Exposures | 112,043,265 | |
| Missing Images | 61,563 | 0.055 % |
| Partial Images | 23,698 | 0.021 % |
A more relevant statistic may be the number of Dopplergrams recovered during the mission. Dopplergrams, one of the prime HMI observables, are computed every 45 seconds using filtergrams obtained by one of the two HMI cameras. This camera is variously referred to as the front camera, the Doppler camera, or Camera 2. The other camera is called the side camera, vector camera, or Camera 1. As shown in Table \ireftable:dopplergram_recovery, more than 98 % of all possible Dopplergrams have been recovered during the first five years of the mission. An overall assessment of the quality of each Dopplergram appears in the QUALITY keyword. A zero value for QUALITY indicates that there are no known issues with the data; these are reported as good in Table \ireftable:dopplergram_recovery. In fact all HMI data products at every processing level include a QUALITY assessment. Each bit in the QUALITY keyword indicates an issue that might affect the data. The top bit indicates the data are missing and other non-zero bits indicate lesser quality or explain why data are not present. This is discussed further in Section \irefsec:Quality and detailed in Appendix \irefsec:Lev0Qual, \irefsec:Lev1Qual, and \irefsec:S_ObsQual. Because sensitivity to various subtle differences in the data collection and processing vary depending on the analysis, the instrument conditions, data-processing details, calibration-procedure versions, and a host of other quantities are all available in keywords.
Table \ireftable:72day_recovery in Appendix \irefsec:Appendix1 provides details of the Dopplergram recovery rate for each of the first 37 72-day intervals. The lowest percentages ordinarily occur during eclipse seasons in Spring and Fall. The lowest was 96.45 % in June–August 2016. The highest was 99.87 % in November 2016–January 2017.
| Parameter | Value | Fraction |
|---|---|---|
| Possible 45s Time Slots | 4,679,040 | 100.0 % |
| Good Dopplergrams | 4,505,062 | 96.28 % |
| Lower-Quality Dopplergrams | 95,484 | 2.04 % |
| Missing Dopplergrams | 78,494 | 1.68 % |
Figure \ireffigure:dopplergram_recovery shows the percentage of the 1920 possible 45-second Dopplergrams recovered each day. Most days are nearly perfect; only 321 had less than 95 % recovery. The semi-annual eclipse seasons can be seen as U-shaped dips to below 95 % that extend over a couple weeks each Spring and Fall when the Earth comes between the spacecraft and the Sun for up to 72 minutes each day. Gaps that can last as long as several hours occur regularly on a few days each quarter when spacecraft operations are scheduled. Occasional dips are deeper when there are special calibrations. On a few occasions there have been instrument or spacecraft anomalies that have taken longer to recover from. Section \irefsec:eventsanomalies provides more information about such events.

1.3 Outline
The purpose of this article is to explain the observations used to calibrate the HMI filtergrams and to characterize the basic performance of the HMI instrument after launch and how it changes with time. This includes consideration of quantities such as throughput, focus, wavelength, and overall data capture, as well as trends in important instrument parameters, such as camera operation, shutter and tuning-motor performance, and subsystem temperatures.
Section \irefsec:calibobs describes the routine calibration observations made in order to monitor and optimize the operation of the instrument. Section \irefsec:trending explains various measurements that show how the instrument has changed over time or responded to events. Section \irefsec:opticsfilters addresses the calibration of the optics and filter systems. In Section \irefsec:level1 we describe the Level-1 processing that produces calibrated filtergrams from Level-0 images, principally the calibrations related to the CCD cameras (flat fields and bad pixels) but also single-pixel corrections for transient problems, such as those caused by cosmic rays. This section also summarizes how characteristics of the image and information about the processing are documented in keywords and encoded in the bits of the QUALITY and CALVER keywords. The implications of events (such as the semiannual eclipses) and occasonal onboard anomalies are covered in Section \irefsec:eventsanomalies. Section \irefsec:conclusion gives a summary and discussion of HMI performance. Appendices provide an additional level of detail about observing sequences used for both primary observing and for calibrations as well as annotated descriptions of more of the keywords for Level-0 and Level-1 filtergrams.
2 On-Orbit Calibration Observations
sec:calibobs
A variety of calibration observations are taken on a regular basis to monitor the evolution of the HMI instrument and maintain optimal performance. This section describes the daily, weekly, bi-weekly, and occasional calibration sequences.
HMI acquires data using a Framelist Timeline Specification (FTS), or framelist. The FTS defines the filter tuning, polarization state, focus, and timing of each filtergram to be executed in a sequence. The FTS ID is stored in the Level-0 and Level-1 keyword HFTSACID. A roster of the most common frame lists appears in a table in Appendix \irefsec:MainSequences; more complete listings are provided in Appendix \irefsec:FTSTables. The FTS IDs for standard calibration sequences are indicated.
Standard HMI observations were initially obtained with a framelist called Mod C that repeated every 135 seconds. Mod L, a 90-second FTS, replaced Mod C on 13 April 2016. The two versions of Mod C have FTS ID 1001 or 1021; the Mod L HFTSACID is 1022. Some calibration framelists changed when the standard sequences changed.
2.1 Twice-Daily Calibration Sequences
Twice a day, starting at 06 UT and 18 UT, the regular observing sequence is interrupted to run a calibration that includes eight non-standard filtergrams. At these times, near local Noon and Midnight in the orbit, the spacecraft is close to zero radial velocity with respect to the Sun (the exact time varies throughout the year). The sequence consists of four (nearly) true continuum images (tuned such that the filter pass bands are about 344 mÅ away from the Fe i line center at rest) taken in two different polarizations, two Calmode images (that is, images taken with the instrument completely defocused in calibration mode), and two dark frames. The continuum frames are not used for calibration purposes but have been used for some scientific investigations. The Calmode images are used to track the evolution of the throughput of the optical system; the dark images are used to create mean dark frames four times a year (see \irefsec:level1). The normal line-of-sight observing sequence in Camera 2 is minimally disturbed. During mod-C (135-second cadence) operations, the FTS ID was 2021; under current mod-L operations the FTS ID is 2042.
2.2 Weekly Focus Sweeps and PZT Offpoints
Additional calibration sequences are run every week, typically on Tuesdays and Wednesdays around 19:00 UT, although they are sometimes rescheduled or canceled due to conflicts with other events.
Once per week a focus sweep is taken to determine the instrument’s best focus. Two different sequences are used, run on alternate weeks: a full sweep that takes continuum-tuned images at all HMI focus positions (FTS ID 3020, 3040) and a reduced sweep that only uses the seven focus positions around the best-focus position (FTS ID 3023, 3043). The calibration images are processed to determine the focus-block setting that results in the highest image contrast and therefore the optimal focus. Results from these weekly measurements are used to adjust the front-window temperatures to maintain best focus as consistently as possible. The mission-long HMI focus-trend plot for the front camera is presented in the upper panel of Figure \ireffigure:best_focus. The lower panel shows the difference between best-focus position for the front and side cameras. The focus is measured in units of focus steps that are equivalent to 1.04 mm at the CCD camera, about 2/3 of one depth of field.

The focus of the two cameras is not identical because of differences in the two light paths. The causes of the relative drift of about 0.03 focus steps over the course of the mission is not fully understood, but could be due to a small (30 micron) change in the relative positions of the CCD detectors due to thermal expansion of the optics package.
Another set of calibration images are taken with the Sun deliberately driven off-center using the Image Stabilization System (ISS). Rather than operating with the normal closed-loop control, the piezo-electric transducers (PZTs) on the guide mirror are driven in a pre-set pattern to move the solar image around on the CCDs. The purpose of these observations is to measure the flat field of each CCD (FTS ID 3021, 3022, 3041, 3042). This is described further in Section \irefsec:Flatfield.
2.3 Bi-weekly Detune Sequence
sec:Detune
Every other week a 60-frame detune sequence is taken to monitor changes in the instrument wavelength-tuning positions and to update the filter-transmission profiles. For the first three months of the regular mission the detune sequence was run weekly. In this sequence the filter elements are deliberately not co-tuned, i.e. they are tuned to a series of 54 different wavelength combinations. The detunes are used to monitor the wavelength drift of the tunable elements. The sequence is taken in calibration mode (Calmode). In Calmode the entrance pupil of the telescope is imaged on the CCDs. The Calmode detunes have been used to determine profiles for the entire duration of the mission. Six dark frames are also collected. The results of these detunes and the periodic adjustments to the best tuning are discussed in Section \irefsec:Tuning. The current FTS ID of this sequence is 3027.
2.4 Occasional Calibrations
sec:Occasional
Other calibrations are performed on a less regular basis during spacecraft maneuvers that interrupt regular science observations, but provide opportunities to operate the instrument in a unique and useful mode. These include times when SDO is deliberately pointed away from the Sun (offpoints) and times when the spacecraft is rolled from its normal orientation with respect to the solar rotation axis (rolls).
2.4.1 Offpoint Flat Fields
sec:Offpoint
Spacecraft offpoint maneuvers are used by all three instruments on SDO for various calibrations. While some procedures are not useful for HMI calibration, quarterly offpoints are used to generate better flat fields. Twenty-two pointings are used, and HMI takes a sequence of continuum-tuned images at a single polarization with a set of varying focus positions. The offpoint flat fields are discussed in more detail in Section \irefsec:Flatfield. The current FTS ID for offpoint flat fields is 4031.
2.4.2 Roll Calibrations
sec:Rolls
Roll maneuvers are ordinarily performed twice per year, typically after the eclipse seasons in April and October, when the SDO spacecraft is rotated around the Sun–spacecraft line. The spacecraft pauses every for approximately twelve minutes. When rolled, the light rays from parts of the solar disk having different rotational velocities take different paths through the instrument filters. This allows us to calibrate the wavelength dependence of the filters (Couvidat et al., 2016). Data taken during these rolls can be also used for (among other things) measuring optical distortion and the shape of the Sun’s limb (e.g. Kuhn et al., 2012).
Additional roll angles were measured during commissioning in April 2010. A special roll calibration was performed on 23 – 24 March 2016 when SDO was rolled 180∘ from its normal orientation for twenty-four hours. During this interval HMI took detunes every three hours in both normal focus (Obsmode) and completely defocused (Calmode). The FTS IDs for these detunes are 3086 and 3087. The same sets of detunes were taken with the spacecraft in the normal orientation the day before. Analysis verified that the Lyot and Michelson filter-element details (as well as daily temperature variations of the front window) contribute to the 24-hour calibration variations.
2.4.3 Other Special Calibrations
sec:OtherCal
SDO has observed two planetary transits since the beginning of the prime mission: one of Venus and one of Mercury. These transits are useful for calibrating the instrument roll angle, point spread function, and distortion correction (Couvidat et al., 2016). During each transit a non-standard observing sequence was run. The line-of-sight observables, taken from the front camera, were produced as normal, but the side camera took continuum-tuned filtergrams in four polarization states for the Venus transit and one polarization for the Mercury transit. The FTS IDs for Venus and Mercury were 4035 and 4039, respectively.
3 Trending
sec:trending
It is essential to track the evolution of environmental conditions impacting the HMI observables. This helps with the early detection of problems, characterization of instrument changes and degradation, and the adjustment of the data calibration to maintain the best observables quality possible. Temperatures and voltages are monitored continuously by an autonomous system, and SDO staff are alerted if specified limits are reached. In addition, personnel check the values and trends of various components of the system several times each day to look for odd behavior or to spot problems before they reach cautionary limits. The first two subsections focus primarily on long-term temperatures trends measured in the instrument over the course of the mission and on typical daily variations observed during the month of July 2015. The final subsection explains how the plate scale varies in response to temperature changes and how instrument calibration is affected by it.
3.1 Long-term Instrument Temperature Trends
sec:Temperature
Numerous temperature sensors placed throughout the instrument monitor HMI’s response to every aspect of its thermal environment (see Appendix B and supplementary material in Schou et al., 2012a, for thermistor locations). Figure \ireffigure:hmi_temps_mission shows temperatures at six representative locations in the instrument. Three-hour samples of thirty-minute averages of quantities measured every eight seconds highlight long-term variations. The six locations illustrate the variations of different subsystems with varying levels of themal control: the front door, the mounting ring of the front window, the front-camera electronics box (CEB), the front CCD, the optical bench, and the filter oven. The front window and last three have the greatest measurable impact on the observables.
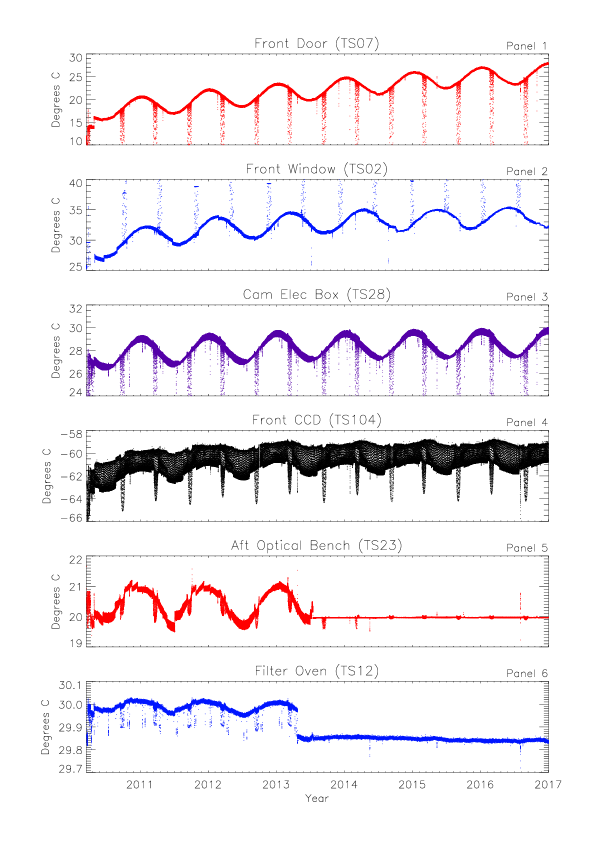
The top panel shows the temperature of the front door from 1 March 2010 through the end of 2016. The front door is outside the optics package and its temperature is essentially uncontrolled, except that it is in thermal contact with other controlled parts of the instrument. There is a jump just before the start of the prime mission in early 2010 when the initial operating temperature was set. The most obvious features are the regular annual variation of about 4 K due to the change in Sun–SDO distance and transient decreases during the twice-annual SDO eclipse season. The instrument was designed to operate near room temperature. The equilibrium temperature has increased by about 9 K since the start of the mission. This is due to changes in reflectance / absorbtion of the front-door surface and to deliberate temperature changes in the nearby front window (see discussion in Section \irefsec:Platescale.
The temperature at the bottom of the front-window mounting ring (Temperature Sensor 02, TS02), shown in Panel 2, is not directly controlled; instead, the thermistor is attached to the edge of the front window opposite the sensor used to control the temperature. The front-window temperature has been allowed to increase by about 5 K since 2010 in order to keep the focus of the instrument constant. Unlike most other locations, the front-window temperature increases during eclipses because the heaters are turned up to keep thermal gradients in the front window small so that the post-eclipse recovery is shortened (Section \irefsec:eclipses).
The front-camera electonics box (CEB, TS28 in Panel 3) is mounted on the front of the HMI optics package. It too shows variations with annual periodicity (about 3 K) and exhibits short strong dips during eclipses (third panel). The temperature runs a little hotter than most of the optics package because the camera electronics generate heat that is not fully dissapated by its own dedicated radiator. The average CEB temperature increases a couple degrees in the first two years, but has been relatively stable thereafter. Shorter-term 24-hour variability is discussed in the next section.
Each CCD detector has its own large radiator on the outboard surface of the instrument that is sheltered from direct solar radiation; it faces solar South (perpendicular to the Sun–spacecraft line) and has a nearly unobstructed view of cold space, except for the Earth. The CCD temperature is kept very low to minimize dark current. The fourth panel shows the temperature at the front CCD detector (TS104, determined from averages of temperature readings made every 16 seconds). The annual variation in temperature is smaller; shorter-term variations dominate. Couvidat et al. (2016) determined an intensity sensitivity of 0.25 % per degree.
Panel 5 shows a temperature measured on the optical bench inside the optics package (TS23). During the first three years of operation, the temperature was controlled by specifying a specific power input from the internal heaters. The constant overall duty cycle of the heaters was occasionally adjusted, but there was no active on-board control. Consequently the temperature varied with the overall equilibrium temperature of the instrument and an annual variation of about 1 K was apparent. On 16 July 2013 the scheme was changed to turn the heaters on at a specified duty cycle only when the temperature goes below a set minimum. Subsequently the temperature variation has been greatly reduced, and even the response to eclipses has significantly diminished. A consequence of this is discussed in Section \irefsec:Platescale.
The bottom panel of Figure \ireffigure:hmi_temps_mission shows the temperature measured on the outside of the tightly controlled filter oven. The oven is kept warmer than the rest of the optics package so that its temperature can be more precisely controlled. The specification for thermal control of the filters is 0.01 K per hour. While the specification is more than met within the oven, an annual peak-to-peak variation of about 0.05 K remained at the externally mounted sensor. On 20 April 2013 the HMI processor was rebooted for the first time, and that eliminated a small amount of current that had been flowing in the redundant oven-thermal-control system. The internal oven temperature did not change, but the temperature measured at the external sensor did because the gradient between the oven and the rest of the instrument was altered. The 16 July 2013 change to the optical-bench thermal-control scheme nearly eliminated the annual variation. Inside the oven the annual variation was attenuated by a factor of two to three (not shown).
3.2 Short-Term Instrument Temperature Trends
sec:shortT
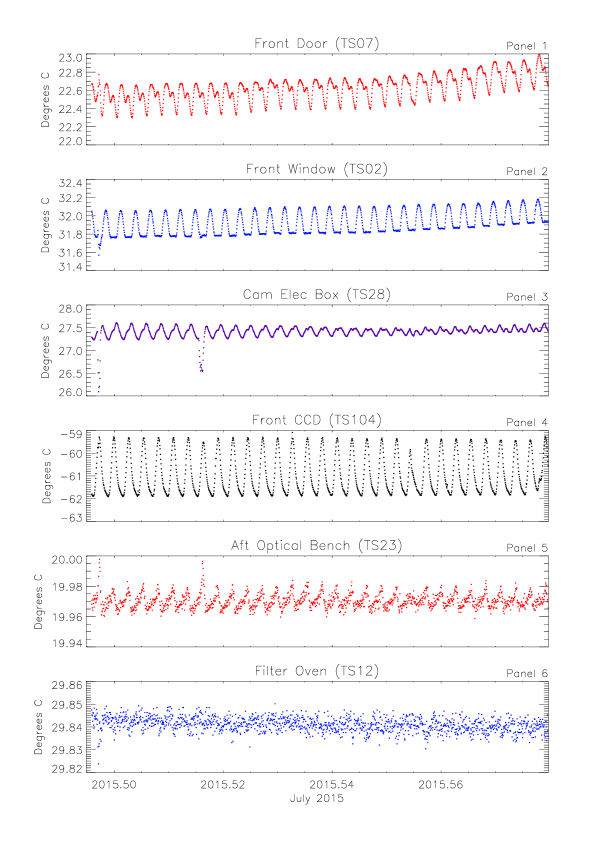
Figure \ireffigure:hmi_temps_month shows temperatures measured at the same locations in the instrument for the month of July 2015 – after the changes in the temperature control scheme. This month is fairly typical and was selected because it has a few interesting features that can be examined in a little more depth. Averages have been made for 30 minutes (225 eight-second measurements) to highlight shorter-term variations and reduce noise. Unless there is some anomalous event, measurements of variations on time scales less than 30 minutes may not be meaningful because the digitization interval (about 0.05 K, depending on gain) and read noise (the standard deviation of five-minute averages is about 0.03 K) are larger than the actual short-term variability in most instrument temperatures.
Because of its inclined geosynchronous orbit (up to about to the ecliptic), the environment of the spacecraft changes with a 24-hour period and the relative viewing angles of the Earth and Moon at a particular time of day change during the month and year. The orbit was chosen so that the spacecraft remains near W longitude, in constant view of the ground station in White Sands, NM. Eclipses occur only during the Spring and Fall when the spacecraft passes near the Equator at local Midnight. The eclipse dates change as the orbit slowly precesses.
The top panel of Figure \ireffigure:hmi_temps_month shows daily variations of the uncontrolled front-door temperature (TS07). Short-term temperature variations are dominated by changes in the spacecraft environment, primarily the view of the Earth, and by thermal changes elsewhere in the instrument. The maximum daily temperature occurs shortly after 06 UT, local Midnight at the ground station, when Earth is closest to the Sun–SDO line. A second smaller maximum appears a little less than 12 hours later in phase with the temperature maximum of the CCD camera (discussed below). The temperature minimum is fairly sharp and occurs near 0 UT, which is dusk at the spacecraft. The daily temperature range is about 0.3 K.
The temperature of the front window is controlled using measurements from a sensor (TS01) located on the mounting ring opposite the one shown in the second panel (TS02). There is a temperature gradient across the front window. During the first half of the day (0–12 UT) the Earth is in view of the front window, so it radiates less energy. As a result the temperature at TS02 rises due to the change in gradient across the window. During the other half of the day the window cools more efficiently, the gradient changes, and the temperature at TS02 is better regulated. The front door (shown in the top panel) is close to the front window, so it is affected by the thermal control of the front window.
The front-camera electronics box (Panel 3) is mounted on the front of the instrument. It is insulated from direct Sun and has a shield / radiator mounted perpendicular to the Sun–SDO line. Changing views of the Earth affect the amount of heat that is absorbed and also affect the temperatures of other parts of the spacecraft in its field of view. The daily thermal variation of the CEB is more complicated; it shows profile features of both the front window and the CCD (Panel 4).
The CCD temperatures are not actively controlled, but they are kept very cold using independent large radiators mounted on the outboard side of the instrument, ordinarily facing solar South (TS04, shown in Panel 4 of Figure \ireffigure:hmi_temps_month). The visibility of the Earth from the radiators changes significantly during the 24-hour orbit, and the daily CCD temperature variation is fairly large: nearly 3 K. The phase of the environmental variation shifts through the year. SDO is located below Earth’s Equator at local Noon during half of the year and above it during the other half; eclipses occur during the transition. In July the fairly sharp daily temperature profile of the CCD peaks at local Noon (about 20 UT) when the Earth is near the anti-sunward direction and most visible to the radiators. Whatever causes the variation in the CCD temperature also affects other external, uncontrolled parts of the instrument, as seen in Panels 1 and 3. Multiple lines appear in the corresponding panels of Figure \ireffigure:hmi_temps_mission because of the three-hour sampling of the systematic daily temperature profile.
The optical-bench temperature is controlled using measurements made at a particular location; Panel 5 shows that the temperature measured at a nearby location on the optical bench varies within a range of 0.02 K. The temperature has a sawtooth daily profile and peaks each day at the same time as the CCD detector.
The filter oven is thermally isolated from the rest of the instrument, has a long thermal time constant, and varies in temperature by less than 0.01 K with only a very weak daily pattern (TS12, in the bottom panel). Remaining variations at the surface of the oven shown here are consistent with read noise of the sensors.
There are a couple of interesting features of note during the month. On 1 July and 8 July there are clear offsets in the front-camera electronics-box temperature (Panel 3) that can also be seen to varying degrees in the optical bench, front window, and front door (Panels 5, 2, and 1 respectively). On 1 July SDO performed a “cruciform maneuver” for the purpose of calibrating the EVE instrument. Over the course of about 4.5 hours the spacecraft was pointed to 112 different locations up to away from the Sun along two orthogonal directions and that caused small changes in the temperatures. On 8 July small offpoints of the spacecraft were made to determine AIA and HMI offset flat fields. The corresponding temperature perturbations were smaller.
Careful inspection shows that on 22 July the front-CCD temperature profile was unusual (Panel 4). Small perturbations in the optical-bench and camera-electronics-box temperatures (Panels 5 and 3) can also be perceived. These occurred during a spacecraft-roll maneuver performed for HMI calibration (see Section \irefsec:Rolls). During the roll, the Sun–Earth pointing is maintained, but the spacecraft is oriented with solar North at sixteen different roll angles. The change in roll changes the viewing angle of the Earth from the HMI radiators.
3.3 Plate Scale
sec:Platescale
The plate scale is set by the mechanical and optical properties of the telescope and is measured by determining the observed radius of the solar image in CCD pixels and applying a geometric correction to normalize the value to 1 AU. The HMI plate scale correlates strongly with the temperature of the HMI optics package and to a lesser degree with the telescope-tube temperature, as shown in Figure \ireffigure:plate_scale.
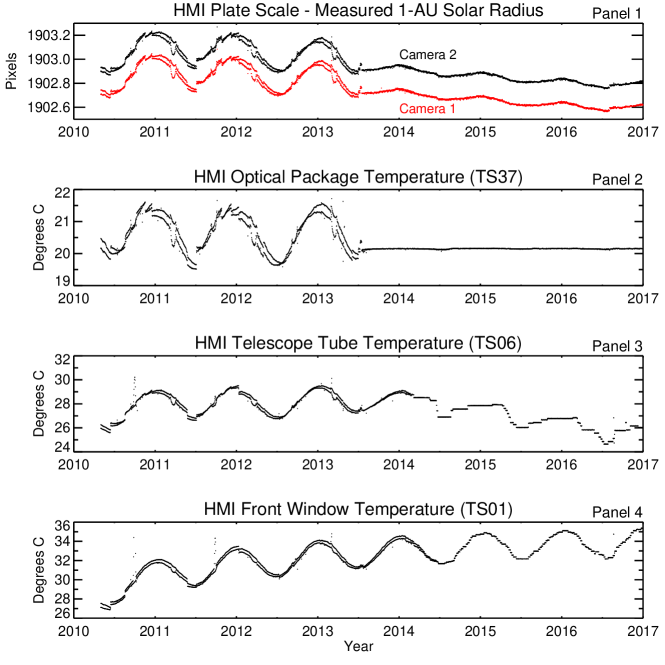
The pronounced annual periodicity present during the first three years is due to temperature drift of the HMI instrument caused by the change in irradiance due to variation in the Sun–spacecraft distance. Daily variations are driven primarily by changes in the spacecraft environment related to the SDO orbit.
In the early years, when the instrument temperature varied by a little more than a degree during the course of a year, the measured radius varied by about 0.3 pixels (0.15 arc seconds). As described in Section \irefsec:Temperature, the temperature-control scheme for the optics package was changed on 16 July 2013 to reduce variations in the temperature. The variations in plate scale were greatly reduced. Similar changes were made to the temperature-control scheme for the telescope tube and front window on 25 February 2014. Since then more frequent temperature adjustments have been made to keep the focus of the instrument in the proper range. The gradual long-term decrease in the measured solar radius may be related to changes in the front-window temperature (which affects magnification), tube temperature (which affects the distance between lens and image), or other factors.
Using HMI data collected during the 2012 Venus transit, Emilio et al. (2015) derived a 1-AU solar radius in the continuum wing of the line of arc seconds, equivalent to km. Similarly, Couvidat et al. (2016) found that the image of the Sun is a little larger than expected. For the image scale the ratio of their best estimate to that in the headers is . Consequently, we conclude that for the HMI spectral line the reference radius of the Sun (keyword RSUN_REF) should be decreased by about 55 km to 695,944,685 m.
4 Optics and Filter Issues
sec:opticsfilters
This section describes calibrations and observations made to assess optical performance of the HMI instrument and elements of the filter system. A more complete discussion of the filter calibration is found in Couvidat et al. (2016).
4.1 Instrument Throughput Changes
sec:throughput
The instrument throughput has been slowly decreasing since launch. Figure \ireffigure:intensity_decrease shows the average solar intensity measured in twice-daily full-disk continuum exposures (Frame ID = 10000) for each camera. The DATAMEAN values have been corrected for exposure time, the Sun–SDO distance, and for a one-time change in the image crop radius at 19:51 UT on 28 January 2015. The exponentially decreasing decay rate observed in both cameras is generally consistent with expected effects of radiation damage darkening the front window. Short-term variations of a single camera or between the cameras is likely due to the changing thermal environment. Couvidat et al. (2016) measured a temperature sensitivity of -0.25 % per degree in Camera 2, but as shown in Panel 4 of Figure \ireffigure:hmi_temps_mission, except for regular daily and annual changes, the nominal temperature measured near the CCD has not changed much over the course of the mission. The origins of the long-term differences between the two cameras are not understood. The local-Noon–Midnight asymmetry (6 – 18 UT) is greatest in the middle of the year when Earth is South of SDO and thus most visible to the radiators at local Midnight.
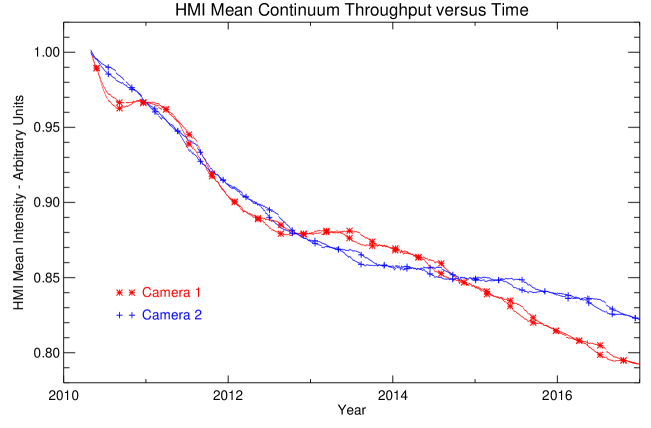
The gradual decrease in instrument throughput requires occasional exposure-time increases to maintain a roughly uniform signal intensity. Since launch the exposure duration has been increased three times, in each instance by five milliseconds, as shown in Table \ireftable:exposure_adjustments. There is still sufficient margin in the timing of the camera image taking to compensate for further throughput decreases; the current mode of operation allows for exposures of up to 430 ms without compromising the basic 45-second cadence.
| Date | Front Camera (1) | Side Camera (2) |
|---|---|---|
| 01 May 2010 | 125 ms | 115 ms |
| 13 Jul 2011 | 130 ms | 120 ms |
| 16 Jan 2013 | 135 ms | 125 ms |
| 15 Jan 2015 | 140 ms | 130 ms |
HMI observables are computed from sums and differences of filtergrams, so exposure-time uncertainty contributes directly to errors in the measured quantities. A mechanical shutter motor controls the exposure time by rotating the cut-out sector of an opaque disk into place, with a pause in the open position for a specified time. The shutter is located in the observing beam near an image of the pupil when in Obsmode. The mechanical exposure time can be specified with precision of about 120 microseconds and has an observed standard deviation of 13.2 microseconds, about a part in 10,000 of the nominal exposure. The difference between the commanded and actual exposure time is determined with precision of one microsecond and accuracy better than 4 microseconds using integral detectors to determine the precise times that the leading and trailing edges of the open sector rotate past each of three characteristic locations in the beam. The actual exposure time is used in the analysis. Typical exposures are 115 – 140 milliseconds. The four-microsecond exposure-time knowledge is a part in 30,000 of the nominal exposure time. This is a factor of three or more better than what is required to beat the photon noise level for global averages of the mean magnetic field and the large-scale velocity for low-spatial-degree helioseismology. The SDO/HMI exposure time is monitored far more closely than it was for the Solar and Heliospheric Observatory / Michelson Doppler Imager (SOHO/MDI, Scherrer et al., 1995) and has much less variability. See Appendix \irefsec:FigureSupplement for a plot of the mechanical exposure quality.
4.2 Distortion
sec:Distortion
Image distortion arises because of small imperfections in the optics, including the optics that move to tune the instrument. The distortion map determined prior to launch for each camera (See Figures 7 and 8 of Wachter et al., 2012) has been characterized using Zernike polynomials. The fitted instrumental-distortion correction is applied to each Level-1 filtergram. The maximum displacement before correction is less than 2 pixels and occurs near the top and bottom of the CCD camera; the mean residual distortion after correction is pixels. Differences between the front and side cameras are of order 0.2 pixels. Couvidat et al. (2016) analyzed HMI images taken during the Venus transit of 6 June 2012 and found that all along the path of the planet, the distortion-corrected observed position agreed with the ephemeris coordinates to better than 0.1 pixels (0.05 arcseconds).
4.3 P-angle
sec:pangle
The roll angle of the solar image relative to the instrument is commonly called the p-angle (not to be confused with the position angle determined for Earth-based observations). In the case of HMI, the top of the CCD is nominally near the solar South Pole, so the WCS standard CROTA2 keyword that gives the angle between heliographic north and CCD coordinates typically has a value very close to . For HMI the p-angle = CROTA2.
Couvidat et al. (2016) reported on a careful analysis of both the absolute p-angle based on observations of the 6 June 2012 Venus transit and the relative p-angle of the two cameras based on comparison of near-simultaneous images obtained by the two cameras in July 2012. They find that the p-angle for the front-camera is and for the side camera . The difference in p-angle between the two cameras is with a constant drift rate of year-1 during the SDO prime mission. The drift is probably due to curing of materials used to mount the CCDs or to thermal changes.
The absolute p-angle was also determined by Liang et al. (2017) for the Mercury transit using the same methods used by Couvidat et al. (2016). However, the much smaller size of Mercury meant that no annulus extraction was done. They found that the values for Camera 1 changed from -0.0140 to -0.0114 (+0.0026) and those from Camera 2 from +0.0712 to +0.0735 (+0.0023). Given the size of the residuals seen by Couvidat et al. (2016), the difference does not appear to be significant.
4.4 Camera Differences
sec:cameradifferences
The front and side cameras of HMI are not identical and their images exhibit slightly different properties, for example in their focus, alignment, and the occurence of bad pixels. Of course to some degree the temperature and radiation environments of the two cameras also differ. Although the CCD radiators are adjacent and on the same solar-south-facing side of the instrument, the radiators for the camera-electronics packages have different geometries. The only significant differences in the optical paths are due to a beam splitter, fold mirrors, and shutters that direct the light to the two cameras after all of the other optics. Since 13 April 2016, filtergrams from the two cameras have been combined to compute the vector magnetic field (Couvidat et al., 2016; Hoeksema et al., 2014). Figure \ireffigure:best_focus shows that there is only a small drift in focus difference between the two cameras during the lifetime of the mission, probably due to aging of materials that affect the CCD mounting position or to thermal drifts.
4.5 ISS performance
sec:ISSPerf
Basic spacecraft pointing information is provided by three Inertial Reference Units (IRUs). The spacecraft relies on signals from AIA for more fine-guiding information. Small, rapid pointing variations are driven by movements of mechanisms throughout the spacecraft. The HMI image stabilization system (ISS) uses a tip–tilt mirror to remove fine-scale jitter measured at a primary image plane in the instrument. The ISS measures the solar-limb position using four orthogonal detectors to sense image motion on the limb. The HMI guiding mirror has a three-point piezo-electric transducer (PZT) actuator to compensate for position errors in the observed limb position. The ISS holds the image location constant to about 0.025 arcseconds (a twentieth of a pixel) with a frequency roll-off of a factor of two at about 50 Hz (Schou et al., 2012a). The PZTs nominally operate at about 35 V, and there is a superposed annual period of amplitude about 5 – 10 V associated with variations in the spacecraft thermal environment and size of the solar image. The nominal set point can also change when the instrument legs are moved to recenter the image (approximately monthly).
fig:pztb

The RMS voltage variation for each PZT computed over an hour is of order half a volt, with occasional spikes when spacecraft mechanisms are active. The RMS value of the three computed PZT-RMS values is an indicator of the magnitude of the jitter signal. Figure \ireffigure:PZT_RMS shows the hour-averaged three-PZT RMS value of the ISS voltages from 1 May 2010 to the end of 2016.
Regular large-amplitude spikes are due to brief weekly and biweekly excursions when the instrument is intentionally pointed away from Sun center for calibrations. Also visible are regular intervals of increased RMS each Spring and Fall during eclipse season. The ISS control loop is ordinarily turned off around eclipse times and during spacecraft off points.
SDO is equipped with three Inertial Reference Units (IRUs) to provide information to help keep the solar pointing stable; however, the operation of the IRUs has changed during the mission. The IRUs were operated at a temperature that was colder than optimal during most of the mission due to concerns about potentially deleterious effects of their heaters on the spacecraft battery. As a result there was some jitter introduced by the wheels. In 2013, the performance of IRU-1 began to deteriorate more rapidly, and on 12 October 2013 the current draw increased sharply. The next day IRU-1 was removed from the control loop and it was powered down in December 2013. Since that time SDO has operated with only two IRUs. In early 2015 IRU-2 exhibited early signs of similar behavior. A test in late 2015 showed that increasing the IRU temperature eliminated the worrying symptoms of IRU-2 and improved overall jitter levels. After careful analysis of the effects on the battery, the IRU temperatures were raised on 16 September 2016. The decrease in the jitter signal is apparent in Figure \ireffigure:PZT_RMS. These changes in operation of the spacecraft IRU units have had no apparent effect on the final performance of the ISS system, nor have they been detected in the HMI science products, except for an increase in five-minute power in the full-disk intensity means between October 2013 and September 2016 (R. Howe, private communication 2016) and in local-correlation-tracking results (B. Löptien, private communication, 2015) that may be due to jitter in the spacecraft roll angle.
4.6 HMI Filter Element Wavelength Drift and Tuning Changes
sec:Tuning

HMI uses a series of filters to select the wavelength of each filtergram. The entrance window and broad-band blocking filter are followed by a five-stage Lyot filter and two Michelson interferometers. The final stage of the Lyot (E1) and the Michelsons are tuneable. The nominal wavelength of each tuneable element is set by rotating a half-wave plate. Rotation of the wave plate by scans the element through its free spectral range (FSR). For convenience, the wavelength tuning is characterized in terms of the phase within the FSR. I.e. scanning in phase tunes through the entire spectral range of the element, so each step of the hollow-core motor that holds the wave plate changes the phase by six degrees.
The central wavelengths of the filter elements drift with time. The wavelength of each of the three tuneable elements can be determined from the biweekly detune calibration sequences described in Section \irefsec:Detune. A relative minimum in intensity occurs when an element is tuned to the spectral-line center. The average phases of the HMI tunable elements change slowly with time, as can be seen in Figure \ireffigure:phase_drift. No correction has been made for the motion of the spacecraft since the detunes are ordinarily taken when the Sun–SDO velocity is small.
It is important to cotune the filter elements to the same wavelength and to keep the wavelength range over which the filtergrams are taken centered on the Fe i spectral line. The observed drifts warrant regular re-tuning of the instrument. The wide-band (WB) Michelson exhibits a stronger time-dependence, whose origin is thought to be the glue holding the mirrors in the two legs; it is believed that the glue in the vacuum leg has expanded or contracted with time. A similar issue was encountered by SOHO/MDI. The rate of change in the WB Michelson phase is slowing down. The instrument tuning has been adjusted about once per year, as indicated in Table \ireftable:Retunes.111See jsoc.stanford.edu/doc/data/hmi/hmi_retuning.txt The table also indicates the Wavelength Tuning ID number (WTID) and the specific index positions of the three tuning motors.
| Wavelength | Reference Tuning Position | |||
|---|---|---|---|---|
| Retuning Date | Tuning ID | |||
| and TAI Time | (WTID) | Lyot/E1 | Wideband | Narrowband |
| 30 Apr 2010 22:24 | 10 | 36 | 58 | 82 |
| 13 Dec 2010 19:45 | 11 | 37 | 56 | 82 |
| 13 Jul 2011 18:35 | 14 | 37 | 54 | 82 |
| 18 Jan 2012 18:15 | 17 | 37 | 53 | 81 |
| 14 Mar 2013 06:42 | 20 | 37 | 52 | 81 |
| 15 Jan 2014 19:13 | 23 | 37 | 51 | 80 |
| 08 Apr 2015 18:51 | 26 | 37 | 50 | 80 |
| 27 Apr 2016 18:56 | 29 | 37 | 50 | 79 |
| 19 Apr 2017 19:58 | 31 | 38 | 49 | 79 |
table:Retunes
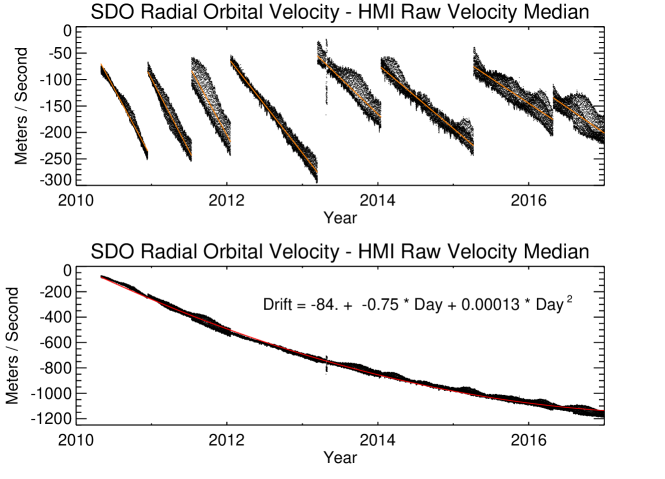
If the instrument were tuned and calibrated perfectly, the measured median velocity of the Sun would be nearly the same as the Sun–SDO velocity. Figure \ireffig:velocitydrift plots the difference between those two quantities, demonstrating the effect of the slowly changing wavelength and the effects of compensating changes in the HMI filter tuning. The Sun–SDO velocity is known to a few mm s-1 and the baseline zero offset is due to the nominal tuning of the instrument. The daily scatter is due to the effects of changes in the instrument environment and to actual solar signals that appear in the median-velocity signal. Changes in the short-term noise level arise from changes in sensitivity and imprefections in calibration discussed elsewhere. The upper panel shows that the residual velocity decreases with time at a significant rate and that the rate seems to slow with time. The tuning has been adjusted regularly to keep the offset from zero less than about 300 m s-1. The bottom panel adds back in the velocity offset due to the changes in the tuning, as determined by matching the endpoints of the linear fit for each subset. A quadratic fit matches the curve very well and shows that the overall drift in meters per second is for measured in days from the start of the prime mission.
5 Level-1 Corrections: Camera and Detector
sec:level1
The Data Capture System (DCS) at Stanford’s Joint Science Operations Center (JSOC) receives raw science data directly from the SDO Ground Station; housekeeping and other spacecraft data come via the mission operation center at NASA/Goddard. The image data are extracted, combined with the appropriate metadata, and packaged as image files. These raw, uncorrected filtergrams are referred to as Level-0 data, and they are typically available within three minutes of the image acquisition onboard the spacecraft. The first stage of data processing applied to these images at the JSOC, which includes overscan row removal, dark-current and flat-field correction, and cosmic-ray detection, as well as added metadata, generates Level-1 data. This processing is done twice: once as quickly as possible to generate the near-real-time (NRT) data for use in space-weather applications, and then a second time, typically four days later, with occasional ground-based transmission gaps filled and with better calibrations to generate the definitive Level-1 data. The Level-1 processing is described in this section.
5.1 Dark-Current Correction
Dark frames are taken with each camera twice a day as part of the calibration sequences started at 06:00 UT and 18:00 UT. Zero-length pedestal-current (bias) measurements are not taken; the CCD bias and dark current are measured together, and we do not distinguish between them. The measured dark current in both cameras has been extremely stable over the course of the mission, with average dark values of 122 counts and 131 counts for Cameras 1 and 2, respectively. To minimize the impact of photon noise on the dark correction, average dark frames are generated from the individual darks every three months, and it is these averages that are used in the Level-1 processing. There is a diurnal variation in the temperatures of the CCDs which likely gives rise to a small variation in CCD dark signal, but this is not currently measured or corrected for. In principle, data from the overscan area could provide additional information about dark current and other parameters for each image.
5.2 Flat Field Correction
sec:Flatfield
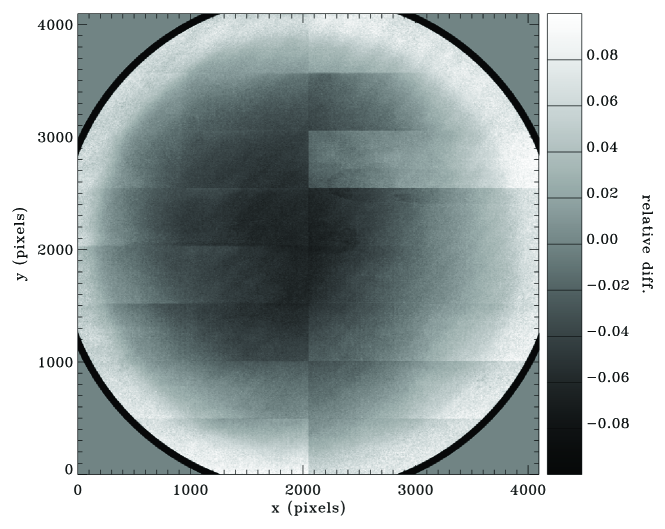
Pixel-to-pixel gain variations in the CCD detectors are corrected using flat fields measured for each camera. Because there is no way to illuminate the CCDs on orbit with a sufficiently uniform light source, the pixel gains are determined by shifting the solar image to various locations on the CCDs. The procedure for using these images to determine the flat field is described by Kuhn, Lin, and Loranz (1991), Toussaint, Harvey, and Toussaint (2003), and Wachter et al. (2012). The solar image can be shifted in two ways, and both are used in determining HMI flat fields. First, the entire spacecraft can be slewed to a set of off-points. This is done quarterly, and it involves nine off-point positions in a cruciform pattern. The entire maneuver takes approximately two hours and forty minutes. The second method uses the instrument’s image stabilization system (ISS) to shift the image. The piezo-electric transducers (PZTs) in the ISS are activated to tilt the ISS mirror to a predetermined set of offsets. PZT flat fields are performed weekly to provide a good measure of small-spatial-scale sensitivity, whereas the quarterly offpoints provide a better large-scale flat field. The flat fields of both cameras have evolved slowly over the course of the mission. The difference between the front camera flat field at the begining and end of the prime mission is shown in Figure \ireffigure:flat_diff.
A different method of generating flat fields, using the rotation of the Sun to smooth out inhomogeneities in the solar image, has also been implemented. The algorithm used to calculate rotational flat fields is described by Wachter and Schou (2009). Rotational flat fields are expensive to compute and are not used in the current Level-1 HMI data, since they provide only a small improvement over the PZT method.
5.3 Bad Pixels and Cosmic Rays
Each filtergram taken by HMI has a number of bad pixels that must be identified and properly treated. There are a very small number of totally bad pixels – none in Camera 1 and just three in Camera 2. In addition, pixels from the quarterly off-point flat fields with gains less than 50 % of the average gain are considered to be permanently bad and are identified as such in each filtergram. The list of such pixels is propagated into each Level-1 filtergram record. Camera 1 has 45 pixels flagged as permanently bad, and this has been consistent since the beginning of science operations. The number of bad pixels in Camera 2 increased from 31 to 34 over the course of the prime mission. As with Camera 1, pixels flagged as bad are consistent from off-point to off-point.
Transient events (cosmic rays) account for the remainder of the bad pixels in each filtergram. Cosmic ray hits are first detected by applying a high-pass filter to each filtergram and flagging pixels that exceed a certain threshold. In the production code, this threshold is 10.5 times the variance in the center of the image. These pixels are included in the Level-1 bad-pixel list. Cosmic rays are detected out to 0.98 of the solar radius, even though image statistics are computed to 0.99. This may be adjusted in the near future.
A second cosmic-ray-detection algorithm is employed after individual Level-1 filtergrams are generated. Run daily as part of the rotational flat-field module, the algorithm identifes bad pixels in tracked locations based on intensity variance over about 20 minutes. False identifications in the initial per-filtergram detection algorithm are sometimes found. The results for each image are logged, but they are not easy to recover. The higher-level processing modules that combine multiple filtergrams to calculate the observables (Couvidat et al., 2016) exclude the bad pixels from the temporal and spatial interpolation. This second cosmic-ray detection is not run for HMI-NRT observables.
The number of pixels removed due to cosmic rays varies throughout the year and with solar activity. Figure \ireffig:Badpixels shows the daily mean and maximum number of pixel hits in Camera 2. Camera 2, mounted on the Sun-facing side of the instrument, generally takes roughly twice as many hits as the other camera.

5.4 Solar-Radius Correction for Height of Formation
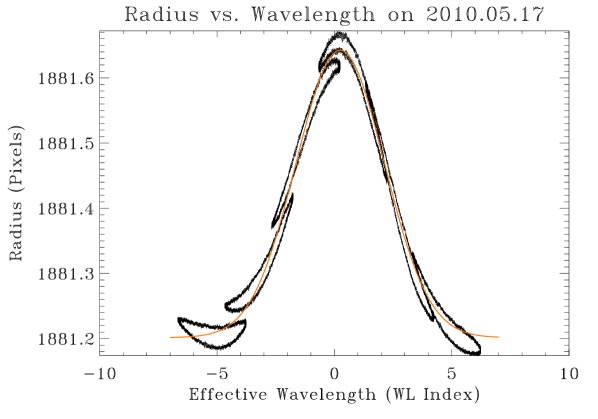
The height of formation near the 6173 Å Fe i spectral line changes with wavelength by a few hundred kilometers (Fleck, Couvidat, and Straus, 2011; Emilio et al., 2015). Because the standard HMI observing sequence samples the solar Fe i line at six wavelengths separated by about mÅ, the apparent size of the Sun varies with wavelength by as much as half a pixel. Figure \ireffig:RadiusWavelength shows the measured solar radius as a function of the wavelength index, where each index step corresponds to a nominal mÅ HMI tuning-motor increment relative to line center.
Even though the location of the solar limb depends on wavelength, the physical scale of the image does not change. To account for this properly, the radius returned by the limb finder is adjusted for use later in the processing pipeline when filtergrams are resized. Specifically, the values returned by the limb finder (X0_LF, Y0_LF, and RSUN_LF) are corrected for the wavelength dependence in the keywords CRPIX1, CRPIX2, and R_SUN.
The limb-finder radius is reduced by a wavelength-dependent quantity
| (1) |
where OBS_VR/, is the integer wavelength index of the image relative to the index of the center wavelength, OBS_VR is the known Sun–SDO radial velocity, and dvdw = . The values of , , and are the result of a Gaussian fit to the solar radii returned by the limb-finder as a function of the wavelength position of the images.
The radius–wavelength relation varies somewhat from day to day depending on average velocity and the instrument environment. Figure \ireffig:Radiusparams shows the observed temporal dependence of the three fitted parameters as well as the baseline offset due to Sun–spacecraft distance. The observables pipeline code uses the following standard values: , , and . The standard value of appears in the plot to be too large by as much as 0.005 arcseconds (about 35 km), a significant fraction of the 55 km error in the reference solar radius RSUN_REF discussed in Section \irefsec:Platescale.
A single radius and center-position correction is made for each filtergram, but of course the velocity due to solar rotation also shifts the nominal line position by a comparable amount. This east–west antisymmetric wavelength shift causes an additional position-angle-dependent radius change and image offset for which no correction is made.

5.5 Additional Metadata
sec:Metadata
Level-1 filtergrams are associated with a variety of metadata stored as keywords in the JSOC database. Information about the status of the instrument from both spacecraft telemetry and the science data streams is associated with the Level-0 filtergrams, and the relevant data are propagated through to Level 1. The Level-1 processing adds information about the spacecraft state, location, and pointing, as well as image scale and centering. Information on spacecraft position and velocity are obtained from spacecraft ephemeris data provided by the flight operations team. Image coordinate information follows the WCS standard (Greisen and Calabretta, 2002) and is computed from a combination of a fit to the solar limb and the spacecraft ephemeris information. Keywords set in the Level-1 code are listed in Appendix \irefsec:Lev1Keywords Table \ireftable:level1_wcs_orbit_keywords.
In addition to these metadata, two keywords are set for the Level-1 filtergrams that deserve somewhat closer attention: QUALITY and CALVER**.
5.5.1 Image Quality and the QUALITY Keywords
sec:Quality
While nearly all filtergrams taken by HMI over the course of the mission are of nominal quality and suitable for scientific studies, a few are taken under non-nominal conditions, are of degraded quality, or are completely missing. The quality of each filtergram is indicated to the end user by a set of flags stored bit-wise in a 32-bit integer named QUALITY. At Level 0 a QUALITY bit is set when an error occurs in the data transmission and capture, or as a result of certain errors from the instrument. Appendix \irefsec:Lev0Qual Table \ireftable:lev0_quality describes the Level-0 QUALITY bit masks and meanings. This keyword is propagated to the Level-1 records as QUALLEV0.
At Level 1, a new QUALITY keyword is defined. The bit mask for each flag and its meaning is shown in Table \ireftable:lev1_quality in Appendix \irefsec:Lev1Qual. Nominal science-quality filtergrams have no flags set in the QUALITY keyword, and thus the value will be zero. The most common reason for a non-zero QUALITY is that the filtergram was taken as part of a daily or weekly calibration. In fact, many such filtergrams are no different than those taken in the regular observing sequence and can be used without concern for computing higher level HMI observables.
The most common flag indicating a degraded filtergram is the ISS-loop-open flag, which indicates that HMI’s image stabilization system is not correcting for image jitter. This happens during certain calibration sequences and updates of the instrument configuration, but is most often due to the spacecraft not being in its fine-guidance, or “science” mode. This is indicated by the ACS_MODE flag, and is usually due to spacecraft maneuvers or lunar or Earth transits. Another QUALITY bit is set to indicate that the instrument is in thermal recovery after a lunar or Earth transit — for a discussion of these intervals see Section \irefsec:eclipses.
Bits in the QUALITY keyword can also indicate missing metadata or filtergram data. These are mostly due to occasional data corruption that occurs in the instrument electronics; see Section \irefsec:anomalies.
In fact, determining what constitutes a good measurement depends on the use to which the observation is put. The basic quality information for higher level products, e.g. Dopplergrams or magnetograms that are computed from multiple filtergrams, is also indicated in an observables-level QUALITY keyword. These are listed in Tables \ireftable:Obs_quality, \ireftable:Obs_quality2, and \ireftable:Obs_quality3 in Appendix \irefsec:S_ObsQual.
5.5.2 Calibration Version and the CALVER** Keywords
Changes to the instrument observing sequence, processing software, and calibration constants, which we refer to collectively as the “calibration version,” are rarely made, but each Level-1 filtergram includes a keyword, CALVER32, that identifies the calibration version used to generate the data. A longer keyword, CALVER64, is used by higher-level data products to convey similar information. Unlike the QUALITY keywords, the CALVER** keywords use nibbles, or 4-bit fields, to denote various calibration changes. The meaning of each field is shown in Table \ireftable:calver_keywords. Currently, seven fields are defined; more can be employed if and when new changes are introduced into the processing of HMI data. For Level-1 data, only two of the fields are used: the height-of-formation-correction version and the instrument-rotation-parameter version. For all currently available Level-1 data, the height-of-formation correction is Version 2 and the rotation parameter, which was corrected after the 11 May 2012 Venus transit, is Version 1.
| Field | Bits | Mask | Name | Note |
|---|---|---|---|---|
| 0 | 0–3 | 0x0F | HFCORRVR | Height-of-formation code version used. |
| 1 | 4–7 | 0xF0 | CROTA2VR | Version of CROTA2 in Master Pointing Table. |
| 2 | 8–11 | 0xF00 | N/A | If 0: smooth look-up tables were used. |
| 3 | 12–15 | 0xF000 | N/A | If 0: a non-linearity correction was applied. |
| 4 | 16–19 | 0xF0000 | FRAMELST | If 0x0: Mod C; if 0x4: Mod L; |
| if 0x2 or 0x3: incorrectly processed Mod L. | ||||
| 5 | 20–23 | 0xF00000 | N/A | If 0: PSF/scattered light deconvolution applied. |
| 6 | 24–27 | 0xF000000 | N/A | If 0: rotational flat field used. |
6 Significant Events and Anomalies
sec:eventsanomalies
Through the prime mission, HMI’s production of nominal science data was more than 95 % complete. This section discuses that remaining 5 %: the events and anomalies that take place both routinely and unexpectedly that degrade or interrupt science data from HMI. The vast majority of these events are expected and planned for. The semi-annual series of Earth eclipses, as well as occasional lunar transits, obscure HMI’s view of the Sun. After eclipses, the most common interruptions are caused by planned calibration sequences used to ensure that calibration of HMI science data products continues to be as precise as possible; these are described in Section \irefsec:calibobs. Science-quality observations are also interrupted during spacecraft maneuvers, which are undertaken for instrument calibrations and for maintaining orbit and control.
On rare occasions, data are lost due to unexpected failures in the instrument, spacecraft, or ground systems. These anomalies are also discussed in this section. Fortunately, all of the anomalies encountered were recovered from fully without subsequent adverse effect on instrument health or data quality.
There are four basic ways in which HMI data quality can be affected. First, filtergrams can be taken that are not a part of the standard observing sequence; they are generally not used in generating the science data products. Second, images may be of degraded quality, due to the Sun not being centered, the stabilization system not being on, the instrument being out of nominal focus or temperature range, and so on. Third, image data or metadata may be corrupted, and finally the data may be missing entirely.
6.1 Spacecraft Maneuvers
The SDO spacecraft periodically performs maneuvers that interrupt HMI science-quality data. Many of these maneuvers are for instrument calibration: eight yearly off-point maneuvers for the EVE instrument, quarterly off-points for AIA and HMI flat fields, quarterly rolls for HMI image-quality monitoring, and quarterly maneuvers to calibrate the AIA guide telescopes (these are used for SDO fine-guidance). In addition to these regular maneuvers, there have been a few special maneuvers: twice to observe the star Regulus for calibration, on 23 August 2010 and 23 August 2011, and for observations of comets Lovejoy and ISON on 15 December 2011 and 28 November 2013, respectively. The spacecraft must also periodically perform burns of its propulsion system for maintenance of its orbit. These station-keeping maneuvers were performed 11 times during the prime mission. Finally, angular momentum must periodically be dumped from the reaction wheels by using the reaction control system (RCS) thrusters. This was done 21 times during the prime mission. Momentum management maneuvers take roughly 14 minutes; station-keeping maneuvers ordinarily take 35 minutes. When possible, maneuvers are performed together to minimize the number of gaps. An events table can be found at aia.lmsal.com/public/sdo_spacecraft_events.txt.
6.2 Earth Eclipses
sec:eclipses
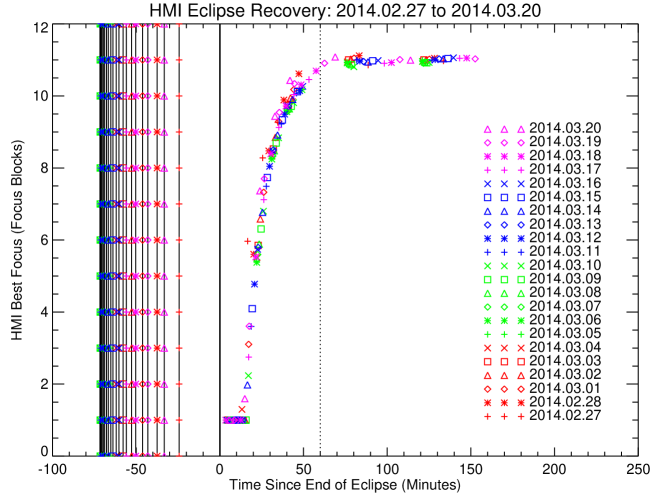
Twice yearly, in Spring and Fall, SDO’s view of the Sun is obscured by a series of Earth eclipses. There are between 22 and 24 such daily eclipses per season, occurring near local Midnight of the SDO orbit around 06 UT, and they last up to 72 minutes. During the eclipse period the front-window temperature drops significantly, causing substantial change in instrument focus. After the end of each eclipse there is an extended period while the front-window temperature recovers and instrument focus recovers. Throughout the course of the mission the team has fine-tuned the use of front-window heaters to minimize this recovery time, which currently takes approximately one hour. During this recovery period, periodic focus sweeps are taken to monitor the recovery; focus profiles can be seen in Figure \ireffigure:eclipse_recovery for the Spring 2014 eclipse season.
6.3 Lunar and Planetary Transits
Although they are much less frequent than Earth eclipses, lunar eclipses occur several times per year and cause interruptions in HMI’s science data. Although the Moon does not fully occult the solar disk, HMI’s ISS must be disabled during these transits, so science-quality data cannot be taken. In addition, the decrease in solar flux decreases the temperature of the front window, which causes a change in focus. The duration of these transits are highly variable, but they typically last between one and three hours.
The planets Mercury and Venus can also pass between the Sun and SDO; this happened for Mercury in May 2016 and for Venus in June 2012. Transits are useful for calibrating the instrument roll angle, point spread function, and distortion correction (Sections \irefsec:pangle, \irefsec:Platescale, and \irefsec:Distortion). HMI ran non-standard observing sequences during all of the transits, which allowed the LoS observables to be produced but not the vector products.
6.4 Instrument Anomalies
sec:anomalies
Instrument anomalies are caused by occasional and unpredictable problems with the operation of the instrument. Most anomalies result in one or two unusable images, in certain cases the outages can be hours or days.
6.4.1 Corrupt Images
On occasion the image file or associated telemetry arrive corrupted at the data-capture system. It is believed that most of these occurrences originate in the camera electronics on the spacecraft, possibly due to cosmic ray hits. The fraction of images lost this way is roughly one out of every million. The front camera suffers from roughly twice as many instances as the side camera. A cumulative count of corrupt images for each camera is shown in Figure \ireffigure:corrupt_images. In some instances, corruption of one image affects the data in the following frame, so that the total number of corrupted images is somewhat larger than the number of primary hits.

6.4.2 Camera System Errors
Persistent data losses can occur due to errors in the HMI electronics Camera Interface (CIF) cards or in the Data Capture–High Rate Interface (DC-HRI) cards that require intervention from the ground to clear. Errors on the DC-HRI cards involve bit-flips to tables loaded into the FPGAs (Field Programmable Gate Arrays) on the cards that determine how the image data are read out. Every table loaded on the cards is checked continuously for parity errors, and alerts are generated when a parity error is detected. The instrument sequencer is then stopped, and the tables are reloaded to clear the parity error. Two types of tables have been affected: the crop tables, which define the area of each image to be stored and downlinked (to save bandwidth, the areas of the image off the solar limb are not downlinked), and the look-up tables that are used for data compression. Errors to the crop tables result in garbled images, while errors to the look-up tables result in one pixel value being changed to another. Garbled images from crop-table errors can be reconstructed, although in some cases several rows may have missing values. Incorrect data due to look-up table errors generally cannot be fixed, but they do not appreciably affect the quality of the data because only a very few pixels are affected. CIF card errors result in garbled image-header data. A list of the camera anomalies experienced by HMI is shown in Table \ireftable:anom. When the first anomaly occurred, the error bit set by the parity check was not being monitored, and the effect on the images was simply one partial row of bad values that was difficult to see by eye; consequently, the error was not noticed for almost three weeks. In all subsequent events, the recovery time has been determined by how quickly HMI and SDO personnel can begin commanding the instrument. The majority of camera anomalies have been experienced by Camera 2 (the front/Doppler camera) and they have been increasing somewhat in frequency. Images affected by anomalies are indicated in Level-0 and Level-1 QUALITY bits.
6.4.3 HMI Reboots and Restarts
The HMI instrument has been rebooted on three separate occasions. The first occurrence was on 24 April 2013, and it was initiated by an error from the processor watchdog that halted the processor. Although most instrument functions were halted, the instrument remained powered on and in the configuration it was in when the error message was generated. Recovery took fifteen hours and fifteen minutes. Subsequent analysis of the pre-anomaly telemetry did not reveal what caused the watchdog error message. After the first event, an improperly set sequencer parameter led to errors in the positions of the tunable elements in the Michelsons and Lyot filter, and thus incorrect tuning of the instrument. This error was not corrected until 30 April 2013. A similar event occurred 17 May 2014 with a faster recovery time (eight hours and twenty minutes).
The third HMI reboot involved a full power-down of the instrument when the SDO spacecraft entered Sun-acquisition mode on 2 August 2016 and powered down most of its subsystems including all three instruments. The HMI instrument was fully powered on and recovered the following day, but science data could not be taken until all of the observatory’s fine-guidance systems were recovered and calibrated, which did not occur until 4 August 2016.
| Date | Time | Duration | Camera | Event Type |
|---|---|---|---|---|
| 22 Dec 2011 | 08:41 UT | 20d 12h 34m | 2 | Crop table |
| 24 Apr 2013 | 03:47 UT | 6d 9h 46m | - | Processor restart; tuning error |
| 22 Jul 2013 | 13:21 UT | 4h 59m | 1 | Look-up table |
| 11 Oct 2013 | 04:54 UT | 2h 51m | 2 | Header error |
| 30 Mar 2014 | 12:20 UT | 4h 27m | 1 | Look-up table |
| 23 Jun 2014 | 09:32 UT | 2h 45m | 1 | Header error |
| 23 Mar 2015 | 23:39 UT | 0h 53m | 2 | Header error |
| 17 May 2015 | 14:30 UT | 8h 20m | - | Processor restart |
| 16 Nov 2015 | 12:02 UT | 2h 39m | 2 | Header error |
| 16 Feb 2016 | 19:39 UT | 0h 53m | 2 | Header error |
| 06 Apr 2016 | 02:04 UT | 2h 24m | 2 | Look-up table |
| 10 Jun 2016 | 08:26 UT | 9h 25m | 2 | Header error |
| 13 Jun 2016 | 15:56 UT | 1h 47m | 2 | Look-up table |
| 02 Aug 2016 | 11:31 UT | 1d 13h 23m | - | SDO load shed – intermittent issues until 10 Aug |
| 16 Aug 2016 | 03:02 UT | 13h 20m | 2 | Header error |
| 16 Nov 2016 | 20:17 UT | 1h 07m | 2 | Header error |
| 31 Dec 2016 | 08:49 UT | 10h 49m | 2 | Crop table |
| 11 May 2017 | 19:45 UT | 1h 09m | 2 | Header error |
| 12 Jun 2017 | 01:10 UT | 14h 41m | 2 | Look-up table |
| 15 Dec 2017 | 17:01 UT | 1h 27m | 2 | Header error |
7 Conclusions
sec:conclusion
The HMI instrument has performed nearly flawlessly since the start of regular SDO operations on 1 May 2010. Nearly 120 million filtergrams have been collected and more than 98 % of all possible 45-second Dopplergrams have been recovered. The HMI instrument and SDO spacecraft have experienced only a very few anomalies, none of which caused extensive data loss.
The HMI team has monitored the instrument continuously to maintain and perfect the calibration of the instrument. Such activities include long-term trending of environmental, optical, spectral, and camera characteristics and analysis of daily, weekly, and quarterly calibration measurements to verify performance.
Trends in slowly varying parameters, such as the instrument focus, filter tuning, and exposure time, are regularly evaluated, and in some cases operation of the instrument is adjusted to maintain uniform data quality.
For other quantities, such as distortion, wavelength-dependent formation height, and alignment, values are refined and corrections are made to observable quantities as better data become available.
Most of the periodic variations are responses to changes in the thermal environment, largely due to predictable eclipse seasons, planned events, or daily and annual orbital variations. The thermal-control scheme of the instrument was improved to reduce daily and annual variations inside the instrument.
The goal of all this effort is to provide complete and uniform-quality record of conditions at the Sun over the solar cycle. The observable quantities – Doppler velocity, intensities, and magnetic field – and downstream higher-level products – convection-zone flow maps, internal rotation, synoptic maps of the photosphere and corona, comprehensive characteristics of active-region evolution – all depend on having a well-calibrated instrument with sufficient information available to eliminate or at least understand the sources of uncertainty in the measurements.
Acknowledgements
We thank all of the many team members who have contributed to the success of the SDO mission and particularly to the HMI instrument. In particular we acknowledge the contributions of HMI Calibration Team members R.S. Bogart, S. Couvidat, Y. Liu, and A.A. Norton. We also thank W. Liu and J. Sommers for assistance with preparation of the data and the manuscript. This work was supported by NASA Contract NAS5-02139 (HMI) to Stanford University. The German Data Center for SDO is supported by the German Aerospace Center (DLR) and the State of Niedersachsen.
Disclosure of Potential Conflicts of Interest
The authors declare that they have no conflicts of interest.
References
- Bobra et al. (2014) Bobra, M.G., Sun, X., Hoeksema, J.T., Turmon, M., Liu, Y., Hayashi, K., Barnes, G., Leka, K.D.: 2014, The Helioseismic and Magnetic Imager (HMI) Vector Magnetic Field Pipeline: SHARPs - Space-Weather HMI Active Region Patches. Sol. Phys. 289, 3549. DOI. ADS.
- Couvidat et al. (2012a) Couvidat, S., Rajaguru, S.P., Wachter, R., Sankarasubramanian, K., Schou, J., Scherrer, P.H.: 2012a, Line-of-Sight Observables Algorithms for the Helioseismic and Magnetic Imager (HMI) Instrument Tested with Interferometric Bidimensional Spectrometer (IBIS) Observations. Sol. Phys. 278, 217. DOI. ADS.
- Couvidat et al. (2012b) Couvidat, S., Schou, J., Shine, R.A., Bush, R.I., Miles, J.W., Scherrer, P.H., Rairden, R.L.: 2012b, Wavelength Dependence of the Helioseismic and Magnetic Imager (HMI) Instrument onboard the Solar Dynamics Observatory (SDO). Sol. Phys. 275, 285. DOI. ADS.
- Couvidat et al. (2016) Couvidat, S., Schou, J., Hoeksema, J.T., Bogart, R.S., Bush, R.I., Duvall, T.L., Liu, Y., Norton, A.A., Scherrer, P.H.: 2016, Observables Processing for the Helioseismic and Magnetic Imager Instrument on the Solar Dynamics Observatory. Sol. Phys. 291, 1887. DOI. ADS.
- Emilio et al. (2015) Emilio, M., Couvidat, S., Bush, R.I., Kuhn, J.R., Scholl, I.F.: 2015, Measuring the Solar Radius from Space during the 2012 Venus Transit. ApJ 798, 48. DOI. ADS.
- Fleck, Couvidat, and Straus (2011) Fleck, B., Couvidat, S., Straus, T.: 2011, On the Formation Height of the SDO/HMI Fe 6173 Å Doppler Signal. Sol. Phys. 271, 27. DOI. ADS.
- Greisen and Calabretta (2002) Greisen, E.W., Calabretta, M.R.: 2002, Representations of world coordinates in FITS. A&A 395, 1061. DOI. ADS.
- Hoeksema et al. (2014) Hoeksema, J.T., Liu, Y., Hayashi, K., Sun, X., Schou, J., Couvidat, S., Norton, A., Bobra, M., Centeno, R., Leka, K.D., Barnes, G., Turmon, M.: 2014, The Helioseismic and Magnetic Imager (HMI) Vector Magnetic Field Pipeline: Overview and Performance. Sol. Phys. 289, 3483. DOI. ADS.
- Kuhn, Lin, and Loranz (1991) Kuhn, J.R., Lin, H., Loranz, D.: 1991, Gain calibrating nonuniform image-array data using only the image data. PASP 103, 1097. DOI. ADS.
- Kuhn et al. (2012) Kuhn, J.R., Bush, R., Emilio, M., Scholl, I.F.: 2012, The Precise Solar Shape and Its Variability. Science 337, 1638. DOI. ADS.
- Liang et al. (2017) Liang, Z.-C., Birch, A.C., Duvall, T.L. Jr., Gizon, L., Schou, J.: 2017, Comparison of acoustic travel-time measurements of solar meridional circulation from SDO/HMI and SOHO/MDI. A&A 601, A46. DOI. ADS.
- Liu et al. (2012) Liu, Y., Hoeksema, J.T., Scherrer, P.H., Schou, J., Couvidat, S., Bush, R.I., Duvall, T.L., Hayashi, K., Sun, X., Zhao, X.: 2012, Comparison of Line-of-Sight Magnetograms Taken by the Solar Dynamics Observatory/Helioseismic and Magnetic Imager and Solar and Heliospheric Observatory/Michelson Doppler Imager. Sol. Phys. 279, 295. DOI. ADS.
- Pesnell, Thompson, and Chamberlin (2012) Pesnell, W.D., Thompson, B.J., Chamberlin, P.C.: 2012, The Solar Dynamics Observatory (SDO). Sol. Phys. 275, 3. DOI. ADS.
- Scherrer et al. (1995) Scherrer, P.H., Bogart, R.S., Bush, R.I., Hoeksema, J.T., Kosovichev, A.G., Schou, J., Rosenberg, W., Springer, L., Tarbell, T.D., Title, A., Wolfson, C.J., Zayer, I., MDI Engineering Team: 1995, The Solar Oscillations Investigation - Michelson Doppler Imager. Sol. Phys. 162, 129. DOI. ADS.
- Scherrer et al. (2012) Scherrer, P.H., Schou, J., Bush, R.I., Kosovichev, A.G., Bogart, R.S., Hoeksema, J.T., Liu, Y., Duvall, T.L., Zhao, J., Title, A.M., Schrijver, C.J., Tarbell, T.D., Tomczyk, S.: 2012, The Helioseismic and Magnetic Imager (HMI) Investigation for the Solar Dynamics Observatory (SDO). Sol. Phys. 275, 207. DOI. ADS.
- Schou et al. (2012a) Schou, J., Scherrer, P.H., Bush, R.I., Wachter, R., Couvidat, S., Rabello-Soares, M.C., Bogart, R.S., Hoeksema, J.T., Liu, Y., Duvall, T.L., Akin, D.J., Allard, B.A., Miles, J.W., Rairden, R., Shine, R.A., Tarbell, T.D., Title, A.M., Wolfson, C.J., Elmore, D.F., Norton, A.A., Tomczyk, S.: 2012a, Design and Ground Calibration of the Helioseismic and Magnetic Imager (HMI) Instrument on the Solar Dynamics Observatory (SDO). Sol. Phys. 275, 229. DOI. ADS.
- Schou et al. (2012b) Schou, J., Borrero, J.M., Norton, A.A., Tomczyk, S., Elmore, D., Card, G.L.: 2012b, Polarization Calibration of the Helioseismic and Magnetic Imager (HMI) onboard the Solar Dynamics Observatory (SDO). Sol. Phys. 275, 327. DOI. ADS.
- Toussaint, Harvey, and Toussaint (2003) Toussaint, R.M., Harvey, J.W., Toussaint, D.: 2003, Improved Convergence for CCD Gain Calibration Using Simultaneous-Overrelaxation Techniques. AJ 126, 1112. DOI. ADS.
- Wachter and Schou (2009) Wachter, R., Schou, J.: 2009, Inferring Small-Scale Flatfields from Solar Rotation. Sol. Phys. 258, 331. DOI. ADS.
- Wachter et al. (2012) Wachter, R., Schou, J., Rabello-Soares, M.C., Miles, J.W., Duvall, T.L., Bush, R.I.: 2012, Image Quality of the Helioseismic and Magnetic Imager (HMI) Onboard the Solar Dynamics Observatory (SDO). Sol. Phys. 275, 261. DOI. ADS.
- Zhao et al. (2012) Zhao, J., Couvidat, S., Bogart, R.S., Parchevsky, K.V., Birch, A.C., Duvall, T.L., Beck, J.G., Kosovichev, A.G., Scherrer, P.H.: 2012, Time-Distance Helioseismology Data-Analysis Pipeline for Helioseismic and Magnetic Imager Onboard Solar Dynamics Observatory (SDO/HMI) and Its Initial Results. Sol. Phys. 275, 375. DOI. ADS.
Appendix A Informational Tables Characterizing HMI Performance
sec:Appendix1
The following tables provide more detail than is presented in the main text about Dopplergram Recovery Rates and common Frame Lists.
A.1 HMI Dopplergram Recovery–72-Day Intervals
sec:72daytables
Helioseismology requires long uninterrupted time series to determine precise oscillation frequencies. A useful way to characterize the instrument performance is to determine for each 72-day time interval the fraction of good-quality observations recovered by the instrument. The HMI Level-1 mission success requirement for Data Completeness was to collect at least 95 % of all observations during 22 72-day continguous intervals.
Table \ireftable:72day_recovery shows the Dopplergram recovery rate for the first 37 72-day intervals of the HMI mission, from 30 April 2010 to 14 August 2017. Nominal HMI operations began 1 May 2010, but velocity data were collected early, starting 30 April 2010. For reference 30 April 2010 is MDI Day 6328. Perfect Dopplergrams are those with no QUALITY bits set, imperfect Dopplergrams are those with any bit set – most of which are usable for helioseismology. The percentage in the table is the fraction of all possible time slots for which a Dopplergram was recovered. There are 138,240 45-second time slots in each 72-day interval.
| 72-day | GONG | Start | End | # Perfect | # Imperfect | Number | Percent |
|---|---|---|---|---|---|---|---|
| Count | Months | Date | Date | Dopplergrams | Dopplergrams | Missing | Recovery |
| 1 | 153/154 | 30 Apr 2010 | 10 Jul 2010 | 136,034 | 1736 | 470 | 99.66 % |
| 2 | 155/156 | 11 Jul 2010 | 20 Sep 2010 | 133,524 | 2404 | 2312 | 98.33 % |
| 3 | 157/158 | 21 Sep 2010 | 01 Dec 2010 | 129,886 | 4315 | 4039 | 97.08 % |
| 4 | 159/160 | 02 Dec 2010 | 11 Feb 2011 | 135,088 | 1712 | 1440 | 98.96 % |
| 5 | 161/162 | 12 Feb 2011 | 24 Apr 2011 | 130,546 | 3176 | 4518 | 96.73 % |
| 6 | 163/164 | 25 Apr 2011 | 05 Jul 2011 | 136,141 | 1747 | 352 | 99.75 % |
| 7 | 165/166 | 06 Jul 2011 | 15 Sep 2011 | 134,567 | 2054 | 1619 | 98.83 % |
| 8 | 167/168 | 16 Sep 2011 | 26 Nov 2011 | 130,699 | 3251 | 4290 | 96.90 % |
| 9 | 169/170 | 27 Nov 2011 | 06 Feb 2012 | 134,547 | 2408 | 1285 | 99.07 % |
| 10 | 171/172 | 07 Feb 2012 | 18 Apr 2012 | 130,278 | 4007 | 3955 | 97.14 % |
| 11 | 173/174 | 19 Apr 2012 | 29 Jun 2012 | 135,801 | 2244 | 195 | 99.86 % |
| 12 | 175/176 | 30 Jun 2012 | 09 Sep 2012 | 135,210 | 1754 | 1276 | 99.08 % |
| 13 | 177/178 | 10 Sep 2012 | 20 Nov 2012 | 131,729 | 3065 | 3446 | 97.51 % |
| 14 | 179/180 | 21 Nov 2012 | 31 Jan 2013 | 135,983 | 1306 | 951 | 99.31 % |
| 15 | 181/182 | 01 Feb 2013 | 13 Apr 2013 | 131,594 | 3308 | 3338 | 97.59 % |
| 16 | 183/184 | 14 Apr 2013 | 24 Jun 2013 | 123,818 | 12,581 | 1841 | 98.67 % |
| 17 | 185/186 | 25 Jun 2013 | 04 Sep 2013 | 135,469 | 1473 | 1298 | 99.06 % |
| 18 | 187/188 | 05 Sep 2013 | 15 Nov 2013 | 131,065 | 3331 | 3844 | 97.22 % |
| 19 | 189/190 | 16 Nov 2013 | 26 Jan 2014 | 136,018 | 1308 | 914 | 99.34 % |
| 20 | 191/192 | 27 Jan 2014 | 08 Apr 2014 | 131,377 | 3079 | 3784 | 97.26 % |
| 21 | 193/194 | 09 Apr 2014 | 19 Jun 2014 | 135,026 | 1769 | 1445 | 98.95 % |
| 22 | 195/196 | 20 Jun 2014 | 30 Aug 2014 | 135,639 | 1438 | 1163 | 99.16 % |
| 23 | 197/198 | 31 Aug 2014 | 10 Nov 2014 | 131,737 | 3306 | 3197 | 97.69 % |
| 24 | 199/200 | 11 Nov 2014 | 21 Jan 2015 | 135,665 | 1459 | 1116 | 99.19 % |
| 25 | 201/202 | 22 Jan 2015 | 03 Apr 2015 | 130,286 | 3182 | 4772 | 96.55 % |
| 26 | 203/204 | 04 Apr 2015 | 14 Jun 2015 | 135,458 | 1285 | 1497 | 98.92 % |
| 27 | 205/206 | 15 Jun 2015 | 25 Aug 2015 | 135,361 | 1873 | 1006 | 99.27 % |
| 28 | 207/208 | 26 Aug 2015 | 05 Nov 2015 | 131,652 | 3053 | 3535 | 97.44 % |
| 29 | 209/210 | 06 Nov 2015 | 16 Jan 2016 | 133,338 | 2587 | 2315 | 98.33 % |
| 30 | 211/212 | 17 Jan 2016 | 28 Mar 2016 | 131,605 | 3306 | 3329 | 97.59 % |
| 31 | 213/214 | 29 Mar 2016 | 08 Jun 2016 | 134,934 | 2221 | 1085 | 99.22 % |
| 32 | 215/216 | 09 Jun 2016 | 19 Aug 2016 | 128,650 | 4683 | 4907 | 96.45 % |
| 33 | 217/218 | 20 Aug 2016 | 30 Oct 2016 | 130,822 | 3479 | 3939 | 97.15 % |
| 34 | 219/220 | 31 Oct 2016 | 10 Jan 2017 | 136,213 | 1842 | 185 | 99.87 % |
| 35 | 221/222 | 11 Jan 2017 | 23 Mar 2017 | 130,960 | 3820 | 3460 | 97.50 % |
| 36 | 223/224 | 24 Mar 2017 | 03 Jun 2017 | 135,716 | 1425 | 1099 | 99.21 % |
| 37 | 225/226 | 04 Jun 2017 | 14 Aug 2017 | 135,014 | 1944 | 1282 | 99.07 % |
| Total | 30 Apr 2010 | 14 Aug 2017 | 4,927,450 | 102,931 | 84,499 | 98.35 % |
A.2 Primary HMI Observing and Calibration Frame Lists
sec:MainSequences
The HMI Framelist Timeline Specification (FTS) specifies the sequence, timing, and instrument configuration for exposures in an observation. Each is given a unique identification number, the FTS ID. Table \ireftable:prime_framelists gives information about the primary observing and calibration frame lists used during the mission.
HMI has used two basic observing sequences since commencing regular operations. The Mod-C sequence (FTS IDs 1001 and 1021) was used throughout the prime mission to collect the standard data. On 13 April 2016, after the prime mission ended, HMI switched to a faster sequence, FTS ID 1022, also known as Mod L. The Mod-L sequence requires that images from both cameras be combined to determine the vector-field observables. The part of the frame list for the line-of-sight observables using Camera 2 did not change.
Various calibration sequences are taken on a regular basis to monitor the evolution of HMI performance. Note that while the JSOC does not keep most older HMI Level-1 data on-line, all of the calibration-related Level-1 data are copied into a data series hmi.lev1_cal, which is permanently on-line.
A more complete list of HMI framelists appears in Tables \ireftable:fts_summary1 and \ireftable:fts_summary2. of Appendix \irefsec:FTSTables
| Standard Observables Framelists | ||||
| FTS ID | Framelist | Duration | Description | When used |
| 1001 | obs_6Cv01 | 135 | Mod C – Standard sequence | 1 May – 13 December 2010 |
| 1020 | obs_6Av02 | 90 | Mod A – Standard sequence | Tested before 1 May 2010 |
| 1021 | obs_6Cv02 | 135 | Mod C – Standard sequence | 13 Dec 2010 – 13 Apr 2016 |
| 1022 | obs_6Lv02 | 90 | Mod L – Standard sequence | Since 13 April 2016 |
| 1026 | obs_10v02 | 150 | Mod A – Ten wavelengths | Tested 24 Oct 2014 |
| Daily, Weekly or Bi-weekly Calibration Framelists | ||||
| 2001 | cal_6Cv01 | 135 | Mod-C Darks, continuum, Calmode frames | Daily at 06:00UT and 18:00UT, 1 May – 13 Dec 2010 |
| 2021 | cal_6Cv02 | 135 | Mod-C Darks, continuum, Calmode frames | Daily at 06 and 18 UT, 13 Dec 2010 – 13 Apr 2016 |
| 2042 | cal_6Lv02 | 90 | Mod-L Darks, continuum, Calmode frames | Daily at 06 and 18 UT, Since 13 April 2016 |
| 3020 | focr_6Cv02 | 135 | Mod-C Reduced focus sweep | Run three times every four weeks, Until 13 April 2016 |
| 3021 | pzt_def_6Cv02 | 135 | Mod-C Obsmode PZT flat | Run twice per week, Until 13 April 2016 |
| 3022 | pzt_cal_6Cv02 | 135 | Mod-C Calmode PZT flat | Run once per week, Until 13 April 2016 |
| 3023 | focus_6Cv02 | 135 | Mod-C Full focus sweep | Run once every four weeks, Until 13 April 2016 |
| 3027 | det_cal_6Cv02 | 135 | Calmode detune sequence | Run once every two weeks (too long for a 90-second framelist) |
| 3040 | focr_6Lv02 | 90 | Mod-L Reduced focus sweep | Run 3 times every four weeks, Since 13 April 2016 |
| 3041 | pzt_def_6Lv02 | 90 | Mod-L Obsmode PZT flat | Run twice per week, Since 13 April 2016 |
| 3042 | pzt_cal_6Lv02 | 90 | Mod-L Calmode PZT flat | Run once per week, Since 13 April 2016 |
| 3043 | focus_6Lv02 | 90 | Mod-L Full focus sweep | Run once every four weeks, Since 13 April 2016 |
| Eclipse and Calibration-Maneuver Framelists | ||||
| 3003 | focus_6Cv01 | 135 | Full focus sweep | After Earth eclipses in 2010 |
| 3008 | focus_6Cv01 | 135 | Full focus sweep, repeating every nine minutes | After Earth eclipses in 2010 |
| 3012 | focr_6Cv01 | 135 | Reduced focus sweep, repeating every 45 minutes | After Earth eclipses in 2010 |
| 3028 | focus_6Cv02 | 135 | Full focus sweep, repeating every nine minutes | After Earth eclipses, 2011 – March 2016 |
| 3031 | focr_6Cv02 | 135 | Reduced focus sweep, repeating every 33 min 45 sec | After Earth eclipses, 2011 – March 2016 |
| 3128 | focus_6Lv02 | 90 | Full focus sweep, repeating every nine minutes | After Earth eclipses, since August 2016 |
| 3132 | focr_6Lv02 | 90 | Reduced focus sweep, repeating every 45 minutes | After Earth eclipses, since August 2016 |
| 4031 | focus_off_v02 | 45 | Reduced focus sweep for offpoint maneuvers | During HMI/AIA flat field and EVE FOV maneuvers |
| 4033 | rolldopic_v02 | 45 | Set of continuum filtergrams on side camera | During HMI roll maneuvers |
Appendix B Exposure Time and Filter-Wheel Delays
sec:FigureSupplement
Figures presented in this section provide more detail about the operation of some components.
B.1 Exposure Time
As described in Section \irefsec:throughput, the HMI exposure time is controlled by a mechanical shutter motor that rotates the cut-out sector of an otherwise opaque disk into place with a pause in the open position for a commanded time. The difference between the commanded and actual exposure time is monitored at three places in the image plane and the average over 12 exposures is displayed in the upper panel of Figure \ireffigure:camera2_quality for Camera 2. Camera 1 is similar. Typical exposures are 115 – 140 milleseconds. The lower panel shows a measure of the quality of the exposure, which is expressed as the exposure time divided by the standard deviation of the measured exposure times for 12 consecutive exposures. The exposure time can be specified to about 0.12 milleseconds with an observed rms scatter less than 25 microseconds over 45 seconds and a standard deviation of 13.2 microseconds, about a part in 10,000 of the typical exposure. The exposure-time noise is a few times less than the per-pixel photon noise. Individual exposure times are measured with a precision of 1 microseconds and an accuracy better than 4 microseconds; the actual exposure time is reported in the keyword EXPTIME and used in the data analysis pipeline. Shutter noise contributes directly to uncertainty in the observables, because the intensities are used to derive them. The HMI shutter is remarkably uniform and performs much better than the MDI shutter. The few outlier points in the figure occur during non-standard observing sequences.
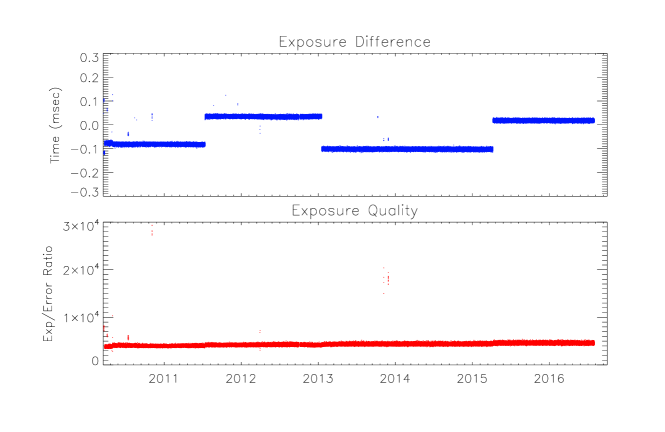
Figure \ireffigure:ps_delays shows the commanded delay for each of the three polarization selector (PS) wheels. The commanded delays indicate how long it takes for each polarization wheel to move from one selected filter-wheel position to another. Changes on longer time scales indicate changes in resistance or other mechanical issues. Sudden changes are indicative of changes in tuning of the instrument. PS 2 together with wavelength tuning (WT) selector 3 are redundant in case one of the wavelength tuners fails. Both are used infrequently.
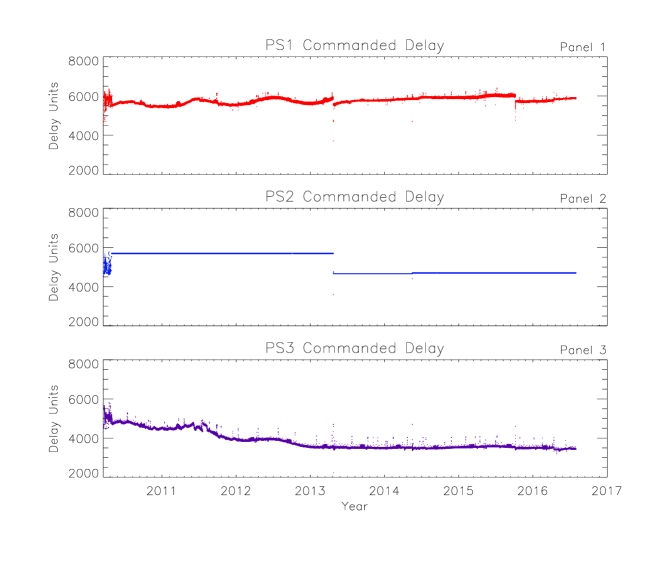
Figure \ireffigure:wt_delays shows the commanded delay for the four wavelength tuning filter wheels. WT 1 tunes the Narrow Band Michelson; WT 2 tunes the Wide-Band Michelson; WT 3 is between the two Michelsons and provides redundancy – it is seldom used; WT 4 tunes the final element of the Lyot Filter.
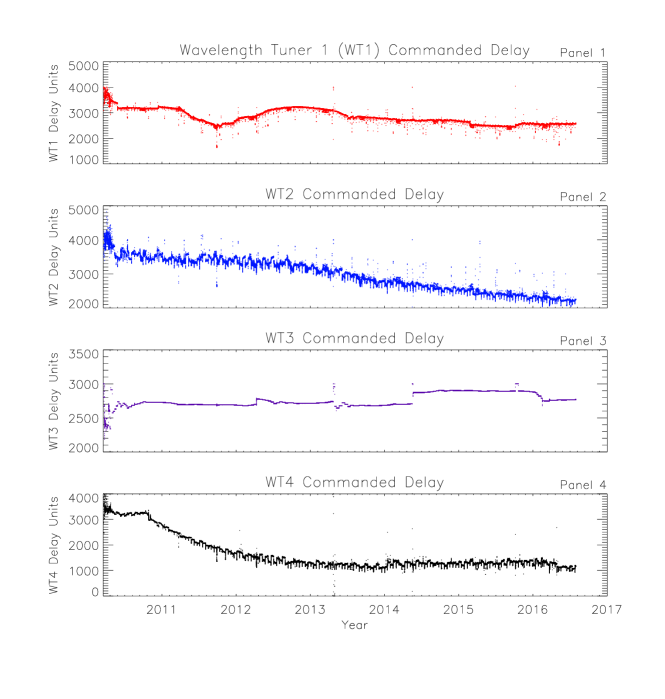
Appendix C Framelist and Filtergram IDs and Descriptions
sec:FTSTables
Tables \ireftable:fts_summary1 and \ireftable:fts_summary2 give information about all of the Framelist Timeline Specifications (FTSs) used by the HMI instrument. Frame lists define a sequence of filtergrams taken for a particular purpose. The duration is indicated in the table. The standard-observables frame list (e.g. 1021 or 1022), as well as most others that run only when specifically commanded, repeat continuously unless interrupted. Some calibration sequences (e.g. 2021 and 2042) operate on timers that interrupt the regular sequences and execute once at the scheduled repeat interval indicated in the table.
Table \ireftable:fid_summary identifies the Filtergram ID numbers (FIDs) for the various standard instrument tunings. Filtergrams from the standard observing sequence have five-digit FIDs in the range 10000 – 10199. The first (rightmost) digit indicates the polarization setting; the second and third digits give the wavelength tuning. Standard FIDs can be computed as:
| (2) |
where WL runs from 0 (the continuum) to 19 (the continuum on the other side of the central wavelength) and PL runs from 0 to 9 as described in the table. Filtergrams used for calibrations usually have four-digit FIDs, which are listed in the table.
| FTS ID | FrameList | Duration | Repeat | Description |
|---|---|---|---|---|
| [seconds] | ||||
| 1000 | obs_6Av01 | 90 | cont | Obs framelist, Mod A |
| 1001 | obs_6Cv01 | 135 | cont | Standard Mod-C framelist until 13 Dec 2010 |
| 1002 | obs_6Lv01 | 90 | cont | Obs framelist, Mod L |
| 1003 | obs_6Mv01 | 45 | cont | Obs framelist, Mod M |
| 1004 | obs_6Xv01 | 45 | cont | Obs framelist, Mod X |
| 1020 | obs_6Av02 | 90 | cont | Obs framelist, Mod A |
| 1021 | obs_6Cv02 | 135 | cont | Std. Mod-C framelist 13 Dec 2010 – 13 Apr 2016 |
| 1022 | obs_6Lv02 | 90 | cont | Std. Mod-L framelist after 13 Apr 2016 |
| 1023 | obs_6Mv02 | 45 | cont | Obs framelist, Mod M |
| 1024 | obs_6Xv02 | 45 | cont | Obs framelist, Mod X |
| 1025 | obs_8Av02 | 120 | cont | Obs framelist, Mod A, 8 wavelengths |
| 1026 | obs_10Av02 | 150 | cont | Obs framelist, Mod A, 10 wavelengths |
| 2000 | cal_6Cv01 | 135 | 24 hr | Daily calibration sequence |
| 2001 | cal_6Cv01 | 135 | 12 hr | Daily calibration sequence, 1 May - 13 Dec 2010 |
| 2002 | focr_6Cv01 | 135 | 12 hr | Reduced focus sequence |
| 2003 | focr_6Cv01 | 135 | 24 hr | Reduced focus sequence |
| 2004 | focr_6Cv01 | 135 | 2.4 hr | Reduced focus sequence |
| 2005 | focr_6Cv01 | 135 | 1.5 hr | Reduced focus sequence |
| 2020 | cal_6Cv02 | 135 | 24 hr | Cal sequence (darks, cont. tuned, Calmode frames) |
| 2021 | cal_6Cv02 | 135 | 12 hr | Daily cal seq. 13 Dec 2010 - 13 Apr 2016 |
| 2022 | focr_6Cv02 | 135 | 12 hr | Reduced focus sequence |
| 2023 | focr_6Cv02 | 135 | 24 hr | Reduced focus sequence |
| 2024 | focr_6Cv02 | 135 | 2.4 hr | Reduced focus sequence |
| 2025 | focr_6Cv02 | 135 | 1.5 hr | Reduced focus sequence |
| 2042 | cal_6Lv02 | 90 | 12 hr | Daily cal sequence after 13 Apr 2016 |
| 2043 | cal_6Lv02 | 90 | 1 hr | Hourly cal sequence, Mod L |
| 3000 | focr_6Cv01 | 135 | cont | Reduced focus sequence |
| 3001 | pzt_def_6Cv01 | 135 | cont | PZT flat-field sequence, Obsmode |
| 3002 | pzt_cal_6Cv01 | 135 | cont | PZT flat-field sequence, Calmode |
| 3003 | focus_6Cv01 | 135 | cont | Full focus sequence |
| 3004 | lin_def_6Cv01 | 135 | cont | Linearity test sequence, Obsmode |
| 3005 | lin_cal_6Cv01 | 135 | cont | Linearity test sequence, Calmode |
| 3006 | det_def_6Cv01 | 135 | cont | Detune sequence, Obsmode |
| 3007 | det_cal_6Cv01 | 135 | cont | Detune sequence, Calmode |
| 3020 | focr_6Cv02 | 135 | cont | Reduced focus sequence, mod C |
| 3021 | pzt_def_6Cv02 | 135 | cont | PZT flat-field sequence, Obsmode |
| 3022 | pzt_cal_6Cv02 | 135 | cont | PZT flat-field sequence, Calmode |
| 3023 | focus_6Cv02 | 135 | cont | Focus sequence |
| 3024 | lin_def_6Cv02 | 135 | cont | Linearity test sequence, Obsmode |
| 3025 | lin_cal_6Cv02 | 135 | cont | Linearity test sequence, Calmode |
| 3026 | det_def_6Cv02 | 135 | cont | Detune sequence, Obsmode |
| 3027 | det_cal_6Cv02 | 135 | cont | Detune sequence, Calmode |
| 3040 | focr_6Lv02 | 90 | cont | Reduced focus sequence, Mod L |
| 3041 | pzt_def_6Lv02 | 90 | cont | PZT flat-field sequence, Obsmode, Mod L |
| 3042 | pzt_cal_6Lv02 | 90 | cont | PZT flat-field sequence, Calmode, Mod L |
| 3043 | focus_6Lv02 | 90 | cont | Full focus sequence, Mod L |
| 3048 | cal_6Lv02 | 90 | cont | Mod L calibration sequence, continuous |
| FTS ID | Frame List | Duration | Repeat | Description |
|---|---|---|---|---|
| [seconds] | ||||
| 4000 | pzt_def | 45 | cont | 45s cadence PZT flat-field sequence, Obsmode |
| 4001 | pzt_cal | 45 | cont | 45s cadence PZT flat-field sequence, Calmode |
| 4002 | dop_ic_v01 | 45 | cont | Regular obs seq. on Cam 2; LCP/RCP continuum Cam 1 |
| 4003 | focus_off_v01 | 45 | cont | Focus sequence for offpoint maneuvers |
| 4004 | pl_wob_v01 | 135 | cont | Polarization wobble sequence |
| 4005 | wl_wob_v01 | 180 | cont | Wavelength wobble sequence |
| 4006 | loop_45 | 45 | cont | Continuous sequence of default filtergrams |
| 4007 | loop_90 | 90 | cont | Continuous sequence of default filtergrams |
| 4008 | loop_135 | 135 | cont | Continuous sequence of default filtergrams |
| 4009 | focus_8_14d | 45 | cont | Reduced focus sequence |
| 4010 | loop_led_45 | 45 | cont | Pre-launch calibration sequence |
| 4011 | focus_off_v02 | 45 | cont | Reduced focus sequence for offpoint maneuvers |
| 4012 | regulus_135 | 135 | cont | Regulus observing seq.; mix of std. and 3.2s exp. |
| 4013 | roll_dop_ic2 | 45 | cont | Roll maneuver seq., continuum filtergrams on Cam 1 |
| 4014 | cruc_offp_lin | 135 | cont | Linearity test sequence for EVE cruciform maneuver |
| 4015 | regulus_long | 135 | cont | Regulus observing seq. offpoint with 3.2s exp. |
| 4020 | pzt_def | 45 | cont | 45s cadence PZT flat-field sequence, Obsmode |
| 4021 | pzt_cal | 45 | cont | 45s cadence PZT flat-field sequence, Calmode |
| 4023 | focus_off_v01 | 45 | cont | Reduced focus sequence for offpoint maneuvers |
| 4024 | pl_wob_v02 | 135 | cont | Polarization wobble sequence |
| 4025 | wl_wob_v02 | 180 | cont | Wavelength wobble sequence |
| 4026 | loop_45 | 45 | cont | Continuous sequence of default filtergrams |
| 4027 | loop_90 | 90 | cont | Continuous sequence of default filtergrams |
| 4028 | loop_135 | 135 | cont | Continuous sequence of default filtergrams |
| 4029 | focus_8_14d | 45 | cont | Reduced focus sequence |
| 4030 | loop_led_45 | 45 | cont | Pre-launch calibration sequence |
| 4031 | focus_off_v02 | 45 | cont | Focus sequence for offpoint maneuvers |
| 4033 | rolldopic_v02 | 45 | cont | Roll man. seq., continuum filtergrams on Cam. 1 |
| 4034 | venus_2pl_v01 | 135 | cont | Venus transit – std. seq. Cam 2, 2 lin. pol. Cam 1 |
| 4035 | venus_4pl_v01 | 135 | cont | Venus transit – std. seq. Cam 2, 4 lin. pol. Cam 1 |
| 4036 | comet_ison | 135 | cont | Comet ISON seq., 600 ms exposures, default tuning |
| 4037 | rolldopic_v03 | 45 | cont | Roll maneuver seq., std. obs Cam 2, continuum Cam 1 |
| 4038 | rollicscn_v01 | 45 | cont | Roll seq., std. Cam 2, scan cont. to line-core Cam 1 |
| 4039 | merc_1pl_v01 | 45 | cont | Mercury transit, std. obs Cam 2, 1 lin. pol. Cam 1 |
| 4040 | cont6Lv01 | 90 | 30 min. | Std. Mod-L seq. with a set of continuum exp. |
| Standard Observing-Program FIDs | ||
| FID | PL Index | Polarization State |
| 10**0 | 410 | Mod A pol 1 |
| 10**1 | 411 | Mod A pol 2 |
| 10**2 | 412 | Mod A pol 3 |
| 10**3 | 413 | Mod A pol 4 |
| 10**4 | 414 | I+Q; linear polarization, 0 deg |
| 10**5 | 415 | I-Q; linear polarization, 90 deg |
| 10**6 | 416 | I+U; linear polarization, 45 deg |
| 10**7 | 417 | I-U; linear polarization, 135 deg |
| 10**8 | 418 | I+V; left circular polarization |
| 10**9 | 419 | I-V; right circular polarization |
| FID | WL Index | Wavelength |
|---|---|---|
| 1000* | 0xff00 | -344.0 mÅ |
| 1001* | 0xff01 | -309.6 mÅ |
| 1002* | 0xff02 | -275.2 mÅ |
| 1003* | 0xff03 | -240.8 mÅ |
| 1004* | 0xff04 | -206.4 mÅ |
| 1005* | 0xff05 | -172.0 mÅ |
| 1006* | 0xff06 | -137.6 mÅ |
| 1007* | 0xff07 | -103.2 mÅ |
| 1008* | 0xff08 | -68.9 mÅ |
| 1009* | 0xff09 | -34.4 mÅ |
| 1010* | 0xff0a | 0.0 mÅ |
| 1011* | 0xff0b | 34.4 mÅ |
| 1012* | 0xff0c | 68.8 mÅ |
| 1013* | 0xff0d | 103.2 mÅ |
| 1014* | 0xff0e | 137.6 mÅ |
| 1015* | 0xff0f | 172.0 mÅ |
| 1016* | 0xff10 | 206.4 mÅ |
| 1017* | 0xff11 | 240.8 mÅ |
| 1018* | 0xff12 | 275.2 mÅ |
| 1019* | 0xff13 | 309.6 mÅ |
| Calibration and Special-Observation FIDs | |
|---|---|
| FID | Description |
| 5000 | Regular dark frame |
| 5001 | Throwaway dark frame |
| 5002 | General image |
| 5003 | Linearity test |
| 5004 | Linearity test with darks |
| 5101 – 5116 | Focus-sequence filtergrams |
| 5117 | Calmode filtergram |
| Wavelength-Calibration FIDs | |
| 6000-6026 | Standard detune (100 – 126) |
| 6027-6030 | Extra positions for 31-frame detune |
| 6101-6196 | Wobble sequence (WLID=1 – 96) |
| 6201-6296 | Wobble + 20 sequence |
| Polarization-Calibration FIDs | |
| 7101-7172 | Wobble sequence (WLID=1 – 72) |
| 7201-7272 | Wobble sequence (WLID=175 – 246) |
Appendix D Level-0 FITS Keywords
sec:Lev0Keywords
Table \ireftable:level0_image_keywords lists the Level-0 keywords associated with details of the image.
Table \ireftable:level0_seq_keywords describes the Level-0 keywords associated with the status of the onboard Image Status Packet (ISP) sequencer.
Table \ireftable:level0_mech_keywords describes the Level-0 keywords associated with the status of the onboard mechanisms.
| Keyword | Type | Description |
|---|---|---|
| BLD_VERS | string | Build Version: from jsoc_version.h |
| ORIGIN | string | Constant: Location where file made - SDO/JSOC-SDP |
| DATE | time | Date and time of processing; ISO 8601 |
| TELESCOP | string | Constant: for HMI: SDO/HMI |
| INSTRUME | string | HMI light path: HMI_SIDE1 or HMI_FRONT2 |
| DATE-OBS | time | Date when observation started; ISO 8601 |
| T_OBS | time | Observation time |
| CAMERA | integer | HMI camera numeric identifier: 1 or 2 |
| IMG_TYPE | string | Image type: LIGHT or DARK |
| EXPTIME | double | Exposure duration: shutter open time in seconds |
| EXPSDEV | float | Exposure standard deviation in seconds |
| WAVELNTH | integer | Constant: for HMI = 6173.3 angstrom |
| WAVEUNIT | string | Constant: Wavelength unit = angstrom |
| FSN | integer | FSN - Filtergram Sequence Number |
| FID | integer | FID - Filtergram ID |
| TLMDSNAM | string | Telemety data series based on data packet time |
| IMGFPT | time | Time stamp of the first image data packet |
| IMGAPID | integer | Application ID of the science data packets |
| TAPCODE | integer | Take A Picture code for the camera readout |
| BITSELID | integer | Bit select ID; r value for the data compression |
| COMPID | integer | Compression ID; data compression n and k values |
| CROPID | integer | Crop table ID used in data downlink |
| LUTID | integer | Look-up table ID used in data downlink |
| NPACKETS | integer | Number of packets in image |
| NERRORS | integer | Number of decompression errors in image |
| EOIERROR | short | End Of Image error; Last pixel error occurred in image |
| HEADRERR | short | Header error occurred in image |
| OVERFLOW | short | Data overflow error occurred in image |
| QUALITY | integer | Quality keyword |
| TOTVALS | integer | Expected number of data values (pixels) in image |
| DATAVALS | integer | Actual number of data values in image |
| MISSVALS | integer | Missing values: TOTVALS - DATAVALS |
| PERCENTD | float | Percent data; DATAVALS / TOTVALS |
| DATAMIN | short | Minimum value of all pixels |
| DATAMAX | short | Maximum value of all pixels |
| DATAMEDN | short | Median value of all pixels |
| DATAMEAN | float | Mean value of all pixels |
| DATARMS | float | Rms deviation from the mean value of all pixels |
| DATASKEW | float | Skewness from the mean value of all pixels |
| DATAKURT | float | Kurtosis of all pixels |
| Keyword | Type | Description |
|---|---|---|
| ISPSNAME | string | Image Status Packet (ISP) series name |
| ISPPKTIM | time | Prime key value for the ISP record |
| ISPPKTVN | string | ISP packet version |
| HSQFGSN | integer | Unique serial number for each image (filtergram) taken |
| HSQFGID | integer | Filtergram identifier parameters |
| HCAMID | integer | Current light-path identifier |
| HSHIEXP | integer | Current shutter-exposure value in milliseconds |
| HOBITSEC | integer | TAI seconds of the shutter-move start time |
| HOBITSS | integer | Subseconds field of the shutter-move start time |
| HWLTNSET | string | Image Stabilization System (ISS) loop status |
| HSQSTATE | string | Sequencer state: IDLE, SELECTING, or PROCESSING |
| HSEQERR | string | Sequence error message of the last sequencer error |
| HFLREFTM | integer | Current framelist reference start time |
| HFLRELTM | integer | Current frame time: milliseconds from reference time |
| HFLID | integer | Framelist identification number |
| HOBLSTID | integer | Observation list identification number |
| HFLPSITN | integer | Position number of the current frame in framelist |
| HSQFCNT | integer | Number of frames taken after restarting the sequence |
| HFLLNGTH | short | Total number of frames in the current framelist (FTS) |
| HFLRPTCT | integer | Cadence periods to repeat for the current FTS |
| HFLRPTNM | integer | Repeat number of the active framelist |
| HFLSKPCT | integer | Cadence periods to skip for the current FTS |
| HFTSACID | integer | Identification number of the current active FTS |
| HFTSCDMK | integer | Number of cadence periods after restarting the sequence |
| HFTSINFO | integer | FTS status information |
| HSQEIDX | integer | Current exposure index number |
| HIMGCFID | integer | Current image configuration identification number |
| HCFTID | integer | Current focus position identification number |
| HPLTID | integer | Current polarization selector identification number |
| HWLTID | integer | Current the wavelength tuning identification number |
| HWLSTIDX | integer | Current wavelength set index number |
| HGP1RGST | integer | General purpose register 1 (set by command) |
| HGP2RGST | integer | General purpose register 2 (set by command) |
| Keyword | Type | Description |
|---|---|---|
| HSHMIOPB | float | Shutter timer open value for bottom position |
| HSHMIOPM | float | Shutter timer open value for middle position |
| HSHMIOPT | float | Shutter timer open value for top position |
| HSHMICLB | float | Shutter close timer value for bottom position |
| HSHMICLM | float | Shutter close timer value for middle position |
| HSHMICLT | float | Shutter close timer value for top position |
| HCF1ENCD | integer | Encoder value returned from CF1 mechanism |
| HCF2ENCD | integer | Encoder value returned from CF2 mechanism |
| HPS1ENCD | integer | Encoder value returned from PS1 mechanism |
| HPS2ENCD | integer | Encoder value returned from PS2 mechanism |
| HPS3ENCD | integer | Encoder value returned from PS3 mechanism |
| HWT1ENCD | integer | Encoder value returned from WT1 mechanism |
| HWT2ENCD | integer | Encoder value returned from WT2 mechanism |
| HWT3ENCD | integer | Encoder value returned from WT3 mechanism |
| HWT4ENCD | integer | Encoder value returned from WT4 mechanism |
| HCF1POS | integer | Commanded target position for CF1 mechanism |
| HCF2POS | integer | Commanded target position for CF2 mechanism |
| HPL1POS | integer | Commanded target position for PS1 mechanism |
| HPL2POS | integer | Commanded target position for PS2 mechanism |
| HPL3POS | integer | Commanded target position for PS3 mechanism |
| HWL1POS | integer | Commanded target position for WT1 mechanism |
| HWL2POS | integer | Commanded target position for WT2 mechanism |
| HWL3POS | integer | Commanded target position for WT3 mechanism |
| HWL4POS | integer | Commanded target position for WT4 mechanism |
Appendix E Level-0 QUALITY-Keyword Summary
sec:Lev0Qual
HMI uses a QUALITY keyword to describe properties of the data and data processing at each level of reduction. Generally a bit in the keyword is set only when there is a problem.
Table \ireftable:lev0_quality gives the meaning of the bits put into the QUALLEV0 keyword for each filtergram record in the Level-0 data series determined by the ingest_lev0 processing module. Bit 0 is the low bit (0x01)
| Quality | Bit Mask | Description |
|---|---|---|
| Q_OVFL | 0x00000001 | Overflow flag set |
| Q_HDRERR | 0x00000002 | Header error flag set |
| Q_CMPERR | 0x00000004 | Compression error in image |
| Q_LPXERR | 0x00000008 | Last pixel error |
| Q_NOISP | 0x00000010 | No ISP; FSN HSQFGSN |
| Q_MISSI | 0x00000020 | Missing image |
| Q_CORRUPT | 0x00000040 | Corrupt image; FSN=469769216 or 0x1c001c00 |
| Q_INVALTIME | 0x00000080 | HOBITSEC = 0; T_OBS = 1958.01.01_00:00:00_UTC |
| Q_MISS0 | 0x00000100 | MISSVALS 0 |
| Q_MISS1 | 0x00000200 | MISSVALS 0.01*TOTVALS |
| Q_MISS2 | 0x00000400 | MISSVALS 0.05*TOTVALS |
| Q_MISS3 | 0x00000800 | MISSVALS 0.25*TOTVALS |
| 0x00001000 | Unused | |
| 0x00002000 | Unused | |
| 0x00004000 | Unused | |
| Q_CAM_ANOM | 0x00008000 | Camera anomaly; entered manually |
| Q_DARK | 0x00010000 | Dark image |
| Q_ISSOPEN | 0x00020000 | ISS loop open; HWLTNSET = ’OPEN’ |
| Q_HCF1ENCD | 0x00040000 | Focus/Cal Motor 1 Error |
| HCF1ENCD HCF1POS 1 | ||
| Q_HCF2ENCD | 0x00080000 | Focus/Cal Motor 2 Error |
| HCF2ENCD HCF2POS 1 | ||
| Q_HPS1ENCD | 0x00100000 | Polarization Motor 1 Error |
| HPS1ENCD HPL1POS 1 | ||
| Q_HPS2ENCD | 0x00200000 | Polarization Motor 2 Error |
| HPS2ENCD HPL2POS 1 | ||
| Q_HPS3ENCD | 0x00400000 | Polarization Motor 3 Error |
| HPS3ENCD HPL3POS 1 | ||
| Q_HWT1ENCD | 0x00800000 | Wavelength Motor 1 Error |
| HWT1ENCD HWL1POS 1 | ||
| Q_HWT2ENCD | 0x01000000 | Wavelength Motor 2 Error |
| HWT2ENCD HWL2POS 1 | ||
| Q_HWT3ENCD | 0x02000000 | Wavelength Motor 3 Error |
| HWT3ENCD HWL3POS 1 | ||
| Q_HWT4ENCD | 0x04000000 | Wavelength Motor 4 Error |
| HWT4ENCD HWL4POS 1 | ||
| 0x08000000 | Unused | |
| Q_GPREGBIT0 | 0x10000000 | HGP1RGST bit 0 set |
| Q_GPREGBIT1 | 0x20000000 | HGP1RGST bit 1 set |
| Q_REOPENED | 0x40000000 | Image reopened during reconstruction |
| NPACKETS value may be incorrect | ||
| Q_MISSALL | 0x80000000 | Data is completely missing |
| High bit |
Appendix F Level-1 FITS Keywords
sec:Lev1Keywords
Table \ireftable:level1_wcs_orbit_keywords describes Level-1 keywords associated with WCS coordinates and SDO orbit parameters.
| Keyword | Type | Description |
|---|---|---|
| T_OBS_step | double | T_OBS step (constant); 1.000000 second |
| T_OBS_epoch | time | T_OBS epoch (constant); 1977.01.01_00:00:00_TAI |
| OSCNMEAN | float | Mean value of removed overscan rows |
| OSCNRMS | float | Rms deviation from the mean value of overscan rows |
| FLAT_REC | string | Flat field series record pointer |
| NBADPERM | integer | Count of permanent bad pixels |
| NBADTOT | integer | Count of total bad pixels |
| CTYPE1 | string | Typically HPLN-TAN (SOLARX) |
| CUNIT1 | string | Typically arcseconds |
| CRVAL1 | float | Image scale in the x direction; arcseconds/pixel |
| CDELT1 | float | Image scale in the x direction; arcseconds/pixel |
| CRPIX1 | float | Location of sun center in CCD x direction; pixel |
| CTYPE2 | string | Typically HPLT-TAN (SOLARY) |
| CUNIT2 | string | Typically arcseconds |
| CRVAL2 | float | Image scale in the x direction; arcseconds/pixel |
| CDELT2 | float | Image scale in the y direction; arcseconds/pixel |
| CRPIX2 | float | Location of sun center in CCD y direction; pixel |
| CROTA2 | float | INST_ROT + SAT_ROT; degrees |
| R_SUN | float | Radius of the Sun on the CCD detector; pixels |
| MPO_REC | string | Master Pointing series record pointer |
| INST_ROT | float | Master pointing CCD rotation wrt SDO Z axis; degrees |
| IMSCL_MP | float | Master pointing image scale; arcseconds/pixels |
| X0_MP | float | Master pointing X0 sun center in CCD frame; pixels |
| Y0_MP | float | Master pointing Y0 sun center in CCD frame; pixels |
| RSUN_LF | float | Limb fit Solar radius; pixels |
| X0_LF | float | Limb fit X0 sun center in CCD frame; pixels |
| Y0_LF | float | Limb fit Y0 sun center in CCD frame; pixels |
| CALVER32 | integer | Height of formation correction version |
| ASD_REC | string | Ancillary Science Data series record pointer |
| SAT_Y0 | float | Position of solar center wrt the SDO -Y axis; arcseconds |
| SAT_Z0 | float | Position of solar center wrt the SDO +Z axis; arcseconds |
| SAT_ROT | float | Angle of solar pole wrt the SDO +X axis; degrees |
| ACS_MODE | string | ACS pointing mode; ACS_AN_ACS_MODE |
| ACS_ECLP | string | ACS eclipse flag; ACS_AN_FLAG_CSS_ECLIPSE |
| ACS_SUNP | string | ACS sun presense flag; ACS_AN_FLAG_DSS_SUNPRES |
| ACS_SAFE | string | ACS safe hold flag; ACS_AN_FLAG_ACE_INSAFEHOLD |
| ACS_CGT | string | ACS Controlling Guide Telescope ID; ACS_AN_NUM_CGT |
| ORB_REC | string | Orbit vector series record pointer |
| DSUN_REF | double | Reference distance to Sun (constant): 149,597,870,691.0 m |
| DSUN_OBS | double | Distance from SDO to Sun center; m |
| RSUN_REF | double | Reference radius of the Sun (constant): 696,000,000.0 m |
| RSUN_OBS | double | Apparent radius of the Sun seen by SDO; arcseconds |
| GAEX_OBS | double | Geocentric Inertial X position; m |
| GAEY_OBS | double | Geocentric Inertial Y position; m |
| GAEZ_OBS | double | Geocentric Inertial Z position; m |
| HAEX_OBS | double | Heliocentric Inertial X position; m |
| HAEY_OBS | double | Heliocentric Inertial Y position; m |
| HAEZ_OBS | double | Heliocentric Inertial Z position; m |
| OBS_VR | double | Speed of observer in radial direction; m/s |
| OBS_VW | double | Speed of observer in solar-west direction; m/s |
| OBS_VN | double | Speed of observer in solar-north direction; m/s |
| CRLN_OBS | float | Carrington longitude of the observer; degrees |
| CRLT_OBS | float | Carrington latitude of the observer; degrees |
| CAR_ROT | integer | Carrington rotation number of CRLN_OBS |
| HGLN_OBS | float | Stonyhurst heliographic longitude of the observer; degrees |
| HGLT_OBS | float | Stonyhurst heliographic latitude of the observer; degrees |
Appendix G Level-1 QUALITY-Keyword Summary
sec:Lev1Qual
Table \ireftable:lev1_quality provides the meaning of the bits put into the Level-1 QUALITY keyword for each filtergram in the Level-1 data series by the build_lev1 processing module. Bit 0 is the low bit (0x01)
| Quality | Bit Mask | Description |
|---|---|---|
| Q_NOFLAT | 0x00000001 | Flat field not available or error |
| Q_NOORB | 0x00000002 | Orbit data not available or error |
| Q_NOASD | 0x00000004 | Ancillary science data not available or error |
| Q_NOMPD | 0x00000008 | Master pointing data not available or error |
| Q_NOLIMB | 0x00000010 | Limb fit error |
| 0x00000020 | Unused | |
| 0x00000040 | Unused | |
| Q_CAM_ANOM1 | 0x00000080 | Camera anomaly |
| Q_1_MISS0 | 0x00000100 | MISSVALS 0 |
| Q_1_MISS1 | 0x00000200 | MISSVALS TOTVALS |
| Q_1_MISS2 | 0x00000400 | MISSVALS TOTVALS |
| Q_1_MISS3 | 0x00000800 | MISSVALS TOTVALS |
| Q_NOACS_SCI | 0x00001000 | ACS_MODE ’SCIENCE’ |
| Q_ACS_ECLP | 0x00002000 | ACS_ECLP = ’YES’; spacecraft eclipse flag |
| Q_ACS_SUNP | 0x00004000 | ACS_SUNP = ’NO’; no sun presence |
| Q_ACS_SAFE | 0x00008000 | ACS_SAFE = ’YES’; safemode flag set |
| Q_IMG_TYPE | 0x00010000 | Dark image |
| Q_LOOP_OPEN | 0x00020000 | ISS Loop Open |
| Q_CAL_IMG | 0x00040000 | Calibration image |
| Q_CALM_IMG | 0x00080000 | HMI calibration mode image |
| Q_AIA_FOOR | 0x00100000 | Not used for HMI |
| Q_AIA_REGF | 0x00200000 | Not used for HMI |
| Q_THERM_RECOV | 0x00400000 | HMI thermal recovery |
| Q_LUNAR_TRAN | 0x00800000 | HMI lunar transit |
| 0x01000000 | Unused | |
| 0x02000000 | Unused | |
| 0x04000000 | Unused | |
| 0x08000000 | Unused | |
| 0x10000000 | Unused | |
| 0x20000000 | Unused | |
| Q_NRT | 0x40000000 | Near Real Time mode |
| Q_MISSALL | 0x80000000 | Image not available; high bit |
Appendix H HMI Observables QUALITY-Keyword Summary
sec:S_ObsQual
The keyword QUALITY is provided for each HMI data product at each processing level. Observables are constructed from many filtergrams, so QUALITY may depend on information from any of the contributing images.
Table \ireftable:Obs_quality describes QUALITY-bits for the 45-second Line-of-Sight (LoS) observables that indicate why a data record is missing. The value of QUALITY will be negative (top bit set) if data are missing for one of the reasons specified in certain other bits. LoS observables include 45-second Dopplergrams, line-of-sight magnetic field, line depth, and continuum intensity. Filtergrams at multiple wavelengths and polarization states from three consecutive 45-second intervals contribute to each data record. The 45-second observables depend on filtergrams only from Camera 2.
Data records with no known issues have QUALITY = 0. Bit 0 is the low bit (0x01).
Table \ireftable:Obs_quality2 provides similar information for the bits in the vector-observable QUALITY keyword. The primary observable is the Stokes data series hmi.S_720s. The temporal interpolation is much longer than for the 45-second data products, including data collected over a nearly 20-minute time span from one or both HMI cameras. The other HMI 720-second observables are computed from the Stokes observable, so share the same keyword.
Table \ireftable:Obs_quality3 provides information for the additional bits in the vector-observable QUALITY keyword for data that may be acceptable in certain circumstances, but may be of lesser quality due to inclusion of fewer filtergrams or noisier data.
| QUALITY-bit Name | Bit Mask | Description |
|---|---|---|
| QUAL_NODATA | 0x80000000 | No l.o.s. observables image was produced (empty record created, with NO DATA SEGMENT. Most keywords have default value) |
| QUAL_TARGETFILTERGRAMMISSING | 0x40000000 | No filtergram found near target time |
| QUAL_NOINTERPOLATEDKEYWORDS | 0x20000000 | Could not interpolate required keywords at target time |
| QUAL_NOFRAMELISTINFO | 0x10000000 | Could not identify observables framelist used |
| QUAL_WRONGCADENCE | 0x08000000 | Framelist cadence required time does not match the expected value |
| QUAL_WRONGTARGET | 0x04000000 | Target filtergram does not belong to the current framelist |
| QUAL_MISSINGLEV1D | 0x02000000 | Not enough lev1d filtergrams to produce observable |
| QUAL_MISSINGKEYWORDLEV1D | 0x01000000 | Could not read some required keywords in lev1d data |
| QUAL_WRONGWAVELENGTHNUM | 0x00800000 | Number of wavelengths in the lev1d records is incorrect |
| QUAL_MISSINGKEYWORDLEV1P | 0x00400000 | Could not read some required keywords in the lev1p data |
| QUAL_NOLOOKUPRECORD | 0x00200000 | Could not find a record for look-up tables for the MDI-like algorithm |
| QUAL_NOLOOKUPKEYWORD | 0x00100000 | Could not read keywords of the look-up tables for the MDI-like algorithm |
| QUAL_NOTENOUGHINTERPOLANTS | 0x00080000 | Not enough interpolation points for the temporal interpolation at a given wavelength and polarization |
| QUAL_INTERPOLATIONFAILED | 0x00040000 | Temporal interpolation failed (no lev1d record was produced) |
| QUAL_MISSINGLEV1P | 0x00020000 | Not enough lev1p records to produce an observable |
| QUAL_NOCOEFFKEYWORD | 0x00000200 | Could not read keywords of the polynomial coefficient series for the correction of the MDI-like algorithm |
| QUAL_NOCOEFFPRECORD | 0x00000080 | Could not find a record for the polynomial coefficient for the correction of the MDI-like algorithm, or could not access the keywords of a specific record |
| QUALITY-bit Name | Bit Mask | Description |
|---|---|---|
| QUAL_NODATA | 0x80000000 | Not all I Q U V filtergrams produced (Some or all data segments missing) |
| QUAL_TARGETFILTERGRAMMISSING | 0x40000000 | No target filtergram found near target time |
| QUAL_NOINTERPOLATEDKEYWORDS | 0x20000000 | Could not interpolate some required keywords at target time |
| QUAL_NOFRAMELISTINFO | 0x10000000 | Could not recognize observables framelist |
| QUAL_WRONGCADENCE | 0x08000000 | Cadence corresponding to the framelist does not match the expected value provided by user |
| QUAL_WRONGFRAMELISTSIZE | 0x04000000 | Current framelist size does not match value from the command line |
| QUAL_WRONGNPOL | 0x02000000 | Current framelist npol does not match value from the command line |
| QUAL_WRONGPOLTYPE | 0x01000000 | Current framelist does not allow for the production of I Q U V |
| QUAL_WRONGTARGET | 0x00800000 | Target filtergram does not belong to the current framelist |
| QUAL_ERRORFRAMELIST | 0x00400000 | Filtergrams not where they should be in the framelist |
| QUAL_WRONGWAVELENGTHNUM | 0x00200000 | Number of wavelengths in the lev1d records is not correct |
| QUAL_NOLOOKUPRECORD | 0x00100000 | Could not find record for look-up tables for MDI-like algorithm (currently unused) |
| QUAL_NOLOOKUPKEYWORD | 0x00080000 | Could not read keywords of look-up tables for MDI-like algorithm (currently unused) |
| QUAL_NOTENOUGHINTERPOLANTS | 0x00040000 | Not enough points for the temporal interpolation at a given wavelength and polarization |
| QUAL_INTERPOLATIONFAILED | 0x00020000 | temporal interpolation routine failed |
| QUALITY-bit Name | Bit Mask | Description |
|---|---|---|
| QUAL_LOWINTERPNUM | 0x00010000 | Too few averaging points or two interpolation points separated by more than the cadence |
| QUAL_LOWKEYWORDNUM | 0x00008000 | Some keywords (e.g. CROTA2, DSUN_OBS, and CRLT_OBS) could not be interpolated properly, closest-neighbor approximation used |
| QUAL_ISSTARGET | 0x00004000 | ISS Loop open for one or several filtergrams used to produce observable |
| QUAL_NOTEMP | 0x00002000 | Cannot read temperatures needed for polarization calibration (default temperature used) |
| QUAL_NOGAPFILL | 0x00001000 | Code could not properly gap-fill all Lev-1 filtergrams |
| QUAL_LIMBFITISSUE | 0x00000800 | Some Lev-1 records discarded because R_SUN, CRPIX1, or CRPIX2 were missing or too different from median |
| QUAL_NOCOSMICRAY | 0x00000400 | Some cosmic-ray hit lists could not be read for level 1 filtergrams |
| QUAL_ECLIPSE | 0x00000200 | At least one lev1 record taken during an eclipse |
| QUAL_LARGEFTSID | 0x00000100 | HFTSACID of target filtergram , which adds noise to observable |
| QUAL_TEMPERROR | 0x00000080 | Code error discovered that will be corrected in later processing versions, see notes at jsoc2.stanford.edu/doc/data/hmi/Quality_Bits |
| QUAL_POORQUALITY | 0x00000020 | WARNING poor quality: be careful when using due to eclipse, transit, thermal recovery, open ISS, or other… |