Gaia DR1 evidence of disrupting Perseus Arm
Abstract
We have discovered a clear sign of the disruption phase of the Perseus arm in the Milky Way using Cepheid variables, taking advantage of the accurately measured distances of Cepheids and the proper motions from Gaia Data Release 1. Both the Galactocentric radial and rotation velocities of 77 Cepheids within 1.5 kpc of the Perseus arm are correlated with their distances from the locus of the Perseus arm, as the trailing side is rotating faster and moving inward compared to the leading side. We also found a negative vertex deviation for the Cepheids on the trailing side, deg, in contrast to the positive vertex deviation in the solar neighborhood. This is, to our knowledge, the first direct evidence that the vertex deviation around the Perseus arm is affected by the spiral arm. We compared these observational trends with our -body/hydrodynamics simulations based on a static density-wave spiral scenario and those based on a transient dynamic spiral scenario. Although our comparisons are limited to qualitative trends, they strongly favor a conclusion that the Perseus arm is in the disruption phase of a transient arm.
Subject headings:
Galaxy: kinematics and dynamics — Galaxy: structure — methods: numerical — astrometry1. Introduction
How spiral arms in disk galaxies are created and maintained has been a long-standing question in galactic astronomy. For isolated disk galaxies there are two different theories of spiral arms which have different lifetimes (Dobbs & Baba, 2014). The quasi-stationary density wave theory (hereafter SDW arm) characterises spirals as rigidly rotating, long-lived wave patterns (i.e., 1 Gyr; Lin & Shu, 1964; Bertin & Lin, 1996). On the other hand, dynamic spiral theory (hereafter DYN arm) suggests spiral arms are differentially rotating, transient, recurrent patterns on a relatively short time scale, 100 Myr (Sellwood & Carlberg, 1984; Baba et al., 2009; Fujii et al., 2011; Grand et al., 2012b, a; Baba et al., 2013; D’Onghia et al., 2013; Baba, 2015).
Because a DYN arm is almost co-rotating with the stars at every radii, -body simulation studies show that there should be a characteristic gas and stellar motion affected by the spiral arms (Grand et al., 2012b, 2016; Baba et al., 2013). Kawata et al. (2014) suggested that comparing the stellar velocity properties between the trailing and leading side of a spiral arm would provide crucial information regarding its origin (see also Hunt et al., 2015). The Gaia mission (Gaia Collaboration et al., 2016b) recently published its first data release (DR1; Gaia Collaboration et al., 2016a), including the proper motions and parallaxes for two million bright stars in common with the Tycho-2 catalogue, known as the Tycho-Gaia astrometric solution (TGAS; Michalik et al., 2015; Lindegren et al., 2016). Hunt et al. (2017) reached a tentative conclusion favoring a DYN arm by finding a group of stars whose Galactocentric rotation velocity is unexpectedly high owing to the torque from the Perseus arm. However, the feature was observed in stars in the solar neighbourhood (distance kpc) which is still far away from the Perseus arm. Hence, it is difficult to conclude whether or not this feature is due to the Perseus arm.
Here we investigate kinematics of Cepheid variables. They are bright variable stars and their distances are accurately measured thanks to their well-calibrated period-luminosity relation (Inno et al., 2013). Cepheids are also young stars whose ages are expected to be around Myr (Bono et al., 2005). Such young stars are expected to have small velocity dispersion, and it is easier to find a systematic motion due to dynamical effects if it exists. Moreover, the age range of Cepheids is comparable to the lifetime of the DYN arm, and thus they are expected to be sensitive to the dynamical state of the spiral arms. Hence, Cepheids are a great tracer for testing the spiral arm scenario (see also Fernández et al., 2001; Griv et al., 2017). Thus, this Letter uses Cepheids around the Perseus arm to study the dynamical state of the Perseus arm.
2. Peculiar Motions of Cepheids
We selected a sample of Cepheids in Genovali et al. (2014) where the distances were determined homogeneously by using near-infrared photometric data sets (also see Inno et al., 2013). Errors in distance modulus are estimated by Genovali et al. (2014) to be 0.05–0.07 mag for most of the Cepheids. We then cross-matched this sample with the TGAS catalog and with a sample of Cepheids whose radial velocity are provided in Mel’nik et al. (2015) using TOPCAT (Taylor, 2005), giving a collection of 206 Cepheids with known locations and kinematics. We further limit the sample based on vertical position with respective to the Sun, kpc, where to take into account the error we define kpc, where , , and are the Galactic latitude, the distance modulus and its error in magnitude, respectively. This limit was applied to eliminate clear outliers, although our sample shows a clear concentration around the Galactic plane, with more than 70 % being located within 100 pc, as expected for young stars like Cepheids.
To eliminate the data with a large velocity or distance uncertainty, we discard the data whose uncertainty in velocity, , is larger than 20 km s-1, where , and are the uncertainties of the velocity measurements in the direction of longitude, , latitude, , and heliocentric radial velocity, . and are computed by taking the standard deviation of the Monte-Carlo (MC) sampling of and , computed for randomly selected right ascension (RA) and declination (DEC) proper motions, using the 2D Gaussian probability distribution with their measured mean, standard error and correlation between the RA and DEC proper motions, and distance from the Gaussian probability distribution of distance modulus with the mean of and a standard deviation of . These selections left 191 Cepheids in our sample.
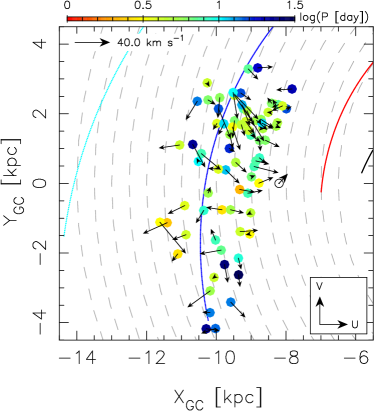
From this sample, we choose Cepheids around the Perseus arm. We adopt the position of the Perseus arm locus as determined by Reid et al. (2014), which provides the distance and angle to the reference point from the Sun and the pitch angle of the locus of the arm. We computed the mean distance, but projected on the Galactic plane, between the closest point of the locus of the Perseus arm and the Cepheids in our sample, , by MC sampling of the distance modulus for Cepheids and the distance between the Sun and the Galactic center of kpc (Bland-Hawthorn & Gerhard, 2016)111In our MC sampling, for simplicity we fixed the pitch angle, but only changed the Galactocentric radius of the reference point of the Perseus arm for a sampled , although the pitch angle also depends on .. We selected Cepheids within kpc, which results in a final catalogue of 77 Cepheids (see Figure 1).
We compute the Galactocentric radial velocity, , and rotation velocity, , after subtracting the circular velocity of the disk at the location of each Cepheid. Again, we used 10,000 MC samples to estimate the uncertainties of , and , taking into account the mean and uncertainties of the distance modulus and proper motion for individual Cepheids and all the relevant Galactic parameters, such as kpc, the angular velocity of the Sun with respect to the Galactic center, km s-1 kpc-1, the solar peculiar motion with respect to the Local Standard of the Rest, () km s-1 (Bland-Hawthorn & Gerhard, 2016) and the radial gradient of circular velocity, km s-1 kpc-1 (Feast & Whitelock, 1997). We take the mean and standard deviation of , and from the MC sample.
| Cepheids (number) | SDW ( kpc) | SDW ( kpc) | DYN ( Gyr) | DYN ( Gyr) | |
|---|---|---|---|---|---|
| Corr. | (77) | ||||
| Corr. | (77) | ||||
| Trailing side ( kpc) | |||||
| (km s-1) | (47) | ||||
| (km s-1) | (47) | ||||
| (deg) | (47) | ||||
| Leading side ( kpc) | |||||
| (km s-1) | (16) | ||||
| (km s-1) | (16) | ||||
| (deg) | (16) | ||||
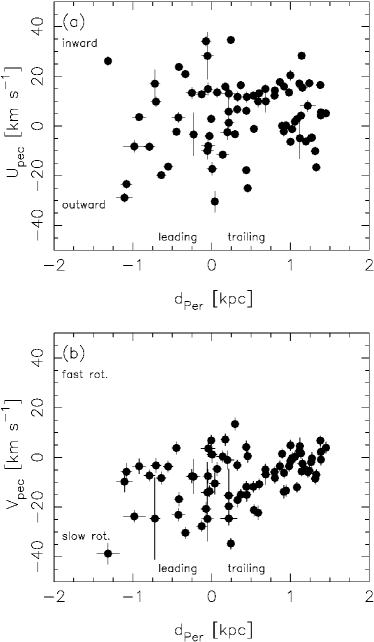
We first look at the correlation coefficients between and and between and . As shown in Figures 2a,b, there is a significant positive correlation for both and against . We measure the correlations for each MC sampling described above, and take the mean and dispersion of the measurements. Table 1 shows the correlation is statistically significant even after taking into account the observational errors and uncertainties of the Galactic parameters. The correlation is stronger in than .
Following the idea of Kawata et al. (2014), we compared the velocity distribution of 47 Cepheids on the trailing side (defined as kpc) and that of 16 Cepheids on the leading side ( kpc) of the Perseus arm222We excluded Cepheids within kpc considering the uncertainty of the locus of the Perseus arm.. We found a significant offset in the mean velocity of these samples as expected from the correlation with (see also Table 1). The mean velocity in both and is higher on the trailing side. To our knowledge, these results are the first statistically significant observational evidence of the difference in dynamical properties of stars on different sides of the spiral arm.
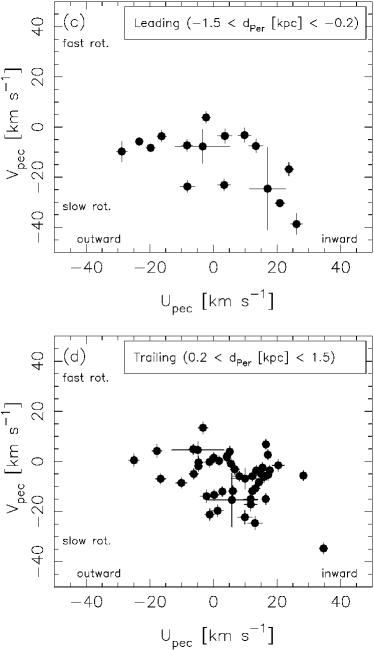
Furthermore, we calculated the vertex deviation, (including the correction term suggested by Vorobyov & Theis, 2008, for the case of ), where is the covariance between and , for the sample on the trailing and leading sides (see their - distribution in Figures 2c,d). The results are summarized in Table 1. On the leading side, the number of Cepheids in the sample is too small to measure confidently. On the trailing side, in contrast, the vertex deviation is clearly negative, which is opposite to the positive one (about deg) of the young stars in the local solar neighborhood (e.g. Dehnen & Binney, 1998; Rocha-Pinto et al., 2004). To our knowledge, this is the first detection of the change of sign of the vertex deviation near the spiral arms. Such a change is expected in various spiral arm models (Roca-Fàbrega et al., 2014).
Finally, we discuss the effect of interstellar reddening and extinction considering its importance for the objects in the disk (Matsunaga, 2017). Inno et al. (2013) assumed the total-to-selective reddening ratio of Cardelli et al. (1989), which is different from some of the recent values (e.g. Nishiyama et al., 2006; Alonso-García et al., 2017). The reddenings of the Cepheids around the Perseus arm are, however, relatively small, mag, and the uncertainty caused by the extinction law (up to 7 % in distance) does not change our results.
3. Dynamical Nature of the Perseus Arm
We compare our findings with -body/hydrodynamic simulations with different spiral models. The simulations include self-gravity, radiative cooling, star formation, and stellar feedback (Saitoh et al., 2008; Saitoh & Makino, 2009). The DYN arm model is a barred spiral galaxy formed from an initial axisymmetric model, spontaneously. The bar is an almost stable pattern, but the amplitudes, pitch angles, and rotational frequencies of the spiral arms change within a few hundred million years (Baba, 2015). The SDW models are from Baba et al. (2016) and have a rigidly rotating two-armed spiral (external potential) with a pitch angle of deg and a spiral amplitude of %. To study the impact of the location of the co-rotation radius (), we used two SDW models with kpc (e.g. Fernández et al., 2001) and 16 kpc (e.g. Lin et al., 1969).
To compare the simulations with the observational data, we have applied the same analysis as Section 2 for the simulations. First we identify a spiral arm similar to the Perseus arm in terms of the Galactocentric radial range. Then, we selected young star particles (– Myr) around the arm which are located in a radial and azimuthal range similar to that of our Cepheids sample. Note that the pitch angle of our SDW models are not tuned to match the Perseus arm, but the one to best explain both the Scutum and Perseus arms with a single pitch angle. Also, the pitch angle of the DYN model is changing as time goes on. Thus, for both SDW and DYN models we measure the distance of the particles from the gas arm (to be consistent with the identification of the arm by the star forming regions in Reid et al., 2014), , irrespective of the pitch angles of the spiral arms, and consider it same as for our Cepheids data analysis. The results of the simulations are summarized in Table 1, and are shown in Figure 3.
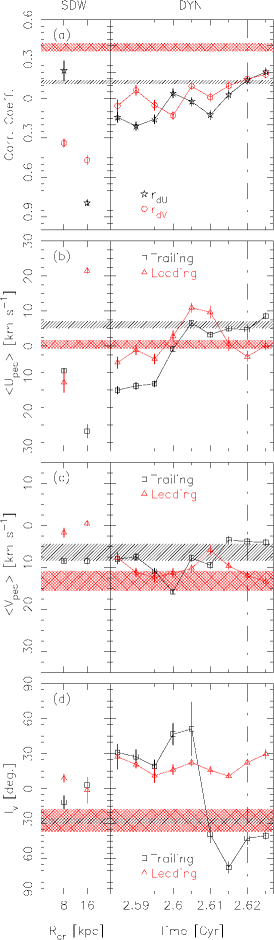
We first compare the observation with the SDW models. As shown in left side panels of Figure 3, SDW() reproduces none of the observed trend, suggesting that this model is clearly rejected. On the other hand, SDW() shows some degree of success in the positive correlation coefficient of - (Figure 3a) and a negative vertex deviation in the trailing side (Figure 3d). However, this model fails to reproduce the positive correlation in - (Figure 3a). Hence, we conclude that irrespective of (i.e., the pattern speed), it is difficult for the SDW models to explain the observed features in Section 2. This does not mean that we can reject the SDW scenario. Indeed, we have not explored models of different pitch angles and/or different strength of the arms; moreover, our SDW models do not include the bar, which is likely to affect the dynamical features (e.g. Monari et al., 2016). Although these different kinds of models need to be tested against our observed Cepheid kinematics, the SDW spiral models tend to show a regular trend in stellar kinematics around the spiral arms (e.g. Roca-Fàbrega et al., 2014; Pasetto et al., 2016; Antoja et al., 2016). We therefore expect that the positive correlation of - is difficult to obtain in the SDW model alone.
We then compare the DYN model with the observations. The right side panels of Figure 3 show the results around a spiral arm which grew and was disrupted around and Gyr (indicated with vertical dot-dashed lines), respectively. As shown in Baba et al. (2013) and Grand et al. (2014), the kinematic properties of the stars around the DYN spiral arms change with time. As a result, the growing phase of the DYN arm (at Gyr) is not consistent with the observed properties.
Among our models, the disruption phase (at Gyr) of the DYN arm is qualitatively the best at reproducing the observed trends. The correlation coefficients between velocity are both positive as observed, although the correlation is stronger for - in the observational data (Figure 3a). As shown in Figures 3b and 3c, both and are also in good agreement with our observational results, and the trailing side shows higher values than the leading side. The observed negative vertex deviation is also reproduced in the trailing side. On the other hand, the leading side shows less sensitivity of vertex deviation to the phase of the DYN arm, i.e. always positive, which is inconsistent with our observed trend (Figure 3d). However, the measurement of vertex deviation in the leading side is less reliable. Hence, the disruption phase of the DYN arm shows qualitative agreement with the high-confidence results of our Cepheid data. Considering that our -body simulations are still far from the real Milky Way because of lack of physical processes and lack of observational constraints, it is striking to find this level of agreement between the disruption phase of our simulated DYN arm and the observed trends found in our Cepheid data. We therefore conclude that the disruption phase of a DYN spiral arm like seen in our simulation, is the most likely scenario for the Perseus arm in the Milky Way.
It is known that the age of Cepheids is well correlated with their pulsation period () (e.g. Bono et al., 2005). We color coded Cepheids by in Figure 1. We found no clear correlation between the age of Cepheids with the position with respect to the arm. The SDW scenario predicts a clear correlation between the age of stars and the distance from the arm (e.g. Dobbs & Pringle, 2010). Hence, this is also against the prediction from the SDW scenario, but more consistent with the DYN arm scenario (e.g. Grand et al., 2012a).
Interestingly, according to Reid et al. (2014), the pitch angle of the Perseus arm ( deg) is smaller than the Scutum arm ( deg), which is the other major arm. -body simulations of DYN arms predict that the pitch angle of spiral arms in the disruption phase would be smaller, because the arms are winding and disrupting (Baba et al., 2013; Grand et al., 2013). Therefore, if the Perseus arm does indeed have a small pitch angle, it is also consistent with the arm being in the disruption phase. We will further test the disruption phase scenario of the Perseus arm with the future Gaia data releases.
References
- Alonso-García et al. (2017) Alonso-García, J. et al. 2017, ApJ, 849, L13
- Antoja et al. (2016) Antoja, T., Roca-Fàbrega, S., de Bruijne, J., & Prusti, T. 2016, A&A, 589, A13
- Baba (2015) Baba, J. 2015, MNRAS, 454, 2954
- Baba et al. (2009) Baba, J., Asaki, Y., Makino, J., Miyoshi, M., Saitoh, T. R., & Wada, K. 2009, ApJ, 706, 471
- Baba et al. (2016) Baba, J., Morokuma-Matsui, K., Miyamoto, Y., Egusa, F., & Kuno, N. 2016, MNRAS, 460, 2472
- Baba et al. (2013) Baba, J., Saitoh, T. R., & Wada, K. 2013, ApJ, 763, 46
- Bertin & Lin (1996) Bertin, G., & Lin, C. C. 1996, Spiral structure in galaxies a density wave theory, ed. G. Bertin & C. C. Lin
- Bland-Hawthorn & Gerhard (2016) Bland-Hawthorn, J., & Gerhard, O. 2016, ARA&A, 54, 529
- Bono et al. (2005) Bono, G., Marconi, M., Cassisi, S., Caputo, F., Gieren, W., & Pietrzynski, G. 2005, ApJ, 621, 966
- Bovy (2015) Bovy, J. 2015, ApJS, 216, 29
- Cardelli et al. (1989) Cardelli, J. A., Clayton, G. C., & Mathis, J. S. 1989, ApJ, 345, 245
- Dehnen & Binney (1998) Dehnen, W., & Binney, J. J. 1998, MNRAS, 298, 387
- Dobbs & Baba (2014) Dobbs, C., & Baba, J. 2014, PASA, 31, 35
- Dobbs & Pringle (2010) Dobbs, C. L., & Pringle, J. E. 2010, MNRAS, 409, 396
- D’Onghia et al. (2013) D’Onghia, E., Vogelsberger, M., & Hernquist, L. 2013, ApJ, 766, 34
- Feast & Whitelock (1997) Feast, M., & Whitelock, P. 1997, MNRAS, 291, 683
- Fernández et al. (2001) Fernández, D., Figueras, F., & Torra, J. 2001, A&A, 372, 833
- Fujii et al. (2011) Fujii, M. S., Baba, J., Saitoh, T. R., Makino, J., Kokubo, E., & Wada, K. 2011, ApJ, 730, 109
- Gaia Collaboration et al. (2016a) Gaia Collaboration et al. 2016a, A&A, 595, A2
- Gaia Collaboration et al. (2016b) —. 2016b, A&A, 595, A1
- Genovali et al. (2014) Genovali, K. et al. 2014, A&A, 566, A37
- Grand et al. (2012a) Grand, R. J. J., Kawata, D., & Cropper, M. 2012a, MNRAS, 426, 167
- Grand et al. (2012b) —. 2012b, MNRAS, 421, 1529
- Grand et al. (2013) —. 2013, A&A, 553, A77
- Grand et al. (2014) —. 2014, MNRAS, 439, 623
- Grand et al. (2016) Grand, R. J. J. et al. 2016, MNRAS, 460, L94
- Griv et al. (2017) Griv, E., Hou, L.-G., Jiang, I.-G., & Ngeow, C.-C. 2017, MNRAS, 464, 4495
- Hunt et al. (2015) Hunt, J. A. S., Kawata, D., Grand, R. J. J., Minchev, I., Pasetto, S., & Cropper, M. 2015, MNRAS, 450, 2132
- Hunt et al. (2017) Hunt, J. A. S., Kawata, D., Monari, G., Grand, R. J. J., Famaey, B., & Siebert, A. 2017, MNRAS, 467, L21
- Inno et al. (2013) Inno, L. et al. 2013, ApJ, 764, 84
- Kawata et al. (2014) Kawata, D., Hunt, J. A. S., Grand, R. J. J., Pasetto, S., & Cropper, M. 2014, MNRAS, 443, 2757
- Lin & Shu (1964) Lin, C. C., & Shu, F. H. 1964, ApJ, 140, 646
- Lin et al. (1969) Lin, C. C., Yuan, C., & Shu, F. H. 1969, ApJ, 155, 721
- Lindegren et al. (2016) Lindegren, L. et al. 2016, A&A, 595, A4
- Matsunaga (2017) Matsunaga, N. 2017, in European Physical Journal Web of Conferences, Vol. 152, European Physical Journal Web of Conferences, 01007
- Mel’nik et al. (2015) Mel’nik, A. M., Rautiainen, P., Berdnikov, L. N., Dambis, A. K., & Rastorguev, A. S. 2015, Astronomische Nachrichten, 336, 70
- Michalik et al. (2015) Michalik, D., Lindegren, L., & Hobbs, D. 2015, A&A, 574, A115
- Monari et al. (2016) Monari, G., Famaey, B., Siebert, A., Grand, R. J. J., Kawata, D., & Boily, C. 2016, MNRAS, 461, 3835
- Nishiyama et al. (2006) Nishiyama, S. et al. 2006, ApJ, 638, 839
- Pasetto et al. (2016) Pasetto, S., Natale, G., Kawata, D., Chiosi, C., Hunt, J. A. S., & Brogliato, C. 2016, MNRAS, 461, 2383
- Reid et al. (2014) Reid, M. J. et al. 2014, ApJ, 783, 130
- Roca-Fàbrega et al. (2014) Roca-Fàbrega, S., Antoja, T., Figueras, F., Valenzuela, O., Romero-Gómez, M., & Pichardo, B. 2014, MNRAS, 440, 1950
- Rocha-Pinto et al. (2004) Rocha-Pinto, H. J., Flynn, C., Scalo, J., Hänninen, J., Maciel, W. J., & Hensler, G. 2004, A&A, 423, 517
- Saitoh et al. (2008) Saitoh, T. R., Daisaka, H., Kokubo, E., Makino, J., Okamoto, T., Tomisaka, K., Wada, K., & Yoshida, N. 2008, PASJ, 60, 667
- Saitoh & Makino (2009) Saitoh, T. R., & Makino, J. 2009, ApJ, 697, L99
- Sellwood & Carlberg (1984) Sellwood, J. A., & Carlberg, R. G. 1984, ApJ, 282, 61
- Taylor (2005) Taylor, M. B. 2005, in Astronomical Society of the Pacific Conference Series, Vol. 347, Astronomical Data Analysis Software and Systems XIV, ed. P. Shopbell, M. Britton, & R. Ebert, 29
- Vorobyov & Theis (2008) Vorobyov, E. I., & Theis, C. 2008, MNRAS, 383, 817