Little Blue Dots in the Hubble Space Telescope Frontier Fields: Precursors to Globular Clusters?
Abstract
Galaxies with stellar masses and specific star formation rates yr-1 were examined on images of the Hubble Space Telescope Frontier Field Parallels for Abell 2744 and MACS J0416.1-02403. They appear as unresolved “Little Blue Dots” (LBDs). They are less massive and have higher sSFR than “blueberries” studied by Yang et al. (2017) and higher sSFR than “Blue Nuggets” studied by Tacchella et al. (2016). We divided the LBDs into 3 redshift bins and, for each, stacked the B435, V606, and I814 images convolved to the same stellar point spread function (PSF). Their radii were determined from PSF deconvolution to be to pc. The high sSFR suggest that their entire stellar mass has formed in only 1% of the local age of the universe. The sSFRs at similar epochs in local dwarf galaxies are lower by a factor of . Assuming that the star formation rate is for efficiency , gas mass , and free fall time, , the gas mass and gas-to-star mass ratio are determined. This ratio exceeds 1 for reasonable efficiencies, and is likely to be even with a high of 0.1. We consider whether these regions are forming today’s globular clusters. With their observed stellar masses, the maximum likely cluster mass is , but if star formation continues at the current rate for Myr before feedback and gas exhaustion stop it, then the maximum cluster mass could become .
Subject headings:
stars: formation — globular clusters: general — galaxies: formation — galaxies: starburst — galaxies: star formationI. Introduction
Large-scale deep surveys have recently enabled studies of smaller galaxies at higher redshifts. “Green peas” discovered from citizen science examinations (Cardamone et al., 2009) of the Sloan Digital Sky Survey (SDSS) are luminous compact low mass () galaxies with high specific star formation rates (sSFR), yr-1. They are thought to be local analogs of Lyman emitters (LAEs), which are low-mass high star formation galaxies that are increasingly common at . Recently, a search in SDSS for even lower mass local counterparts revealed “blueberries,” which are small starburst galaxies less than 1 kpc in diameter with to 7.5; they are a faint extension of the green peas (Yang et al., 2017).
Here we report the discovery of even lower mass galaxies in the Hubble Space Telescope (HST) Frontier Fields Parallels for Abell 2744 and MACS J0416.1-2403. Their properties suggest they could be dwarf galaxies like those proposed to be the formation sites of today’s low-metallicity globular clusters (Elmegreen et al., 2012; Leaman et al., 2013). Their selection and properties are discussed in Section II and their implications for galaxy formation and globular clusters are in Section III. A conclusion is in Section IV.
II. Data and Results
The Frontier Fields comprise six galaxy clusters and six corresponding parallel fields with deep HST imaging at optical (ACS camera) through near-infrared (WFC3 camera) wavelengths. Archival data of two Frontier Field Parallels, Abell 2744 and MACSJ0416.1-2403, were used for this study. Abell 2744 Parallel (heareafter A2744) and MACSJ0416.1-2401 Parallel (heareafter M0416) have publicly available Frontier Fields Catalogues with tabulated photometry (Merlin et al., 2016) and photometric redshifts, masses, and star formation rates (SFR) (Castellano et al., 2016). They are available through the ASTRODEEP site111www.astrodeep.edu. There are 3411 cataloged galaxies in A2744 and 3732 in M0416. For our analysis we used images in the F435W, F606W, F814W and F160W passbands (hereafter, ). The images reach AB mag in these two fields. They span pixels; we used the mosaics with a scale of 0.03” pixel-1.
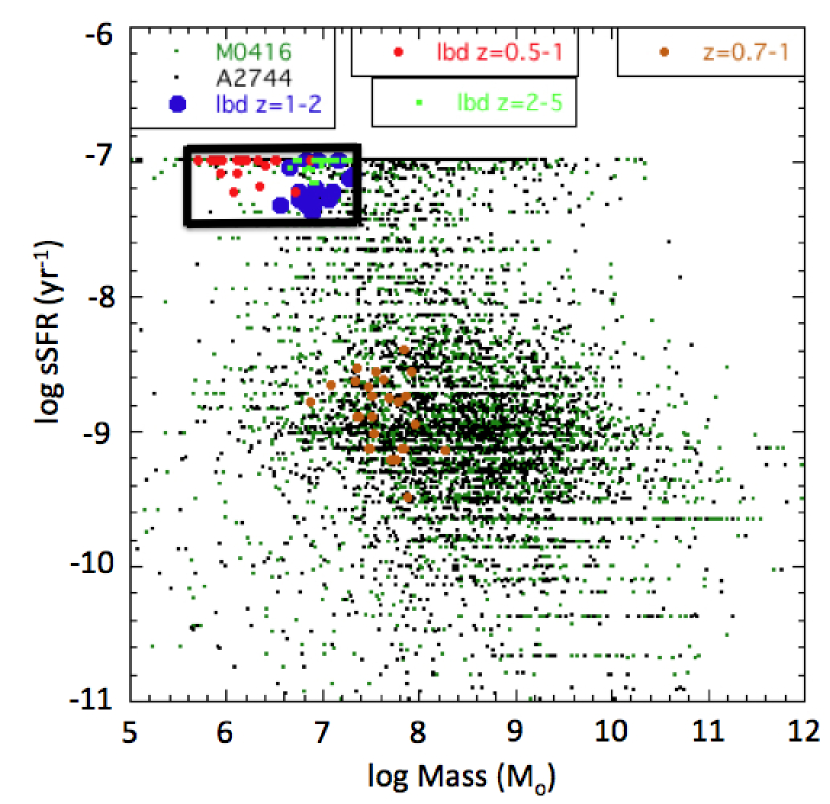
In the ASTRODEEP composite color images made from and passbands, several galaxies stand out as nearly point sources that are bright blue. They appear as “Little Blue Dots” (LBDs). We sought to examine these as examples of the low-mass, high star formation end of the distribution of galaxies. From the Frontier Fields catalogues of SFR and masses, we plotted specific sSFR versus mass, shown in Figure 1. There are 546 galaxies in A2744 and 547 in M0416 that have sSFR greater than ; of these, 173 in A2744 and 226 in M0416 have log(Mass) between 5.8 and 7.4. We further restricted the redshift range to , resulting in 198 galaxies in A2744 and 250 in M0416. We examined all of these galaxies in the color images to search for LBDs. Many were eliminated either because they were too faint to see, or were extended galaxies rather than point sources. Many others were eliminated because they appeared to be spurious sources. We found 55 LBDs, or about 12.2% of this mass, redshift, and sSFR range. Considering just the mass range, the LBDs account for 5.1% of the tabulated galaxies.
The LBD galaxies were divided into three groups according to redshift. All have log(sSFR) . Group 1 has 19 galaxies with average and average , group 2 has 16 galaxies with average and , and group 3 has 20 galaxies with and . In addition, we scanned the A2744 and M0416 images by eye to search for blue dots regardless of their mass and sSFR. We identified 26 more small blue galaxies that were higher mass and lower sSFR: they had average , , and average . These parameters place them in the normal range of sSFR although they have a blue dot appearance; we designate them group 4. The properties of the 4 groups are tabulated in Table 1, to be described further below.
Figure 1 shows log(sSFR) as a function of log(Mass) for all of the galaxies in the two parallel fields, A2744 with green points and M0416 with black points. The LBD galaxies are indicated by red, bright green, and blue points for groups 1, 2, and 3, respectively, and brown points for group 4 galaxies that have lower sSFRs. The black box outlines the region of completeness for identifying LBDs from a visual inspection of low mass, high sSFR galaxies.
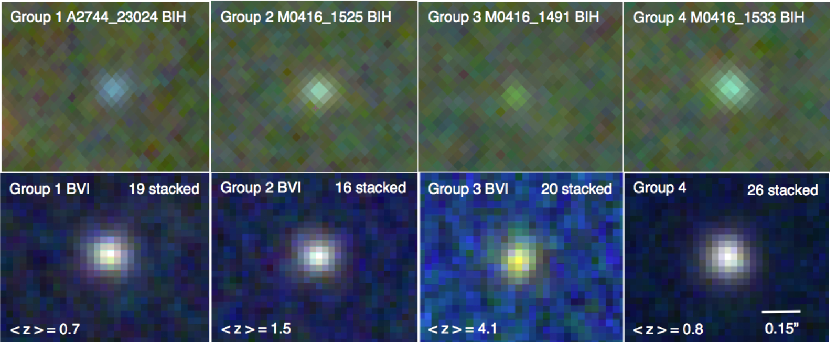
With IRAF (Image Reduction and Analysis Facility) and DS9, we made pixel cut-outs of each of the LBD galaxies for further analysis. The cut-outs were median stacked in each filter for each group using the IRAF task imcombine, in order to see whether they have extended faint outer disks that were not apparent in individual galaxy images. Color images were made from the stacked images in each group by first Gaussian-blurring the and images to match the images based on deconvolution with stellar point spread function in each band. The stellar profiles were based on stacking approximately 20 stars in each field, from Elmegreen et al. (2017). The top panels of Figure 2 show composite color images of a sample galaxy from each of the four groups, with the names and fields indicated. The lower panel shows composite stacked images for each group. The stacked images appear as nearly point sources, just like the individual images.
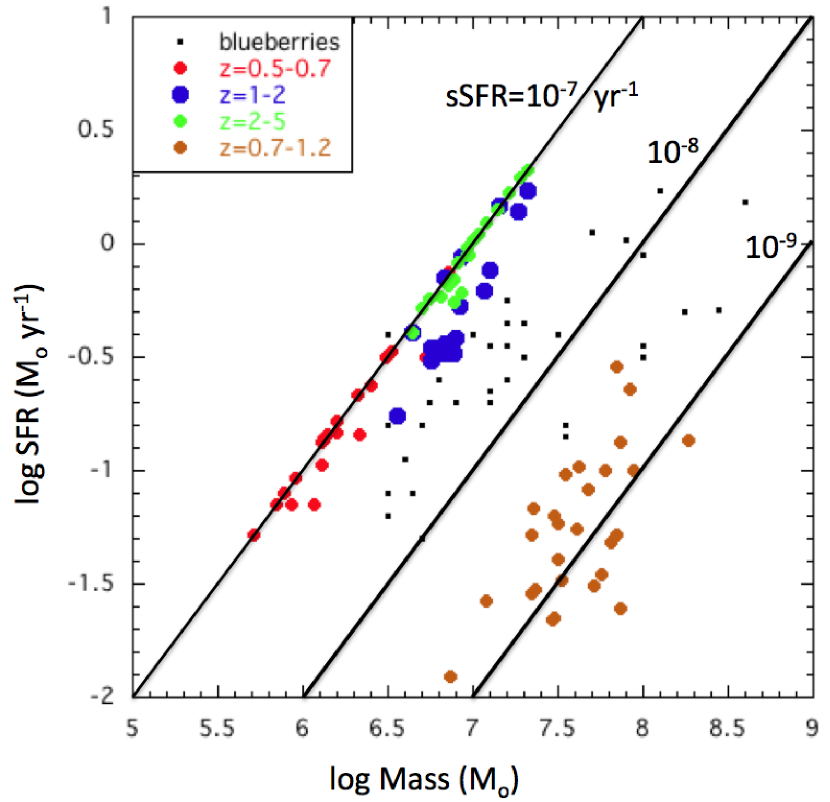
Figure 3 shows a plot of the SFR as a function of mass for all four groups of LBDs as well as for the local blueberries (from Figure 5 of Yang et al., 2017). Lines indicate constant sSFR. The group 4 galaxies (brown dots) are part of the normal sample of galaxies in terms of their sSFR; they are at the lower-mass, higher-sSFR limit of the SDSS galaxies in Figure 5 of Yang et al. (2017). Most SDSS galaxies have , whereas group 4 is at the high end with . In contrast, the LBDs in groups 1-3 are two orders of magnitude higher in sSFR than these, and several times higher in sSFR than the blueberries.
Group 4 galaxies also appear as LBDs on the images, but their sSFR are almost 2 dex lower than the group 1-3 galaxies. Group 4 galaxies have high SFRs, making them blue, but much more stellar mass than groups 1-3. This larger mass is indicated by their color index, which is several tenths of a magnitude redder than that of groups 1-3 galaxies. Average masses and indices are listed in Table 1.
Gaussian fits were done for each stacked image in each filter for the four groups. The resulting dispersions, , were deconvolved from the stellar dispersions in order to get the average galaxy radii (assumed to be the half widths at half maxima, ) in each passband. Fractional uncertainties in the deconvolved radii were determined from the quadratic sums of the fractional uncertainties in the galaxy and stellar sizes. For groups 1, 2, and 4, we used from the I-band images because they were the highest quality. For group 3, which has the highest redshift, we used the V image. The angular size was converted to linear size for each redshift using a CDM model (Ade et al., 2014, , km s-1 Mpc-1). The results are in Table 1.
III. Discussion
III.1. A Recent Burst
The LBD galaxies have a high sSFR, on the order of yr-1. From the CDM model, we determined the age of the Universe corresponding to the average redshift of each LBD group, and multiplied that by the average sSFR for that group. The values in Table 2 range from to for groups 1-3, but it is only for group 4. The inverse of these numbers is the fraction of the age of the universe during which the observed stellar mass has been formed at the observed SFR. The very high values suggest that star formation in group 1-3 LBDs began in the last one percent or less of the local age of the Universe.
III.2. Gas Mass Estimates
We estimate the gas mass in the LBD galaxies using the usual relation for the SFR, :
| (1) |
for efficiency per free-fall time (e.g. Krumholz & McKee, 2005), gas mass and free fall time for gas density ; is the deconvolved radius from the stacked images. After re-arranging terms,
| (2) |
Because is not measured, we evaluate from the observed quantities,
| (3) |
where now is in parsecs and is in yr-1.
The results are in Table 2: for groups 1, 2, and 3, and for group 4, which are more like normal galaxies. The ratio of this efficiency-normalized gas mass to the observed stellar mass is also given, and is of order unity for groups 1-3.
These gas-to-star ratios are unusually high for galaxies in groups 1-3, considering that the usual Kennicutt-Schmidt relation has , which would make the gas-to-star ratios 45, 16, and 12, respectively. Because an efficiency of is difficult to justify (i.e., it would imply that all of the gas converts to stars in one free-fall time, without feedback, low-density gas, etc.), the gas-to-star ratio is more likely , which is what would give.
The sSFR in LBDs is also extreme in another sense. The inverse, years, implies that nearly all of the stars have formed within the last 10 Myr, which is too short a time for most of the massive stars to have supernovaed. This suggests a high star formation efficiency and the formation of bound clusters (Parmentier & Baumgardt, 2012).
III.3. Star Formation Histories of Local dIrrs
Star formation histories of local dwarf galaxies do not show an early phase with a SFR as high as in the LBDs, which is yr-1 from the average of the for groups 1-3 in Table 1.
In the local dIrr WLM, the peak of the SFR Gyr ago was yr-1 (Dolphin, 2000) when the stellar mass was slightly less than in the LBDs, (Leaman et al., 2012). This makes for sSFR in yr-1, two orders of magnitude lower than for LBDs. At the average redshift of for group 1, the age of the forming stars today would be 6.6 Gyr. In WLM, the SFR at around 6.6 Gyr ago was yr-1 (Dolphin, 2000), and the stellar mass was (from an integral over the SFR), which is a similar to that in the LBDs at that age (Table 1). However, the in WLM was lower by more than three orders of magnitude, for the same units.
For the local dSph galaxy Fornax, de Boer et al. (2012a) determined a SFR that averages between 10 and 14 Gyr ago, and builds up a stellar mass of by the end of that time. Thus . At Gyr ago, the SFR was yr-1, and , so .
Another local dSph galaxy, Sculptor, has more of a starburst than Fornax at early times (de Boer et al., 2012b). The last significant event was Gyr ago inside pc. In the period from Gyr ago, the SFR was yr-1 and , making over a radius of 1.5 kpc. At Gyr ago, the SFR was yr-1 and , so mostly inside pc. This is about the radius of the LBDs which have higher sSFR.
Carina is a third local dSph studied by the same group (de Boer et al., 2014). Between Gyr, the SFR was yr-1 and the accumulated , making in yr-1. Near the SFR peak at 5 Gyr ago, the SFR was yr-1 and the accumulated , so in yr-1.
In these examples the whole-galaxy sSFR is 2 to 3 orders of magnitude lower than what is observed in the LBDs for the same epoch in the Universe. Perhaps the age resolution in local galaxies does not show a short-lived SFR burst that is as high as that in the LBDs.
A further comparison is with the early SFRs for the globular clusters in the Fornax dSph galaxy, as determined by de Boer & Fraser (2016). From their figure 8, the peak rates for Fornax globular clusters 1-5 are, in units of yr-1, approximately: , , , , and , with an rms of about 1 to 2 in these units. The cluster masses from their table 3 are, in units of , , , , , and , respectively. The average of the logs of the ratios of the SFRs to the masses of the clusters is , which is still much smaller than the sSFR we observe here. This star formation is spread out over Gyr in their figure 8, however, and perhaps much of this spread is from age uncertainties. If the SFR were 100 times more concentrated in time, taking place in only 20 Myr for each globular cluster, then the sSFRs would be comparable. 20 Myr is not an unreasonable timescale for cluster formation.
III.4. Globular Cluster Formation
Star-forming regions produce a fraction, , of their total stellar mass in the form of bound clusters, and these clusters form with a mass distribution function that spreads out the total into many individual clusters, most of which will not survive for a Hubble time. The mass distribution is often expressed as a Schechter function (Adamo et al., 2015) with a power law slope of (for linear intervals of mass) and an exponential drop at some high cluster mass, . For high SFR, can be larger than (e.g., Zhang & Fall, 1999) and the distribution function is essentially a power law up to a globular cluster mass. Considering this limit, or the case of a pure power law (Whitmore et al., 2014), integrals over the distribution function are analytic, and the total mass of stars that accompanies a single massive cluster with is:
| (4) |
where is the minimum cluster mass (Elmegreen et al., 2012). Setting (Chandar et al., 2017) and , we derive . At the SFRs of the LBDs, which average yr-1 as mentioned above, it will take Myr to make enough stars to have a single cluster. At the current average from Groups 1-3 in Table 1, the largest cluster mass is likely to be .
The observed starbursts could continue in these young regions for several tens of Myr. Usually, star formation continues in a region for a few dynamical times, perhaps up to at the average density (Elmegreen, 2000). Feedback and gas exhaustion seem to stop regions from continuing much longer than this, except perhaps in dispersed cloud fragments. Using the gas masses from Table 2 with discussed above, and using the average radii for the deconvolved LBDs, we derive the average gas densities and free-fall times listed in Table 2. The average for groups 1-3 is yr. If star formation continues for at the average SFR of yr-1, then the final stellar mass in the burst will be and the maximum cluster mass is likely to be . If (Adamo et al., 2011) for the SFR surface densities of LBDs, which average yr-1 kpc-2 for groups 1-3, then this maximum expected mass is .
Zaritsky et al. (2016) examined the globular cluster number as a function of galaxy mass for local galaxies. From their figure 4, they derived a cluster mass fraction of 0.013 for . These globular clusters are typically older than most of a galaxy’s stars, so they were presumably present when the galaxy had only 10% of its present mass. If we consider the present galaxy mass and the present globular cluster mass to account for cluster mass loss according to current models for the origin of multiple stellar populations in these clusters (Decressin et al., 2007; D’Ercole et al., 2008; Webb & Leigh, 2015), then the mass fraction in globular clusters at that early time was . Thus young versions of galaxies like these could have been dominated in mass by one or two globular clusters when the clusters formed. This situation is similar to what we may be seeing with the LBDs.
III.5. Evidence from Simulations
Cosmological simulations indicate that star-forming galaxies go through stages of compaction. Tacchella et al. (2016) found that compact high SFR galaxies have high gas fractions with short depletion timescales; they referred to these galaxies as “blue nuggets”. Their Figure 2 shows sSFR versus mass for their proposed evolutionary sequence of high sSFR galaxies evolving into quenched galaxies. The lower stellar mass limit in their simulations is , which is approximately the mass of a LBD galaxy. Their galaxies that start out as low-mass, high-sSFR galaxies become high-mass, low-sSFR galaxies by . The sSFR for the high redshift galaxies is . These simulated galaxies are not as extreme in sSFR as the LBDs, which at have .
Zoom-in simulations of galaxy formation in a cosmological context were used to study cluster formation in Pfeffer et al. (2017) using a detailed sub-grid prescription. The galaxies readily formed massive clusters because of their high ambient pressures. LBDs are lower mass galaxies than they studied, but LBDs could still have relatively high pressures considering the high gas densities in Table 2. Observations of gravitationally lensed massive star-forming regions that could contain globular clusters progenitors were in Vanzella et al. (2017).
IV. Conclusions
Low mass galaxies () with high sSFR ( in two Frontier Field Parallels were examined by eye and found to have a characteristic appearance which we have termed Little Blue Dots (LBDs). A more complete survey of these fields uncovered more LBDs of higher mass. The low mass LBDs have such high sSFR that they appear to have formed all of their stars in the last 1% of the age of the universe for them. They appear to be gas-dominated compared to stars, perhaps by a factor of 5, and midway through the process of forming massive clusters that will eventually be the globular clusters of today. These clusters would have represented a high fraction of the stellar mass in these systems when they formed, and that high fraction is consistent with the observed mass fraction in local dwarf galaxies. We suggest that objects like this are the long-sought progenitors of low-metallicity globular clusters, which formed in dwarf galaxies and got assimilated into the halos of today’s spirals and ellipticals.
Acknowledgments We thank Marc Rafelski for his helpful discussions about stacking images.
References
- Adamo et al. (2011) Adamo, A., Östlin, G., & Zackrisson, E. 2011, MNRAS, 417, 1904
- Adamo et al. (2015) Adamo, A., Kruijssen, J. M. D., Bastian, N., Silva-Villa, E., Ryon, J. 2015, MNRAS, 452, 246
- Ade et al. (2014) Ade, P.A.R., Aghanim, N., Armitage-Caplan, C. 2014, A&A, 571, A16
- Chandar et al. (2017) Chandar, R., Fall, S. M., Whitmore, B.C., Mulia, A.J. 2017, ApJ, 849, 128
- Cardamone et al. (2009) Cardamone, C., Schawinski, K., Sarzi, M., et al. 2009, MNRAS, 399, 1191
- Castellano et al. (2016) Castellano, M., Amor n, R., Merlin, E. et al. 2016, A&A, 590, A31
- de Boer et al. (2012a) de Boer, T.J.L., Tolstoy, E., Hill, V., Saha, A., Olszewski, E.W., Mateo, M., Starkenburg, E., Battaglia, G., & Walker, M.G. 2012, A&A, 544, A73
- de Boer et al. (2012b) de Boer, T.J.L., Tolstoy, E., Hill, V., Saha, A., Olsen, K., Starkenburg, E., Lemasle, B., Irwin, M.J., & Battaglia, G. 2012b, A&A, 539, A103
- de Boer et al. (2014) de Boer, T.J.J. Tolstoy, E. Lemasle, B. Saha, A., Olszewski, E.W., Mateo, M., Irwin, M.J., & Battaglia, G. 2014, A&A, 572, A10
- de Boer & Fraser (2016) de Boer, T.J.L., & Fraser, M. 2016, A&A, 590, A35
- Decressin et al. (2007) Decressin T., Charbonnel C., & Meynet G. 2007b, A&A, 475, 859
- D’Ercole et al. (2008) D Ercole A., Vesperini E., D Antona F., McMillan S.L.W., & Recchi S., 2008, MNRAS, 391, 825
- Dolphin (2000) Dolphin, A.E. 2000, ApJ, 531, 804
- Elmegreen (2000) Elmegreen, B.G. 2000, ApJ, 530, 277
- Elmegreen et al. (2012) Elmegreen, B.G., Malhotra, S., & Rhoads, J. 2012, ApJ, 757, 9
- Elmegreen et al. (2017) Elmegreen, B. G., Elmegreen, D. M., Tompkins, B., & Jenks, L. G. 2017, ApJ, 847, 14
- Krumholz & McKee (2005) Krumholz, M. R., & McKee, C. F. 2005, ApJ, 630, 250
- Leaman et al. (2012) Leaman, R., Venn, K. A., Brooks, A. M., et al. 2012, ApJ, 750, 33
- Leaman et al. (2013) Leaman, R., VandenBerg, D.A., Mendel, J. T. 2013, MNRAS, 436, 122
- Martig, et al. (2014) Martig, M., Minchev, I., Flynn, C. 2014, MNRAS, 442, 2474
- Merlin et al. (2016) Merlin, E., Amor n, R., Castellano, M., et al. 2016, A&A, 590, A30
- Parmentier & Baumgardt (2012) Parmentier, G. & Baumgardt, H. 2012, MNRAS, 427, 1940
- Pfeffer et al. (2017) Pfeffer, J., Kruijssen, J. M. D., Crain, R.A., & Bastian, N. 2017, arXiv171200019
- Tacchella et al. (2016) Tacchella, S., Dekel, A., Carollo, C., Ceverino, D., et al. 2016, MNRAS, 457, 2790
- Vanzella et al. (2017) Vanzella, E., Calura, F., Meneghetti, M., et al. 2017, MNRAS, 467, 4304
- Webb & Leigh (2015) Webb, J.J., Leigh, N.W.C. 2015, MNRAS, 2015, MNRAS, 453, 3278
- Whitmore et al. (2014) Whitmore, B.C., Chandar, R., Bowers, A.S., Larsen, S., Lindsay, K., Ansari, A., Evans, J. 2014, AJ, 147, 78
- Yang et al. (2017) Yang, H., Malhotra, S., Rhoads, J., & Wang. J. 2017, arXiv:1706.02819v2
- Zaritsky et al. (2016) Zaritsky, D., McCabe, K., Aravena, M. et al. 2016, ApJ, 818, 99
- Zhang & Fall (1999) Zhang, Q., & Fall. S.M. 1999, ApJ, 527, L81
| Group | no. | log(Mass) | Radius | ) | log(SFR) | log(sSFR) | |
|---|---|---|---|---|---|---|---|
| pc | mag | yr-1 | |||||
| 1 | 19 | ||||||
| 2 | 16 | ||||||
| 3 | 20 | ||||||
| 4 | 26 |
| Group | Avg. Density | ||||
|---|---|---|---|---|---|
| age of Univ. | atoms cm-3 | yr | |||
| 1 | 469 | 6.5 | 2.1 | 19 | 7.0 |
| 2 | 513 | 6.8 | 0.76 | 68 | 6.7 |
| 3 | 147 | 6.7 | 0.54 | 290 | 6.4 |
| 4 | 9.0 | 6.5 | 0.076 | 2.9 | 7.4 |