Strong late-time circumstellar interaction in the peculiar supernova iPTF14hls111Observations reported here were obtained at the MMT Observatory, a joint facility of the University of Arizona and the Smithsonian Institution.
Abstract
We present a moderate-resolution spectrum of the peculiar Type II supernova iPTF14hls taken on day 1153 after discovery. This spectrum reveals the clear signature of shock interaction with dense circumstellar material (CSM). We suggest that this CSM interaction may be an important clue for understanding the extremely unusual photometric and spectroscopic evolution seen over the first 600 days of iPTF14hls. The late-time spectrum shows a double-peaked intermediate-width H line indicative of expansion speeds around 1000 km s-1, with the double-peaked shape hinting at a disc-like geometry in the CSM. If the CSM was highly asymmetric, perhaps in a disc or torus that was ejected from the star 3-6 years prior to explosion, then the CSM interaction could have been overrun and hidden below the SN ejecta photosphere from a wide range of viewing angles. In that case, CSM interaction luminosity would have been thermalized well below the photosphere, potentially sustaining the high luminosity without exhibiting the traditional observational signatures of strong CSM interaction (narrow H emission and X-rays). Variations in density structure of the CSM could account for the multiple rebrightenings of the lightcurve. We propose that a canonical 11051 erg explosion energy with enveloped CSM interaction as seen in some recent SNe, rather than an entirely new explosion mechanism, may be adequate to explain the peculiar evolution of iPTF14hls.
keywords:
circumstellar matter — stars: winds, outflows — supernovae: general1 INTRODUCTION
The very peculiar Type II supernova (SN) iPTF14hls was a so-far unique event. It had a nearly unchanging and fairly normal spectrum resembling a traditional Type II-P explosion, but this was difficult to reconcile with its highly unusual multi-peaked lightcurve, which also exhibited a high luminosity lasting far longer than any normal SNe II-P (Arcavi et al., 2017). The optical lightcurve had a bumpy plateau lasting over 600 days with 5 separate brightening episodes, and the velocities in optical spectra evolved 5–10 times slower than a normal SN II-P. Due to the lack of narrow lines of hydrogen typically seen in interacting Type II SNe (i.e. SNe IIn) and the absence of any detectable X-ray or radio emission, Arcavi et al. (2017) argued against shock interaction with dense circumstellar material (CSM) as the cause for the strangeness of this SN although they did not definitively rule it out). Instead it was suggested that some new evolutionary path or explosion mechanism may need to be invoked to explain the unusual properties of iPTF14hls (Arcavi et al., 2017).
Based on a number of recent studies of SNe IIn, CSM interaction is understood to be a pathway to get long lasting, high luminosity, and irregular or bumpy lightcurves. Through CSM interaction, kinetic energy of the fast SN ejecta are converted to luminosity in a dense radiative shock when the SN ejecta slams into the CSM (for a recent review of interacting SNe, see Smith 2016). Dense shells of CSM can generate extremely high luminosity in some SNe (Smith & McCray, 2007), and some SNe IIn can be powered this way for a long time (Rest et al., 2011) – much longer than conventional emission from a recombination photosphere that fades roughly on a diffusion timescale (Arnett, 1996). Since the luminosity generated by CSM interaction depends on the density of the CSM it overtakes, density inhomogeneities in the CSM can easily lead to irregular bumpy light curves. For instance, Nyholm et al. (2017) show that iPTF13z had a similar bumpy lightcurve, but its spectrum was that of a Type IIn with strong narrow emission lines. CSM interaction would seem a perfectly suitable explanation for the light curve of iPTF14hls, were it not for the fact that this SN’s spectrum showed no signatures of CSM interaction in spectra taken over the first 600 days (Arcavi et al., 2017).
If we were restricted to only scenarios that permitted spherical symmetry, then the lack of narrow lines and X-rays in iPTF14hls would indeed seem to rule out CSM interaction as a plausible explanation. However, a diverse range of observations dictate that close binary interaction (Sana et al., 2012; Moe & Di Stefano, 2017) and asymmetric CSM (Smith, 2014) are the norm among massive stars, not the exception. Binary interaction may often lead to asymmetric or disc-like CSM, especially in cases of eruptive pre-SN mass loss (Smith & Arnett, 2014). In such cases, the situation becomes more complicated; over most of the solid angle of the explosion, the fast SN ejecta expand unimpeded as though there is no CSM. In the equator, however, strong CSM interaction occurs as the SN ejecta are quickly decelerated by the dense CSM. As such, the slower CSM interaction region (and hence, the CSM interaction luminosity and most observable signatures) can be quickly overrun by the rapidly expanding opaque ionized SN ejecta envelope. If the CSM interaction region is buried below the SN ejecta photosphere, then the luminosity created through the interaction is reprocessed by the opaque SN ejecta. From most viewing angles off the equator, this might result in a normal Type II-P spectrum that lasts through the duration of the main SN peak. This sort of evolution has been invoked already in PTF11iqb (Smith et al., 2015) as well as SN 1998S, SN 2009ip, and SN 1993J discussed in Smith (2016, and references therein), where this process is referred to as enveloped or swallowed CSM interaction. The main condition for enveloped CSM interaction is that the CSM is highly asymmetric. While the narrow and intermediate-width lines can be hidden partly or fully during the main light curve peak, they tend to emerge again at late times when the SN fades and the photosphere recedes. When this behavior is seen, it suggests that enveloped CSM interaction may have been contributing to the luminosity the whole time. In principle, this mechanism could occur in a wide range of SN subtypes, including SNe Ia-CSM (see Smith 2016).
In this paper we show that indeed iPTF14hls has now revealed signs of strong CSM interaction in optical spectra taken over 3 years after explosion, and we discuss how this scenario may provide a solution to the otherwise puzzling light curve and spectral evolution first presented by Arcavi et al. (2017). The paper is structured as follows: In section 2 we present our new observations, in section 3 we discuss and interpret these results, and in section 4 we make some concluding remarks.
2 OBSERVATIONS
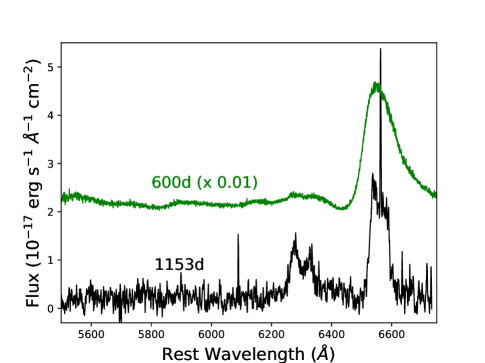
We obtained 3 1200 s exposures of iPTF14hls with the Blue Channel spectrograph on the Multiple Mirror Telescope (MMT) on 2017 November 20 UTC (JD 2458077.9). Adopting the date of discovery (JD 2456922) as day 0, following Arcavi et al. (2017), the date of our new spectrum corresponds to day 1153. The observations were taken with the 1200 l mm-1 grating with a central wavelength of 6300 Å and a 10 slit width. Seeing was 09. The spectral range covers approximately 5700 - 7000 Å as seen in Figure 1, and the resolving power (R = /) is 4500, or 65 km s-1. Standard reductions were carried out using IRAF 222IRAF, the Image Reduction and Analysis Facility is distributed by the National Optical Astronomy Observatory, which is operated by the Association of Universities for Research in Astronomy (AURA) under cooperative agreement with the National Science Foundation (NSF) and wavelength solutions were determined using internal HeNeAr arc lamps. Flux calibration was achieved using spectrophotometric standards at a similar airmass taken throughout the night.
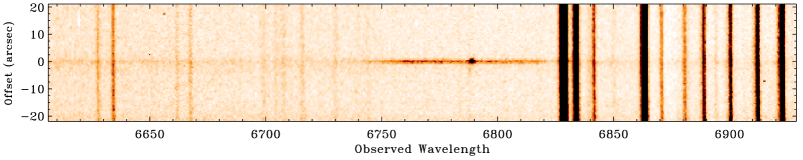
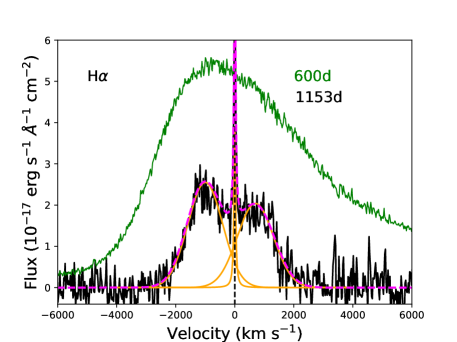
A portion of the combined 2D spectrum which has been bias and flat-field corrected but not sky subtracted is shown in Figure 2. Both the intermediate-width and narrow H emission regions are clearly seen. The narrow H emission is spatially unresolved and coincident with the SN; while we cannot rule out a local H ii region coincident with the SN position, this narrow emission is not due to spatially extended H ii region emission in the host. Following Arcavi et al. (2017), we assume negligible host-galaxy extinction and correct only for MW extinction of E(B-V) 0.0137 (Schlafly & Finkbeiner, 2011). We adopt a redshift of = 0.0333 for the SN, determined from the narrow H emission (Figure 3, top). This corresponds to a luminosity distance of 151 Mpc (Planck Collaboration et al., 2016).
3 DISCUSSION
3.1 Line Evolution
Figure 1 shows the clear differences in H and [O i] line profiles between day 600 and day 1153. Not only has the broad H emission narrowed, but it has taken on a boxy asymmetrical shape, and a strong narrow emission feature has emerged. The [O I] 6300,6363 Å line is also much more pronounced on day 1153 than on day 600.
Inspection of the region around H in the top panel of Figure 3 shows that the velocity width of H has slowed from around 6000 km s-1 (day 600) to 3000 km s-1 (day 1153). Structure has also appeared in the once smooth broad line, with two intermediate-width bumps on the blue and red side of the narrow emission. The line profile on day 1153 can be approximated by a narrow (FWHM = 65 km s-1) Lorentzian at zero velocity plus two Guassians centered at 1000 km s-1 and 700 km s-1, with FWHM values of 1380 and 1440 km s-1, respectively (Table 1). The total H luminosity is approximately 4 1039 erg s-1, at least 2 orders of magnitude fainter than on day 600. Note that no corresponding photometry were taken with our spectrum to constrain the accuracy of this calibration, so this is a rough approximation.
| Line | FWHM | centre | Flux |
|---|---|---|---|
| km s-1 | km s-1 | erg s-1 cm-2 | |
| H | 1380 | -1000 | 7.8 10-16 |
| H | 65 | 0 | 1.3 10-16 |
| H | 1440 | 700 | 5.8 10-16 |
| O I | 1550 | -1110 | 3.2 10-16 |
| O I | 1570 | 1150 | 2.2 10-16 |
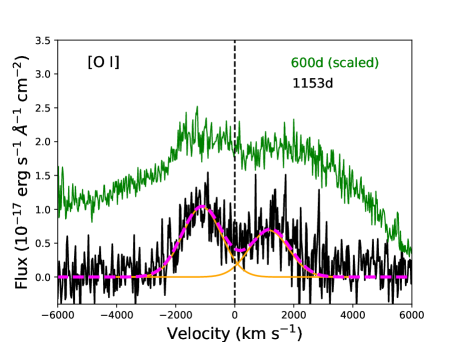
A similar line-profile shape is seen in the [O i] emission, with the intermediate-width peaks symmetric about 6300 Å and the profile becoming slightly flat-topped. This shape may have been just starting to emerge in the day 600 spectrum. The peak separation is 46 Å so they are not both blue peaks from the 6300 Å and 6363 Å doublet. We should also see peaks at 6340 Å and 6386 Å if the 6364 Å behaves similarly. It is possible they are present, but as the ratio of 6300/6364 is usually 3:1 they would be lost in the noise of the spectrum. Asymmetric oxygen profiles of this type are discussed in Milisavljevic et al. (2010), and could be due to dust either scattering internally or obscuring the red peak. The stronger blue peak in H could also suggest the presence of dust.
Double-peaked profiles in late-time spectra are often interpreted as due to a disc or torus CSM geometry (Leonard et al., 2000; Hoffman et al., 2008; Mauerhan et al., 2014; Katsuda et al., 2016; Smith et al., 2015; Andrews et al., 2017, for example). We strongly suspect that geometry plays an important role in the profile shape and in the qualitative behavior of CSM interaction in this SN, as will be discussed in further detail below.
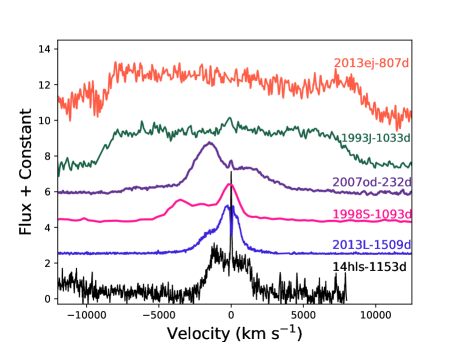
iPTF14hls is not the first CCSN to show hydrogen line profile shapes of this type. Figure 4 shows the similarities among the late-time H emission of interacting SNe 1993J (IIb), 1998S (IIn), SN2013L (IIn), SN2013ej (II-P/L), 2007od (II-P) and iPTF14hls (Fransson, Lundqvist, & Chevalier, 1996; Matheson et al., 2000; Fransson et al., 2005; Leonard et al., 2000; Andrews et al., 2017; Mauerhan et al., 2017; Andrews et al., 2010; Inserra et al., 2011). This shape has also been seen in other CCSN such as the Type II-P events SN 2011ja (Andrews et al., 2016) and SN 2008jb (Prieto et al., 2012); the Type II-L SN 1980K (Fesen & Becker, 1990); and the Type IIb SN 2013df (Maeda et al., 2015). While a broad age-range is represented, the double-peaked or boxy shape and flat-topped profile can be attributed to interaction with a torus or shell of CSM (Chevalier & Fransson, 1994), whether it be from a forward or reverse shock. One obvious discrepancy between iPTF14hls and the other SNe is the width of H and the velocity of the intermediate-width peaks. Both SN 2013ej and SN 1993J have widths extending outwards of 70009000 km s-1, while iPTF14hls and SN 2013L are much slower at 10002000 km s-1. Intermediate between the two are SN 1998S and SN 2007od, with SN 1998S showing no red-peak at all. This is a strong indication that the CSM is more massive in the SNe with narrower profiles, because a higher mass within a given solid angle is needed to slow a SN ejecta to 1/10th of the initial velocity. This relatively high-mass CSM would also be consistent with the high luminosity observed for iPTF14hls (see below).
3.2 A possible scenario
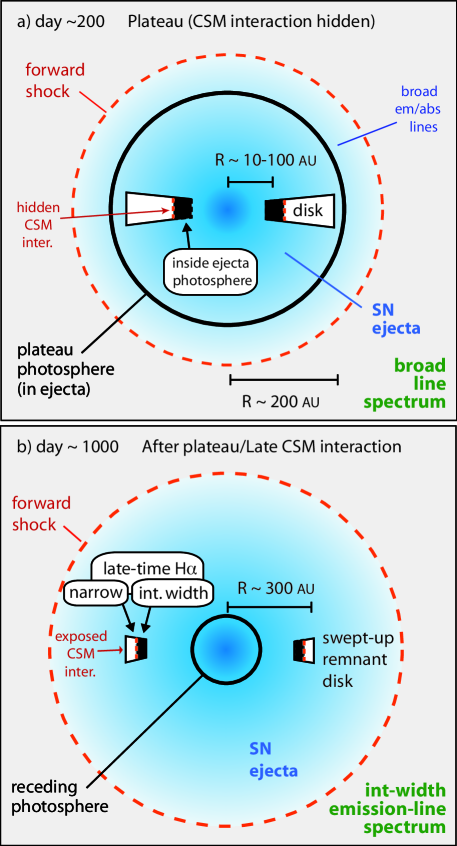
It is a challenge to simultaneously explain the long-lasting (and bumpy) lightcurve of iPTF14hls while also accounting for the seemingly unchanging optical spectrum of a normal SN II-P. Here we propose that both may be explained with CSM interaction, providing that a particular set of conditions are met. Most importantly, the CSM must be highly asymmetric, perhaps in a disc or torus, and of limited radial extent. As mentioned in the Introduction, and as illustrated in Figure 5, a disc-like geometry in the CSM may allow the CSM interaction to be hidden below the photosphere after that disc is enveloped by the fast SN ejecta. If the region of CSM interaction is happening below the ejecta photosphere, it can be hidden for long periods of time because the sustained CSM interaction luminosity itself keeps the surrounding SN ejecta ionized and optically thick. Due to the uncertainty in explosion date of the SN by 100 days, it is plausible that narrow emission lines were present at early times before the photosphere swallowed the CSM, as seen in objects like PTF11iqb. This phenomena is explained extensively in Smith (2016) and Smith et al. (2015), and requires only that the disc or torus of material has a limited spatial extent so that it can be overrun early on by the SN photosphere. The luminosity and duration of iPTF14hls are more extreme than PTF11iqb, but the same basic principle may apply.
Since the disc/torus would only intercept a small fraction of the ejecta, most of the ejecta would expand freely and the ejecta photosphere would envelope the CSM quickly (Figure 5a). For locations near the equator, the collision of the ejecta and the dense CSM produces a high luminosity of X-ray and UV photons that cannot escape due to the opacity of the surrounding SN ejecta, and are thermalized below the SN ejecta photosphere. This causes a temporary increase in the luminosity of the SN (i.e. a“bump”) when a dense shell or clump is encountered by the shock. The continual internal energy deposition would also keep the spherically expanding ejecta photoionized, causing seemingly static or extremely slow spectral evolution until the photosphere completely recedes.
The reprocessing of CSM interaction luminosity by the surrounding ejecta not only prevents the X-rays from escaping, but also smears out any narrow line emission. This would explain why Arcavi et al. (2017) detected no X-ray emission or narrow lines. Any narrow emission emitted by pre-shock CSM in the disc would encounter multiple scatterings throughout the opaque SN ejecta and the extended H emitting region, effectively blurring the line structure until later times when the opacity dropped sufficiently. Therefore any narrow line emitting region could be easily buried within the SN ejecta, and would not be seen until late times.
Eventually the photosphere will recede (Figure 5b), revealing the CSM interaction below. As a consequence of previous shock/CSM interaction, much of the 100 km s-1 CSM will already have been swept up to speeds of 1000 km s-1, which would explain the velocity offsets of the red/blue peaks seen in iPTF14hls. Any remaining slow moving CSM will be photoionized by the ongoing shock in the disc (red dashed line) and will be observed as narrow H emission. The remnant of this disc might also be cool and dense, enough to allow the growth of dust grains that could attenuate the red peak more than the blue peak. This has been seen in numerous Type II SNe, with a few shown in Figure 4 (Leonard et al., 2000; Smith et al., 2009; Fox et al., 2009; Andrews et al., 2010, 2016).
Using the Gaussian fits shown in Table 1, we estimate the bulk of the CSM is moving at 1000 km s-1. By the time the SN had achieved maximum light at day 220, this CSM would have been at a location of only 1.9 1015 cm ( possibly closer if the CSM is not assumed to instantly be accelerated to this velocity.) This is below the blackbody photospheric radius of 2 1015 cm, fully consistent with the interpretation of enveloped CSM interaction, and well below the Fe ii line formation radius of 8 1015 cm (shown in Figure 4 of Arcavi et al. (2017)). On day 600 the intermediate-width peaks would be located at a distance of 51015 cm, outside of the blackbody photosphere, but still well within the Fe ii line region, which has expanded to 21016 cm. At all times, the CSM is below the H line-forming radius, which should be between 5-6 1016 cm by day 1153 assuming an H velocity of 40006000 km s-1. Since the H emission from the CSM interaction is still well below the line forming region of the broad H in the SN ejecta, the internal H photons would be scattered due to significant line opacity, and the original line shape would be hidden.
Could the intermediate-width and narrow H observed at late times arise from the fastest ejecta crashing into a distant CSM shell that had a large inner cavity, so that CSM interaction has just turned on? That might explain the lack of CSM interaction signatures at early times (although it would provide no help in understanding the peculiar properties of the SN). This is an unlikely explanation for the origin of the H emission we report here. If the fastest ejecta just now encountered a distant hollow shell at a large radius, then in addition to seeing narrow emission from the pre-shock gas and intermediate width emission from the shocked CSM, we would also expect to see very broad emission from the fastest ejecta that are at the reverse shock (Chevalier & Fransson, 1994). This is precisely the scenario that occurred in SN1987A, when the blast wave hit distant CSM after a delay of several years, and in that case the broad H from the reverse shock is quite strong (Smith et al., 2005). This broad emission is not seen here, indicating that the shock is not caused by the fastest ejecta intercepting a distant shell, instead, a shock in the CSM at a much smaller radius that was previously hidden below the photosphere would have much slower SN ejecta of only 1000-2000 km s-1 catching up to the reverse shock.
The lack of polarization detected by Arcavi et al. (2017) suggests that the bulk of the continuum emission during the first year or two of the iPTF14hls light curve is coming from a mostly spherical environment. In a simple scenario, this might be at odds with our requirement of highly asymmetric CSM, as long as the SN is not viewed pole-on. However, again, in the scenario we suggest with enveloped CSM interaction, the asymmetric emitting regions are buried well below the photosphere. Since these CSM interaction photons are thermalized deep inside the SN ejecta envelope, their polarization signature would be erased.
The asymmetric CSM was likely created through some enhanced episodic or explosive mass-loss shortly before core-collapse. If for instance the CSM is located at a distance between 50-100 AU (1014.5-1015 cm; this is the distance derived by extrapolating the late-time expansion speed of 1000 km s-1 to around day 100200), the fastest narrow H emission velocity of 80 km s-1 (measured from the blue edge of the narrow emission line) would require a mass loss episode sometime between 3 - 6 years before discovery. This is in agreement with Arcavi et al. (2017) and the timescale is consistent with late nuclear burning instabilities such as pulsational pair instabilities or wave driven mass loss from Ne/O burning (Quataert & Shiode, 2012; Smith & Arnett, 2014; Fuller, 2017; Woosley, 2017). In addition to the advanced burning instabilities, binary interaction with a bloated envelope would likely need to be invoked in order to explain the pronounced asymmetry in the CSM (Smith & Arnett, 2014).
CSM interaction is an efficient way to convert SN ejecta kinetic energy into radiative luminosity. Arcavi et al. (2017) estimate a total radiated energy for iPTF14hls of about 21050 erg. This can easily be achieved with CSM interaction and a conventional SN explosion energy of 1-2 1051 erg, provided that a massive disc or torus intercepts about 10-20% of the solid angle of the SN ejecta (Smith, Mauerhan, & Prieto, 2014). From momentum conservation, a CSM mass of 5–10 would be required to decelerate that fraction of a typical SN ejecta mass down to the final observed coasting speed of 1000 km s-1. While this CSM mass requires rather extreme pre-SN mass-loss rates compared to normal steady winds, it is not so extreme compared to some high-luminosity SNe IIn such as SN 2006gy, SN 2006tf, and SN2010jl (see Smith (2014) for a review of pre-SN mass loss). This sort of scenario is also less extreme than the 50 or more of SN ejecta, unusually high explosion energy of 1052 erg, and perhaps multiple explosions, required in a scenario without CSM interaction (Arcavi et al., 2017).
4 Conclusions
While the evolution of iPTF14hls is quite unusual among SNe studied so far, we propose that it may be explained with an enveloped CSM interaction scenario. With two assumptions — (1) that the SN progenitor had an extreme mass-loss episode a few years before explosion, as is generally thought to be the case for most SNe IIn, and (2) that binary interaction or rapid rotation caused this CSM to be distributed into a disc or torus — it may not be so challenging to explain both the observed spectrum and light curve of iPTF14hls, as well as the multi-peaked and boxy emission-line profiles seen at late times. This is possible if the CSM is dense and close enough to the star that it can be overrun and enveloped by the SN ejecta. The CSM interaction region could be hidden within the SN photosphere for months or years, but its luminosity would be thermalized and would increase the overall optical luminosity of the event by keeping the surrounding SN ejecta ionized. Viewed from an outside observer, the SN ejecta that are reheated by CSM interaction from deep inside would exhibit the spectrum of a normal, broad Type II-P event. Multiple shells or some other density inhomogeneities in the CSM could cause the emergent light curve to appear bumpy as the shock propagates through each of them. Therefore it is plausible that the strange behavior of iPTF14hls is due to circumstellar interaction, despite the lack of obvious signatures of CSM interaction in the early spectra.
There may indeed have been a brief period of time when iPTF14hls showed strong narrow lines and other signs of CSM interaction, but because the first spectra were obtained around 100 days after explosion, these might have already faded when the CSM interaction region was enveloped by the opaque fast SN ejecta. Additional observations can help constrain the mass-loss history of the progenitor and further uncover the interaction occurring in iPTF14hls. For example, although early time X-ray and radio observations yielded non-detections, the current interaction seen in H may suggest that deep late-time X-ray observations should be obtained. The IIn SN 2005ip had an X-ray luminosity 25 brighter than the H luminosity at late times (Smith et al., 2017). Assuming iPTF14hls behaves similarly we can estimate an LX = 11041 erg s-1. At the distance of iPTF14hls and similar assumptions about absorption as in SN 2005ip, Chandra ACIS observations with roughly an hour of on source time should readily detect this. It would also be interesting to produce 2-D radiative transfer models for this asymmetric scenario of enveloped CSM interaction, to see exactly what CSM geometries and viewing angles are consistent with a lack of narrow lines in iPTF14hls.
ACKNOWLEDGMENTS Special thanks to Jon Mauerhan for the spectrum of SN 2013ej and to the referee for constructive comments. N.S. acknowledges puzzling but fruitful conversations with I. Arcavi about iPTF14hls. The day 600 spectrum of iPTF14hls was obtained from the Weizmann interactive supernova data repository (http://wiserep.weizmann.ac.il). Support was provided by NSF grants AST-131221 and AST-151559, and by a Scialog grant from the Research Corporation for Science Advancement.
References
- Andrews et al. (2010) Andrews J. E., et al., 2010, ApJ, 715, 541
- Andrews et al. (2016) Andrews J. E., et al., 2016, MNRAS, 457, 3241
- Andrews et al. (2017) Andrews J. E., Smith N., McCully C., Fox O. D., Valenti S., Howell D. A., 2017, MNRAS, 471, 4047
- Arcavi et al. (2017) Arcavi I., et al., 2017, Natur, 551, 210
- Arnett (1996) Arnett D., 1996, snih.book,
- Chevalier & Irwin (2012) Chevalier R. A., Irwin C. M., 2012, ApJ, 747, L17
- Chevalier & Fransson (1994) Chevalier R. A., Fransson C., 1994, ApJ, 420, 268
- Elias-Rosa et al. (2017) Elias-Rosa N., et al., 2017, ATel1, 10746, 1
- Fesen & Becker (1990) Fesen R. A., Becker R. H., 1990, ApJ, 351, 437
- Fox et al. (2009) Fox O., et al., 2009, ApJ, 691, 650
- Fransson, Lundqvist, & Chevalier (1996) Fransson C., Lundqvist P., Chevalier R. A., 1996, ApJ, 461, 993
- Fransson et al. (2005) Fransson C., et al., 2005, ApJ, 622, 991
- Fuller (2017) Fuller J., 2017, MNRAS, 470, 1642
- Galbany et al. (2016) Galbany L., et al., 2016, AJ, 151, 33
- Hoffman et al. (2008) Hoffman J. L., Leonard D. C., Chornock R., Filippenko A. V., Barth A. J., Matheson T., 2008, ApJ, 688, 1186-1209
- Inserra et al. (2011) Inserra C., et al., 2011, MNRAS, 417, 261
- Katsuda et al. (2016) Katsuda S., et al., 2016, ApJ, 832, 194
- Leonard et al. (2000) Leonard D. C., Filippenko A. V., Barth A. J., Matheson T., 2000, ApJ, 536, 239
- Maeda et al. (2015) Maeda K., et al., 2015, ApJ, 807, 35
- Matheson et al. (2000) Matheson T., Filippenko A. V., Ho L. C., Barth A. J., Leonard D. C., 2000, AJ, 120, 1499
- Mauerhan et al. (2017) Mauerhan J. C., et al., 2017, ApJ, 834, 118
- Mauerhan et al. (2014) Mauerhan J., et al., 2014, MNRAS, 442, 1166
- Milisavljevic et al. (2010) Milisavljevic D., Fesen R. A., Gerardy C. L., Kirshner R. P., Challis P., 2010, ApJ, 709, 1343
- Modjaz et al. (2014) Modjaz M., et al., 2014, AJ, 147, 99
- Moe & Di Stefano (2017) Moe M., Di Stefano R., 2017, ApJS, 230, 15
- Nyholm et al. (2017) Nyholm A., et al., 2017, A&A, 605, A6
- Patat (2005) Patat F., 2005, MNRAS, 357, 1161
- Planck Collaboration et al. (2016) Planck Collaboration, et al., 2016, A&A, 594, A13
- Poznanski, Prochaska, & Bloom (2012) Poznanski D., Prochaska J. X., Bloom J. S., 2012, MNRAS, 426, 1465
- Pozzo et al. (2004) Pozzo M., Meikle W. P. S., Fassia A., Geballe T., Lundqvist P., Chugai N. N., Sollerman J., 2004, MNRAS, 352, 457
- Prieto et al. (2012) Prieto J. L., et al., 2012, ApJ, 745, 70
- Pursimo et al. (2017) Pursimo T., et al., 2017, ATel1, 10717, 1
- Quataert & Shiode (2012) Quataert E., Shiode J., 2012, MNRAS, 423, L92
- Rest et al. (2011) Rest A., et al., 2011, ApJ, 729, 88
- Sana et al. (2012) Sana H., et al., 2012, Sci, 337, 444
- Schlafly & Finkbeiner (2011) Schlafly E. F., Finkbeiner D. P., 2011, ApJ, 737, 103
- Smith et al. (2009) Smith N., et al., 2009, ApJ, 695, 1334
- Smith et al. (2005) Smith N., Zhekov S. A., Heng K., McCray R., Morse J. A., Gladders M., 2005, ApJ, 635, L41
- Smith, Mauerhan, & Prieto (2014) Smith N., Mauerhan J. C., Prieto J. L., 2014, MNRAS, 438, 1191
- Smith et al. (2017) Smith N., et al., 2017, MNRAS, 466, 3021
- Smith & Arnett (2014) Smith N., Arnett W. D., 2014, ApJ, 785, 82
- Smith (2014) Smith N., 2014, ARA&A, 52, 487
- Smith (2016) Smith N., 2016, arXiv, arXiv:1612.02006
- Smith et al. (2015) Smith N., et al., 2015, MNRAS, 449, 1876
- Smith & McCray (2007) Smith N., McCray R., 2007, ApJ, 671, L17
- Tartaglia et al. (2017) Tartaglia L., et al., 2017, arXiv, arXiv:1711.03940
- Turatto (2003) Turatto M., 2003, LNP, 598, 21
- Valenti et al. (2017) Valenti S., Tartaglia L., Sand D., Wyatt S., Bostroem K. A., Reichart D. E., Haislip J. B., Kouprianov V., 2017, ATel1, 10706, 1
- Woosley (2017) Woosley S. E., 2017, ApJ, 836, 244
- Yaron & Gal-Yam (2012) Yaron O., Gal-Yam A., 2012, PASP, 124, 668