Compiled \ociscodes(300.6320) Spectroscopy, high-resolution; (300.6390) Spectroscopy, molecular; (300.6460) Spectroscopy, saturation; (140.2020) Diode lasers; (140.3425) Laser stabilization; (140.7300) Visible lasers.
Absolute frequency measurement of molecular iodine hyperfine transitions at 647 nm
Abstract
We report absolute frequency measurements of the molecular iodine P(46) 5-4 , , and hyperfine transitions at 647 nm with a fiber-based frequency comb. The light source is based on a Littrow-type external-cavity diode laser. A frequency stability of 5 10-12 at a 200 s integration time is achieved when the light source is stabilized to the P(46) 5-4 line. The pressure shift is determined to be -8.3(7) kHz/Pa. Our determination of the line centers reached a precision of 21 kHz. The light source can serve as a reference laser for lithium spectroscopy ().
1 Introduction
Molecular iodine () has played an important role in optical frequency standards for many applications. The most striking element of the iodine absorption spectrum is the long series of the system in the range from the green to near-IR and has very strong transition strength and narrow linewidth (<1 MHz) in the region close to the dissociation limit [1]. Molecular iodine is commonly used for frequency stabilization of laser. Stabilized laser by sub-Doppler saturation spectroscopy may be called a traditional method in molecular iodine spectroscopy. That good signal-to-noise ratio at the 532 nm of frequency doubled Nd:YAG laser gives excellent results [2]. Stabilized laser as frequency reference can also be applied to fundamental metrology [3, 4], atomic or molecular physics [5, 6, 7, 8, 9, 10], cavity QED system [11] and optical clocks [12, 13, 14].
Iodine absorption lines at 647 nm are very close to doubled wavelength (2323 nm) of the transition of atomic lithium (Li). Therefore, these iodine lines can be frequency references for Li atom research, e.g., the development of laser cooling [15, 16] and the measurement of hyperfine intervals [17]. The frequency references at 647 nm using a simple iodine cell are particularly helpful in regards to studying lithium spectroscopy, especially for atomic physics laboratories where no optical frequency combs are available.
In this work, we perform Doppler-free saturation spectroscopy in an iodine vapor cell using modulation transfer spectroscopy. The effect of pressure shift is investigated by changing the cold finger temperature and the absolute transition frequency at zero pressure can be obtained. The saturated absorption signal is used to lock the laser frequency, and the absolute frequencies of the transitions are measured by an optical frequency comb. To our knowledge, there are no precision measurements around this wavelength, and our results provide useful input for the theoretical predictions.
2 Experiment
The light source is a Littrow-type external-cavity diode laser (ECDL). We try two different laser diodes from Oclaro (model HL6385DG & HL65014DG) in a standard 5.6 mm package and show the characteristics in Fig. 1 with Littrow configuration.
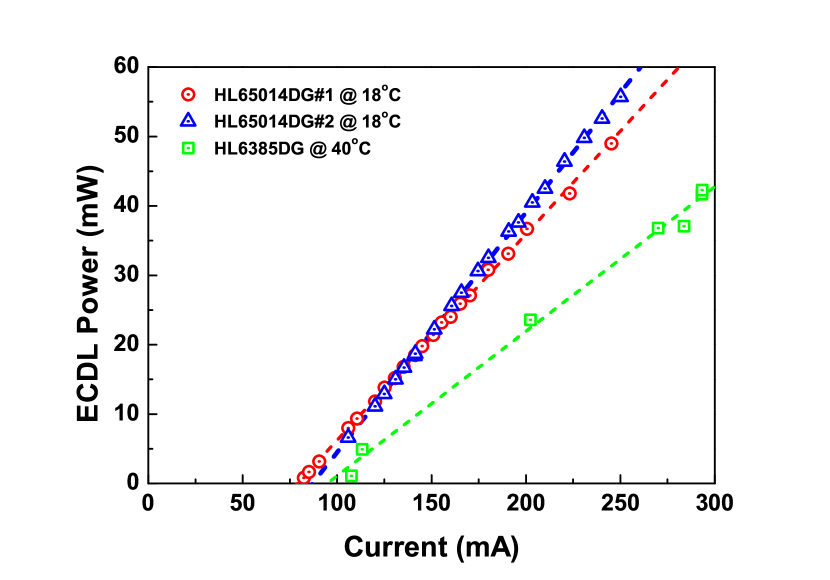
The HL6385DG diode has a free-running wavelength of 642 nm at 25 ∘C, so we increase its temperature to 40 ∘C to shift the laser gain profile around 647 nm. However, the HL65014DG diode has a free-running wavelength of 649 nm at room temperature and may be cooled to shift gain profile near 647 nm at 18 ∘C. By grating feedback, the high-power single-mode semiconductor laser system can be operated at 647 nm. The characteristics of this diode laser system using HL65014DG are better than HL6385DG diode (e.g. threshold current, gain slope, and power). The laser is assembled in the Littrow configuration in order to establish a frequency selective external cavity. Mode-hope free tuning range of >5 GHz is achieved by controlling piezoelectric transducer and this allows us to observe the broad spectral features of interest for iodine molecular experiment.
The experimental setup is shown in Fig. 2. The laser frequency is stabilized to a Fabry-Prot cavity to reduce its linewidth by controlling the piezoelectric transducer voltage and driving current of the ECDL. As a result, the laser linewidth is reduced from approximately 2 MHz in free-running condition to 100 kHz when locked to the cavity. In general the power of light source is 35 mW after optical isolator. The ECDL output at 647 nm is used for our experiment to measure the iodine transition frequency by modulation transfer technique of saturation spectroscopy. One of the major advantages of this technique is that it provides a nearly flat baseline of an observed spectrum. A polarizing beam splitter (PBS1) and a half-wave plate are used to adequately distribute the power of the pump beam and probe beam. The optical frequency of the pump beam is phase modulated by an electro-optic modulator (EOM) at a modulation frequency of 4.5 MHz and shifted by an acousto-optic modulator (AOM) with a center driving RF frequency of 40 MHz. The RF frequency is chopped at 19.6 kHz by switching the AOM. The AOM is used to prevent interferometric baseline problems inside the iodine spectrometer. The pump and probe beams are overlapped at opposite directions in the iodine cell. The powers of the pump and probe beams are 15.2 mW and 1.6 mW, respectively. The diameter of both beams is approximately 2.5 mm. The probe beam is separated from the pump beam by a polarization beam splitter (PBS3) and detected by an amplified silicon photodiode. The signal is mixed in a double-balanced mixer with the EOM driving frequency to create the error signal. In order to obtain a background-free saturation signal, the mixer output is processed further by a lock-in amplifier (Stanford Research System SR830) with the chopping frequency of AOM as reference. The resulting signal is sent to a proportional, integral and derivative electronic servo circuit (Stanford Research System SIM960) to control the length of the Fabry-Prot cavity so that the laser frequency is locked to the molecular transition.
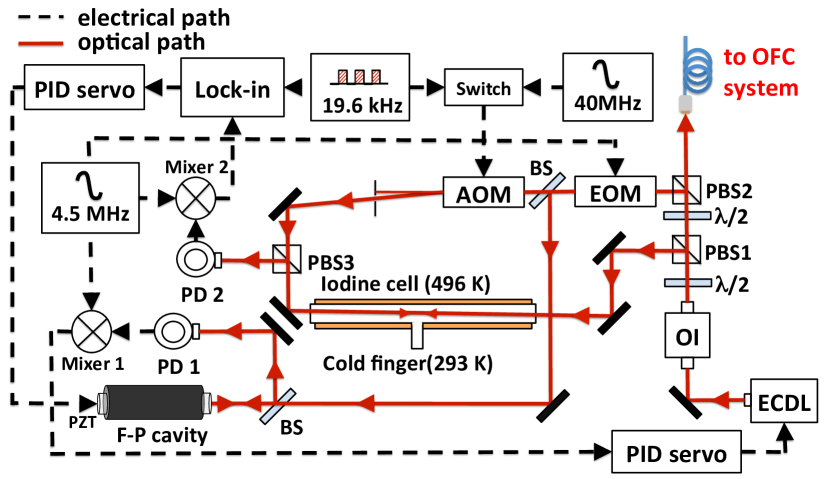
A 58 cm long iodine vapor cell with plane windows fused to the cylindrical body at a slightly tilted angle with light path to avoid interference effects is used and the molecular iodine is contained in cold finger. The cold finger temperature is typically set at 20 ∘C and is allowed to vary from 20 ∘C to 30 ∘C in order to study the effect of pressure shift. The stability of the temperature control of the cold finger is better than 10 mK. The iodine vapor pressure is related to the cold finger temperature of iodine cell by [18]
| (1) |
where is the iodine vapor pressure in Pascals and is the cold finger temperature in Kelvins. The cell body is surrounded with multilayered glass fibre clothes and a tape heater, and its is maintained at 223 ∘C. The heating of iodine vapor is necessary in order to populate the molecules to high-lying vibrational levels in the system.
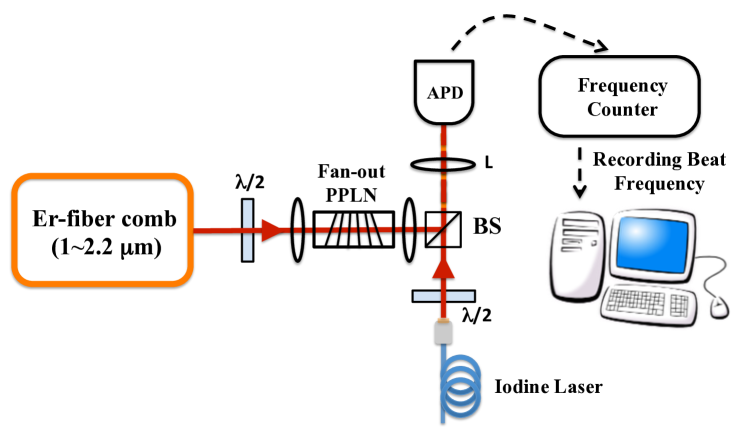
A half-wave plate and a polarization beam splitter (PBS2, see Fig. 2) are used to separate the laser beam into two parts. A 57 mW portion of this beam is sent to an optical frequency comb with a single-mode fiber. When the laser is locked to the molecular iodine transition, the frequency of the 647 nm laser is measured by optical frequency comb. The frequency comb is based on a mode-locked erbium-doped fiber laser [19, 20] pumped by a diode laser at 980 nm and operated at a repetition rate of approximately 250 MHz. The repetition rate frequency is phase locked to the Cs atomic clock (Hewlett Packard 5071A) by controlling the piezoelectric transducer mounted in cavity. The carrier envelop offset frequency of +21.4 MHz is detected using the self-reference method and phase locked to microwave whose reference is connected to Cs atomic clock. A heterodyne beat note is detected with amplified silicon photodiode between the 647 nm light and an fiber comb component, which is frequency doubled by passing the fundamental comb light through a fan-out type periodically poled lithium niobate (PPLN) nonlinear crystal with sum-frequency generation method in Fig. 3. That is read with a frequency counter and is recorded by a computer. The accuracy of the fiber comb is achieved by referencing it to the Cs atomic clock. The Cs atomic clock is calibrated with hydrogen maser by National Time and Frequency Standard Laboratory of Chunghwa Telecom Co., Ltd. The precision of the fiber comb system has reached for less than 1000 s (see Fig. 5). Therefore, the fiber comb introduces negligible errors to our measurement. The iodine transition frequency can be derived by the relation
| (2) | |||||
where is the 647 nm laser frequency, is the repetition rate frequency, is the carrier envelop offset frequency, is the beat note frequency between the 647 nm laser and the fiber comb laser, and is 40 MHz in our case. Here the mode number is a large integer to be determined as follow. We first use a wavelength meter to check our laser frequency to be within 200 MHz of the transition as predicted by the IodineSpec program [21] and iodine spectral atlas databook [22].
We also change the repetition rate and the offset frequency of the comb laser on purpose to further confirm our measurements.
3 Results and Discussions
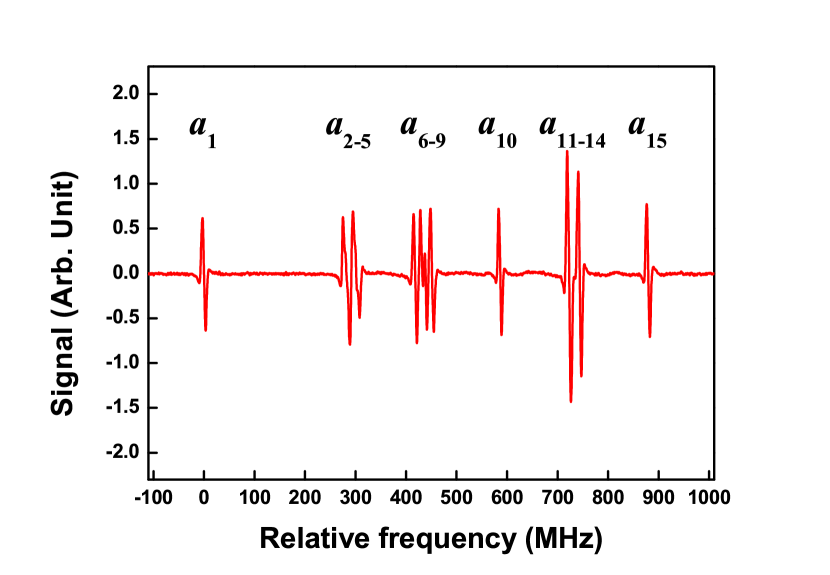
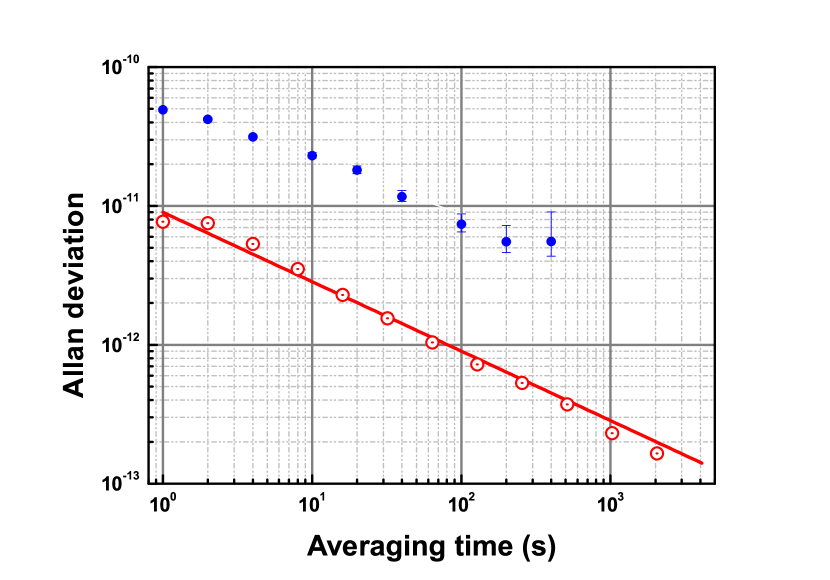
A continuous frequency scans across a full spectral range of the hyperfine structure could be realized without mode-hopping in Fig. 4. For the ground state of molecular iodine with an even rotational quantum ( = 46, for our case), the rovibrational energy level is split into 15 sublevels. However, the three resolved lines , , and are clearly separated from other lines and are preferable for laser stabilization. We perform measurements on the , , and components of the P(46) 5-4 transition of . The signal-to-noise ratio (SNR) of the component is approximately 200 for a lock-in time constant 30 ms and 12 dB/octave slop. To measure the transition frequency, partial light of laser is coupled into a single-mode fiber and sent to an optical frequency comb. The frequency stability of the laser locked to the P(46) 5-4 line is measured by recording the beat frequency between the laser and the frequency comb with a 100 ms gate time by a frequency counter (Pendulum CNT-90, type). The total measurement time is 1700 s. The calculated Allan deviation is shown in Fig. 5. The stability of the stabilized laser reaches a level of 5 10-12 at a 200 s integration time.
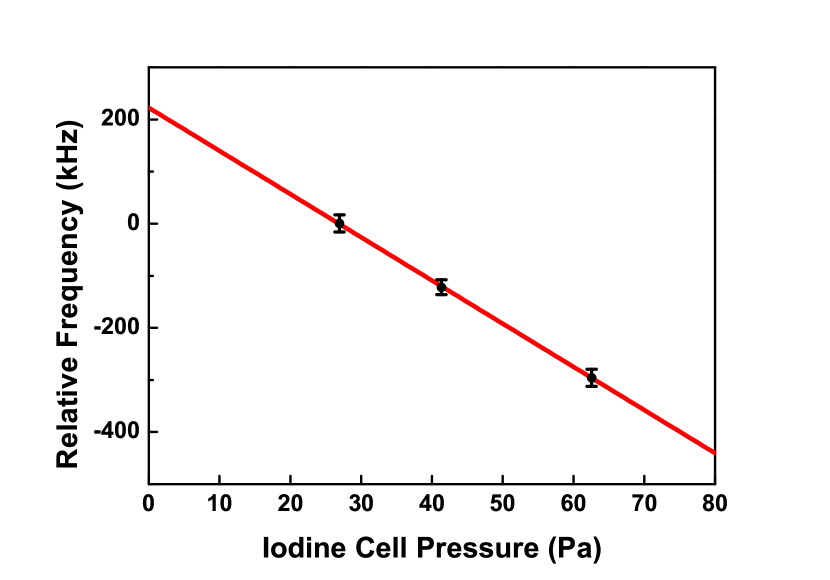
In order to accurately determine the transition frequency at zero pressure, the pressure dependence must be carefully studied. We vary the cold finger temperature to change the iodine vapor pressure according to Eq. (1) and wait for minutes for temperature stabilization. Typical data are shown in Fig. 6. The result shows great linearity at the pressure range between 20 and 65 Pa. A linear fit is employed to extract the slope of the pressure shift. At our level of precision, we do not observe differences in the slopes among the three components we measure. Therefore, we combine all the results and obtain a coefficient of pressure shift as -8.30.7 kHz/Pa. We then use this coefficient to correct all the measured results to obtain the zero-pressure values.
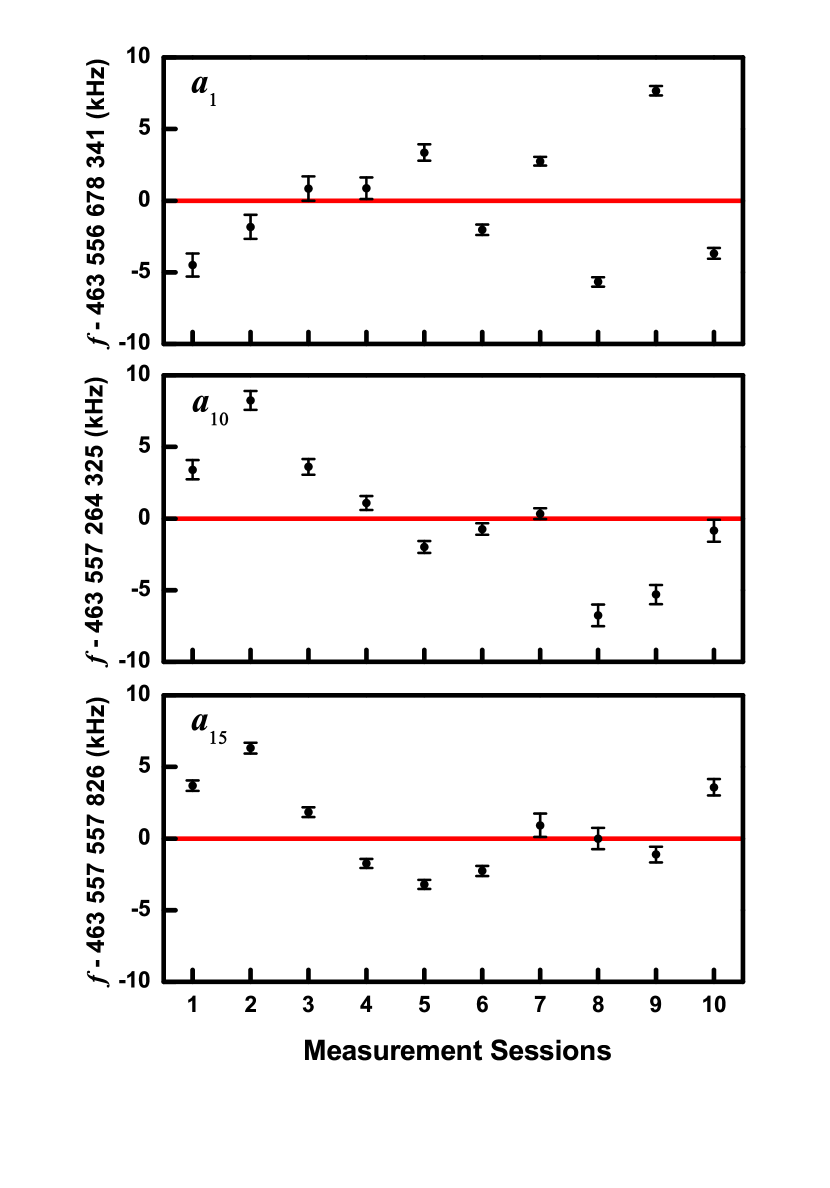
Figure 7 shows the results for the three components obtained over several days. Each data point consists of 2000 measurements with cold finger of 20 . During the 10 session points, we repeated the process of locking and unlocking the laser. The servo electronic offset, for example, a dc voltage offset between the baseline of the spectrum and the lock point, was adjusted by servo parameter to <0.5 mV with average time to avoid the offset in the laser frequency. An estimate of the frequency stability () can be obtained by dividing the linewidth by the signal-to-noise ratio (SNR), leading to 23 kHz. The sources of measurement uncertainties are summarized in Table 1.
4 Conclusion
In summary, we have measured the absolute transition frequencies of the P(46) 5-4 , , and hyperfine transitions at 647 nm by modulation transfer saturation spectroscopy with the aid of an optical frequency comb. The results (see Table 2) are in agreement with the prediction of IodineSpec5, in which the expected uncertainty () in this wavelength is quoted to be 3 MHz [21]. The effect of pressure shift is important at our level of precision, and our measurement yields a linear dependence with a slop of -8.3(7) kHz/Pa. Our precision measurements at 647 nm will help to reduce the uncertainties of the iodine atlas. In addition, our laser system can serve as a reference for transition of the lithium spectroscopy.
| Source | Correction | Error | |
|---|---|---|---|
| Pressure shift | 224 | 19 | |
| Locking effect | 5 | ||
| Statistical stability | : | — | 6 |
| : | — | 7 | |
| : | — | 6 |
| P(46) 5-4 | Measured | Calculated | Deviation |
|---|---|---|---|
| 463 556 678 565(21) | 463 556 679 461 | -896 | |
| 463 557 264 549(21) | 463 557 265 431 | -882 | |
| 463 557 558 050(21) | 463 557 558 984 | -934 | |
| 585 984(30) | 585 970 | 14 | |
| 293 501(30) | 293 553 | -52 |
Acknowledgment
We gratefully acknowledge the financial support from the Ministry of Science and Technology and the Ministry of Education of Taiwan. L.-B. Wang receives support from Kenda Foundation as a Golden-Jade fellow. We thank the National Time and Frequency Standard Laboratory of Chunghwa Telecom Co., Ltd. for providing the Cs atomic clock. We also thank Dr. H. Knckel for providing the IodineSpec5 software, which is essential for our experiment.
References
- [1] W.-Y. Cheng, L. Chen, T. H. Yoon, J. L. Hall, and J. Ye, “Sub-doppler molecular-iodine transitions near the dissociation limit (523–498 nm),” Opt. Lett. 27, 571–573 (2002).
- [2] H.-M. Fang, S. Wang, and J.-T. Shy, “Pressure and power broadening of the component of R(56) 32-0 transition of molecular iodine at 532 nm,” Opt. Commun. 257, 76–83 (2006).
- [3] Y.-C. Huang, H.-C. Chen, S.-E. Chen, J.-T. Shy, and L.-B. Wang, “Precise frequency measurements of iodine hyperfine transitions at 671 nm,” Appl. Opt. 52, 1448–1452 (2013).
- [4] Y.-C. Hsiao, C.-Y. Kao, H.-C. Chen, S.-E. Chen, J.-L. Peng, and L.-B. Wang, “Absolute frequency measurement of the molecular iodine hyperfine transitions at 548 nm,” J. Opt. Soc. Am. B 30, 328–332 (2013).
- [5] T. Zelevinsky, D. Farkas, and G. Gabrielse, “Precision measurement of the three helium fine structure intervals,” Phys. Rev. Lett. 95, 203001 (2005).
- [6] Y.-C. Huang, W.-J. Luo, Y.-T. Kuo, and L.-B. Wang, “Precision measurement of hyperfine intervals in the lines of atomic ,” J. Phys. B: At., Mol. Opt. Phys. 46, 075004 (2013).
- [7] A. K. Singh, L. Muanzuala, and V. Natarajan, “Precise measurement of hyperfine structure in the state of using saturated-absorption spectroscopy,” Phys. Rev. A 82, 042504 (2010).
- [8] P.-L. Luo, J.-L. Peng, J.-T. Shy, and L.-B. Wang, “Precision frequency metrology of helium transition,” Phys. Rev. Lett. 111, 013002 (2013).
- [9] P.-L. Luo, Y.-C. Guan, J.-L. Peng, J.-T. Shy, and L.-B. Wang, “Measurement of the 2 transition frequency in ,” Phys. Rev. A 88, 054501 (2013).
- [10] J. Biesheuvel, J.-Ph. Karr, L. Hilico, K. S. E. Eikema, W. Ubachs, and J. C. J. Koelemeij, “Probing and fundamental constants through laser spectroscopy of vibrational transitions in ,” Nature Commun. 7, 10385 (2016).
- [11] D. A. Tieri, J. Cooper, B. T. R. Christensen, J. W. Thomsen, and M. J. Holland, “Laser stabilization using saturated absorption in a cavity-QED system,” Phys. Rev. A 92, 013817 (2015).
- [12] A. J. Daley, “Quantum computing and quantum simulation with group-ii atoms,” Quantum Inf. Proc. 10, 865–884 (2011).
- [13] A. Dareau, M. Scholl, Q. Beaufils, D. Döring, J. Beugnon, and F. Gerbier, “Doppler spectroscopy of an ytterbium bose-einstein condensate on the clock transition,” Phys. Rev. A 91, 023626 (2015).
- [14] T. Kobayashi, D. Akamatsu, K. Hosaka, H. Inaba, S. Okubo, T. Tanabe, M. Yasuda, A. Onae, and F.-L. Hong, “Absolute frequency measurements and hyperfine structures of the molecular iodine transitions at 578 nm,” J. Opt. Soc. Am. B 33, 725–734 (2016).
- [15] P. M. Duarte, R. A. Hart, J. M. Hitchcock, T. A. Corcovilos, T.-L. Yang, A. Reed, and R. G. Hulet, “All-optical production of a lithium quantum gas using narrow-line laser cooling,” Phys. Rev. A 84, 061406 (2011).
- [16] C. Gross, H. C. J. Gan, and K. Dieckmann, “All-optical production and transport of a large quantum gas in a crossed optical dipole trap,” Phys. Rev. A 93, 053424 (2016).
- [17] W. Nagourney, W. Happer, and A. Lurio, “Level-crossing study of the hyperfine structure of lithium,” Phys. Rev. A 17, 1394–1407 (1978).
- [18] L. J. Gillespie and L. H. D. Fraser, “The normal vapor pressure of crystalline iodine,” J. Am. Chem. Soc. 58, 2260–2263 (1936).
- [19] J.-L. Peng, H. Ahn, R.-H. Shu, H.-C. Chui, and J. Nicholson, “Highly stable, frequency-controlled mode-locked erbium fiber laser comb,” Appl. Phys. B 86, 49–53 (2007).
- [20] H. Inaba, Y. Daimon, F.-L. Hong, A. Onae, K. Minoshima, T. R. Schibli, H. Matsumoto, M. Hirano, T. Okuno, M. Onishi, and M. Nakazawa, “Long-term measurement of optical frequencies using a simple, robust and low-noise fiber based frequency comb,” Opt. Express 14, 5223–5231 (2006).
- [21] We have used IodineSpec version 5 to simulate these transitions. For the actual status of the program, contact knoeckel@iqo.unihannover.de.
- [22] H. , M. Baba, S. Kasahara, K. Ishikawa, M. Misono, Y. Kimura, J. O’Reilly, H. Kuwano, T. Shimamoto, T. Shinano, C. Fujiwara, M. Ikeuchi, N. Fujita, M. H. Kabir, M. Ushino, R. Takahashi, and Y. Matsunobu, Doppler-Free High Resolution Spectral Atlas of Iodine Molecule 15000 to 19000 cm-1. (Japan Society for the Promotion of Science, 2000).
- [23] The Cs atomic clock is calibrated with hydrogen maser by National Time and Frequency Standard Laboratory of Chunghwa Telecom Co., Ltd.