Scale invariant cosmology and CMB temperatures as a function of redshifts
Abstract
Cosmological models assuming the scale invariance of the macroscopic empty space show an accelerated expansion, without calling for some unknown particles. Several comparisons between models and observations (tests on distances, diagram, vs. plot, age vs. , vs. , transition braking-acceleration) have indicated an impressive agreement (Maeder, 2017). We pursue the tests with the CMB temperatures as a function of redshifts . CO molecules in DLA systems provide the most accurate excitation temperatures up to . Such data need corrections for local effects, like particle collisions, optical depths, UV radiation, etc. We estimate these corrections as a function of the ratios from far UV observations of CO molecules in the Galaxy. The results show that it is not sufficient to apply theoretical collisional corrections to get the proper values of vs. . Thus, the agreement often found with the standard model may be questioned. The relation needs further careful attention and the same for the scale invariant cosmology in view of its positive tests.
1 Introduction
Unlike theories with modified gravity, the scale invariant models further explore the invariance properties of space-time, which as emphasized by Dirac (1973) play a fundamental role in physics. It is well known that the presence of matter in a system tends to kill the scale invariance of the physical laws (Feynman, 1963). However, the empty space at large scales may have the property of scale invariance, a property that is present in Maxwell equations in absence of charge and current. Weyl (1923), Eddington (1923), Dirac (1973) and Canuto et al. (1977) have developed a theory which, in addition to the general covariance of General Relativity (GR), also permits (but does not demand) the invariance to a scale transformation . In this most general framework, the assumption of scale invariance of the macroscopic empty space leads to two differential equations between the cosmological constant and the scale factor . Adopting the postulate of GR that gravitation universally couples to all energy and momentum contributions (Carroll et al., 1992), we account for the contribution from the –derivatives and obtain new basic cosmological equations (Maeder, 2017). They lead, after an initial braking phase, to a general acceleration of the cosmic expansion for models with a density parameter .
The properties of these models have been studied and detailed tests have been performed (Maeder, 2017), in particular on the distances, the magnitude–redshift relation, the vs. plot, the relation between and the age of the Universe, the expansion rates vs. redshifts and the transition from braking to accelerated expansion. All these tests were very well satisfied without calling for some dark energy. This is why further exploration is necessary.
The relation of the temperatures of the cosmic microwave background (CMB) as a function of redshifts is a fundamental cosmological test (Peebles, 1993). Deviations from the standard laws, if they exist, may appear at large enough redshifts. The Sunyaev-Zeld’ovich (SZ) effect provides some tests (Luzzi et al., 2015) for low . At such low , different models predict only small differences within the error bars. Chluba (2014) consider that these tests have a limited applicability. The situation is better for the tests based on molecular absorption in the diffuse intergalactic gas, particular from CO lines by Srianand et al. (2008); Noterdaeme et al. (2010, 2011, 2017). The observations of the rotational excitation of the CO molecules in Damped Lyman– (DLA) systems up to have recently been possible (Srianand et al., 2008). At present, remarkably 6 absorption–line systems produced by clouds of diffuse gas have been detected on the sight lines of more than 40 000 quasars investigated. The CO molecules emit a spectrum with spectral lines in radio, infrared and far-ultraviolet from rotational, vibrational, and electronic transitions. There are several lines observable in the near UV and visible spectral domains (due to the redshift). Their simultaneous fitting leads to improved determinations of the excitation temperatures. These objects, despite their rareness, appear extraordinarily interesting in view of their higher accuracy and the redshifts they concern.
In Sect. 2, we study the heating and cooling processes intervening in the excitation of the CO molecules and try to estimate the global amplitude of these effects from Galactic data. In Sect. 3, the excitation temperatures in DLA systems are discussed and corrections are applied to get the temperatures of the CMB at different . Comparisons of models and observations are performed in Sect. 4. Sect. 5 gives a conclusion.
2 Contributions to the excitation of the CO rotational levels
In addition to the CMB radiation, various physical effects in the diffuse gas may influence the absorption profiles of the fine structure atomic levels and of the rotational levels of molecular lines, and thus the determinations of the the excitation temperature of the gas. A thorough review of the heating and cooling processes in the interstellar gas has been given by Lequeux (2005), see also Wolfire et al. (1995). We will concentrate here on the efficient physical effects in molecular regions, with a particular interest on those potentially able to influence the excitation temperature of the CO molecules, which have a ground rotational transition at an energy corresponding to a temperature of 5.54 K. The significant effects should normally be accounted in order to permit a reliable CMB temperatures at different redshifts. However, corrections for local effects influencing the excitation temperatures in DLA systems have in general not been applied to the CO observations, (on the six observations, only one (Noterdaeme et al., 2017) has been corrected, see below).
2.1 Molecular regions: heating effects influencing the CO excitation
There are many processes contributing to the heating of an interstellar molecular region. The basic effect is the ejection of an electron from an atom (or a molecule) by an incident photon or a particle, the electron heating the gas by further collisions which rapidly ( yr) thermalize the gas. The main processes are the following ones. The heating by low-energy cosmic rays: this process is always present due the high penetration of cosmic rays, but it is generally insignificant, except in the depths of molecular clouds where it can even dominate. A cloud model (Noterdaeme et al., 2017) illustrates the increase of the relative role of cosmic rays with depth in the cloud, where they dominate for relatively low temperatures. The grain photoelectric emission: it results from the ambient UV flux which removes electrons from the grains. The electrons carry a large fraction of the energy of the incident UV photon and thermalize the medium by collisions. This process is most efficient in HII and neutral regions, but it may still remain efficient in the photodissociation regions, intermediate between the HII and molecular regions. The above mentioned cloud model shows that this process is still dominant in a large part of the cloud where CO molecules are present. The chemical energy of H2 formation: the formation of a H2 molecule from atomic hydrogen is a very exothermal reaction, yielding energy mainly to the excitation of H2 and the kinetic energy of the gas. This process is present in the outer layers of the the molecular region, though about an order of a magnitude lower than the previous mechanism. The photon trapping: it occurs in regions of high optical depths, which may largely reduce the effect of spontaneous emission (Lequeux, 2005). For example, the de-excitation photons from a CO molecule may be re-absorbed by another CO molecule. This decrease the radiative cooling, so that the interactions with H2 molecules equilibrate at a higher temperature (Burgh et al., 2007). The grain–gas thermal exchange: it intervenes due to the collisions between the dust grains and atoms or molecules in the gas. A high density of the medium favors the process, which is thus generally unimportant in the diffuse gas, (there, the grains being colder than the gas may provide some minor cooling). However, in the depths of giant molecular clouds, the grains may be heated by the far IR radiation, which easily penetrate the clouds. This process dominates in molecular clouds with a concentration higher than cm-3 (Lequeux, 2005). However, Wannier et al. (1997) have shown that, even in a relatively diffuse gas with between 100 and 1000 cm-3, the millimeter–wave emission from the dust of a nearby cloud may provide a significant specific increase of the CO– rotational excitation temperature, (the effect evidently depends on the solid angle presented by the cloud). The UV pumping by molecules: it is an efficient mechanism only in regions exposed to a strong UV flux. The molecules are then excited rotationally and vibrationally by the absorption of UV photons and the de-excitation transfers some energy to the gas. This process is often killed by dust extinction (Krotkov et al., 1980). As CO molecules require screening from UV radiation to exist, this process may not be dominant for their excitation.
As to the cooling processes, the cooling by the emission of fine–structure lines is mainly due to CII and OI in neutral regions, while in HII regions and deep molecular clouds it becomes insignificant (Lequeux, 2005). The de-excitation of level of hydrogen, which may be collisionally excited, produces the Lyman– line. In molecular regions, the main cooling results from the radiation by the fundamental rotational transition of CO molecules at 2.6 mm. The emission from CI with a first level of excitation at K may also be significant. The recombination of charged particles on grains, by the inverse process of the above mentioned grain photoelectric emission, produces a cooling which is rapidly growing with temperature. The grain-gas thermal exchange, as we have seen above, is insignificant in a cold diffuse gas.
Energy losses by induced or stimulated emission do not seem significant processes in the diffuse or translucent interstellar medium. Stimulated emission by OH, H2O, NH3, HCN or SiO molecules is known to produce the maser effect under certain conditions in dense molecular regions. Even for these relatively easily excited molecules, densities in excess of cm-3 are required, i.e. two orders of magnitude higher than in the diffuse or translucent interstellar gas. To be active, the process also requires a high velocity coherence to avoid Doppler shifts, so that extended low density regions are unfavorable.
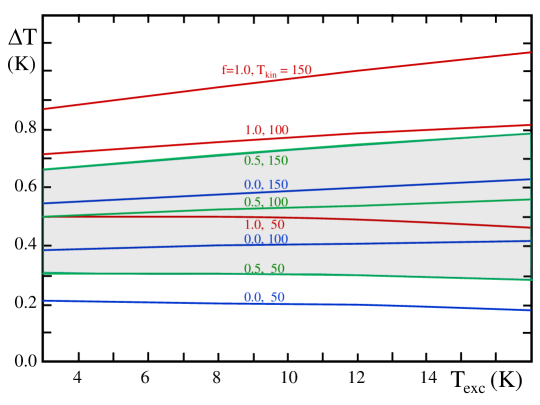
The sum of all the heating and cooling processes leads to a certain equilibrium state in the interstellar medium dominated by H atoms and H2 molecules. In this medium, the particular excitation temperature of the CO molecules depends on all the above mentioned mechanisms and on their collisional interactions with the main gas components. Sobolev et al. (2015) have recently studied the population distribution of the rotational states of the CO molecules (12C16O) taking into account the CMB radiation and the collisional excitation by H, H2 and He. Their results are based on experimentally measured probabilities of collisional transitions. They provide the corrections to be applied to of CO molecules to get the CMB temperatures. These corrections essentially depend on the following four physical factors in the intervening cloud on the sight line of quasars. – 1. The total concentration of particles in the gas. – 2. The hydrogen molecular fraction , where and are the concentrations of the atomic and molecular hydrogen. – 3. The kinetic temperature of the gas. – 4. The observed excitation temperature of the CO molecules. Fig. 1 illustrates the corrections derived from the analytical expressions by Sobolev et al. (2015) as a function of due to particle collisions for some typical conditions. These corrections are to be subtracted from the excitation temperatures to get the CMB temperatures . The values of depend linearly on the concentration and are given for different values of and . We see that they show little variations with the excitation temperatures, while they are more sensitive to the three other parameters.
Clearly, the above corrections are an important piece of information about the corrections to be applied to the ”observed” excitation temperature. However, these collisional corrections do not account for all intervening heating and cooling processes influencing the CO excitation, thus the effective total corrections to be applied to to get from CO molecules may be different from those given in Fig. 1. No corrections have in general been applied by the different authors to the observed DLAs with CO lines, except for the translucent molecular cloud on the sight line of J0000+0048 (Table 1) which has received a collisional correction according to the developments by Sobolev et al. (2015) .
2.2 The excitation temperatures in the Milky Way and the estimates of the corrections
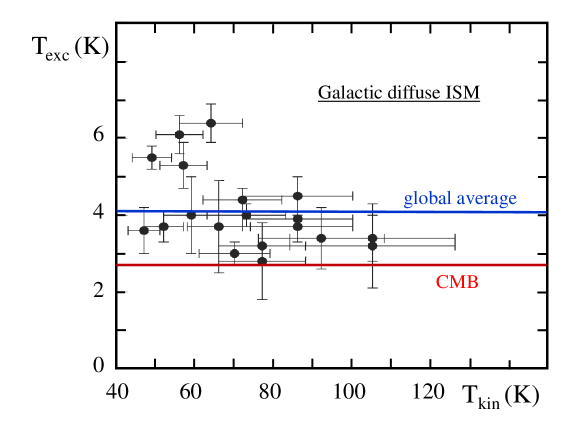
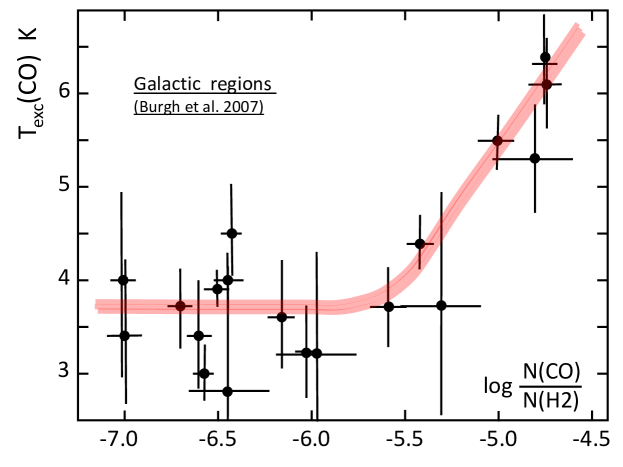
CO molecules produce absorption bands in the UV which permits their detection. On the basis of far-UV data from HST STIS and FUSE, Burgh et al. (2007) have studied the interrelations between the physical properties of CO and H2 molecules in diffuse and translucent regions towards 23 OB stars in the Milky Way. The average of CO molecules (12C16O) is K, with space densities between 20 and 200 cm-3 and an average . (There are 6 sight lines, where 13CO could be observed and specific excitation temperature be determined, but in most cases and even more for DLAs, the observation of 13CO is not achievable at present time). The above ranges covered by the parameters , and , as well as the abundance pattern, are rather similar in the diffuse gas of the Milky Way and in DLA systems with CO lines. We note, however, that the ambient UV flux generally appears higher or equal in DLA systems compared to the Milk Way (Ge et al., 1997; Srianand et al., 2000; Lima et al., 2000; Molaro et al., 2002; Srianand et al., 2005, 2008; Noterdaeme et al., 2010). As shown by Fig. 2, the distribution of the CO excitation temperatures obtained by Burgh et al. (2007) spans a large range of values above the local CMB temperature K (Fixsen, 2009). The average of these -values is 4.095 K, higher by 1.37 K than the local CMB temperature. Burgh et al. (2007) also point out that, for CO column densities from cm-2 and above, the average from CO lines reaches = 5.2 K (5.43 K for the weighted mean), i.e. 2.50 K (2.7) K higher than . For CO column densities inferior to cm-2, Burgh et al. (2007) find an average K, (the weighted average is 3.69 K, i.e. about 0.96 K higher than ). They note that the increase of for high CO (see also Fig. 3) may result from ”photon trapping” in regions with a higher optical depth, photons being absorbed by more than one CO molecule so that the radiative cooling is reduced. Burgh et al. (2007) also find some relations between the molecular ratios and the extinction properties (color excess and absorption rate in mag/kpc) for the various diffuse and translucent regions studied.
Referring to Sect. 2.1, we may remark that for the above average values of , and from 20 to 200 cm-3, we have a collisional correction between 0.069 K (for = 20) and 0.69 K (for = 200). For a mean value value of the space density cm-3, the typical collisional correction would be 0.35 K. This is much smaller than what suggested by the above observations in Fig. 2. It means that if we account only for the collisional broadening of the lines according to Sobolev et al. (2015), we may underestimate by a large amount the total corrections to be applied to the observed of the CO lines (12C16O).
The above mentioned results by Burgh et al. (2007) indicates an effect of the optical thickness of the intervening interstellar gas on the determination of the of CO lines. In a cloud model by Bolatto et al. (2013), the CO is optically thin for column densities of the CO gas less than about cm2. For this limit, the CO gas in DLAs with a low value would appear to be generally optically thin. We note this is not the case for the translucent molecular cloud along the sight line of J0000+0048, even with . Moreover, Burgh et al. (2007) in their Fig. 5 show that the Galactic lines of sight with molecular fractions above have extinction ratios of 1 mag/kpc or more. This suggests that the optical depths of the DLA sample of Table 1, which when available have , may still be significant, if the physical conditions are similar. (I am indebted to the referee for these valuable comments). For a thin optically medium, the emergent line intensity grows linearly with the optical thickness times a second term given by the populations of the corresponding levels multiplied by the transition probabilities. For high optical depths, it converges towards the second term. The sample of Galactic data by Burgh et al. (2007) cover the low optical depth domain (diffuse gas) as well as the transition region to significant optical depths (translucent medium). The same range is generally present for DLAs.
Burgh et al. (2007) point out that the ratios are very different for these two regimes, both being orders of magnitude lower than for dark molecular clouds. They find significant relations between the ratios and extinction properties, such as the color excess and the extinction by distance unit . For the thicker sight lines, the ratios increase very quickly. Thus, in view of these various regimes, we proceed to individual temperature corrections for each absorption system on the quasar sight lines, using the above CO molecular fraction, that correlates with absorption properties as shown by Burgh et al. (2007). Fig. 3 shows the relation between the excitation temperatures of the CO molecules and the ratios for the Galactic sample. The 6 regions with are also the 6 regions with in Fig. 3. For them, we notice a relatively well defined relation with a steep increase of with . This corresponds to the transition region towards the optically thick region and this enables us to perform individual corrections in the transition domain. For the flat part of the curve corresponding to the optically thin region below about , the mean temperature is 3.69 K, leading to a correction of K, when compared to the WMAP determination of the CMB temperature of 2.726 K (Fixsen, 2009). For the steep region, the corrections will depend on the observed ratios. The question is now: to what extent can we apply these last corrections to the DLA sample? This essentially depends on whether the physical parameters are similar to those in the Galactic gas.
3 The excitation and CMB temperatures in DLA systems
As mentioned above, from the 40 000 quasars investigated, 6 CO absorption–line systems produced by clouds of diffuse or translucent gas on their sight–line have yet been detected. In general in the interstellar medium, carbon is found in different forms from the external to the inner parts of the clouds: ionized, atomic and molecular CO in central regions where the shielding from ambient UV radiation is larger. The difficulty is that at the same time the dust extinction is generally larger, making the observations of CO absorption lines more difficult or preventing them. The noticeable successful observations of CO were performed with the UVES spectrograph on the VLT (Srianand et al., 2008; Noterdaeme et al., 2010, 2011, 2017).
3.1 CO observations and properties in DLA systems
Let us mention these major findings by order of discovery. Their specific data are given in Table 1, where we collect, when available, the physical parameters of the diffuse gas in the six DLA absorbers where CO has been observed. The first detection of CO absorption lines in a DLA system was made by Srianand et al. (2008) with UVES at towards the quasar J143912+111740. The physical parameters given in Table 1 indicate a similarity of the physical conditions with those of the diffuse Galactic interstellar material. No collisional correction was applied. Thus, the derived value of was taken equal to the observed , which is 0.17 K lower that the theoretically predicted .
The sub-damped Ly– system at towards J123714+064759 was studied by Noterdaeme et al. (2010) with the VLT/UVES and X-shooter spectrographs. The mean molecular fraction –value is 0.24, but in some component of the cloud it could be close to 1.0. This absorption region with both atomic and molecular carbon classifies as a translucent one. From the electronic density they derived, the authors deduced that the local UV flux in this DLA system is similar to that in the Milky Way. No correction to was applied to get , despite the fact that this translucent region is unlikely optically thin.
Three new CO absorption-line systems were observed by Noterdaeme et al. (2011) with the same instrument and reduction process as before. A system at was observed on the sight line of J104705+205734. Two systems were also observed, one at towards J085726+185524, and another one at towards J170542+354430. These two systems are hardly resolved, but best–fit models nevertheless provide the excitation temperatures. No corrections were applied to these three systems.
| Quasar | (CO) | log N(CO) | log N(H2) | log | ref. | |||||
|---|---|---|---|---|---|---|---|---|---|---|
| (K) | (cm-3) | (K) | ||||||||
| J0000+0048 | 2.5255 | 50 | 0.46 | 80 | 9.9 | 14.95 | 20.43 | -5.48 | 4 | |
| J085726+185524 | 1.7293 | – | – | – | 7.5 | – | – | – | 3 | |
| J104705+205734 | 1.7738 | – | – | – | 7.8 | 14.74 | – | – | 3 | |
| J123714+064759 | 2.6896 | 108 | 0.24 (1.0) | 50-60 | 10.5 | 14.17 | 19.21 | -5.04 | 2 | |
| J143912+111740 | 2.4184 | 105 | 0.27 | 45-62 | 9.15 | 13.89 | 19.38 | -5.49 | 1 | |
| J170542+354340 | 2.0377 | – | – | – | 8.6 | – | – | – | 3 |
A molecular cloud classified as a DLA at along the sight line of J0000+0048 has been recently studied in great details by Noterdaeme et al. (2017). The derived molecular fraction is , which is the highest average observed in a high- intervening system. The properties of this translucent regions compare well with those of the Galactic Perseus complex (Noterdaeme et al., 2017). The collisional correction derived by the authors amounts to 0.3 K on the basis of the data by Sobolev et al. (2015). Applied to the observed K (+0.7,-0.6), it leads to a value , in agreement with the standard value for this redshift.
3.2 Applications of the Galactic temperature corrections
There is evidently a great variety of physical conditions in DLA systems. Some also have an UV radiation field up to 10-100 times the Galactic one, in that case the molecular fraction is very low (Reimers et al., 2003) and such systems show no CO molecular absorption. However, the systems with C and CO molecules typically show physical conditions and UV radiation fields close to those of the Galactic diffuse gas. To some extent, the presence of CO molecules imposes a limited domain in the space of the physical parameters. Molaro et al. (2002) detect a Galactic type UV radiation field in a DLA system at with various C absorption lines. Srianand et al. (2008) conclude that the physical conditions in the object at (with the first discovered CO lines) are similar to those in the diffuse Galactic clouds. For the second discovery, Noterdaeme et al. (2010) find a molecular fraction typical of the Galactic conditions. They also point out the similarity of the abundance patterns. Noterdaeme et al. (2017) also find physical properties (density, molecular fraction, UV radiation,…) in the Perseus-like system at very similar to the conditions observed in the Milky Way. All these comparisons support the application of the temperature corrections based on the Galactic diffuse gas to the excitation temperature of CO molecules in DLA systems.
A study of of the physical conditions in 33 DLA systems with significant molecular absorption lines of H2 and lines of carbon in various excitation states has been performed by Srianand et al. (2005) on the basis of a sample collected by Ledoux et al. (2003). The mean kinetic temperature is 153 K, significantly higher than the Galactic one (74 K. The mean H2 molecular fraction found by Ledoux et al. (2003) is smaller than 0.1. This value is in fact an average over the whole line of sight, the actual in the individual DLA components may be much larger, as emphasized by Srianand et al. (2005). The mean particle concentration is cm-3 quite in the observed Galactic range of 20-200 cm-3. As to the ambient UV radiation field, Srianand et al. (2005) conclude that it is of the order or slightly higher than the mean UV radiation field in the Galactic interstellar material. These results also suggest that the local excitation processes of molecular lines are equal or slightly higher in DLA clouds than in the Galactic interstellar medium.
Table 2 gives the various determinations of the CMB temperatures. The given by the different authors are given in column 3. Except for J0000+0048 they are identical to the determined excitation temperatures (see Table 1). The corrections determined from the Galactic data in Fig. 3 are given in column 4. The corrections amounts to 0.96 K for objects belonging the flat part of the curve below . For objects with above this last value, the corrections are determined individually from the red curve in Fig. 3 with the same error bar of K, despite the fact that there the scatter may appear lower. The –values obtained with these corrections are given in column 5 of the Table 2. To enable further comparisons, the theoretical values corresponding to the observed redshifts are given in columns 6 and 7 for the standard and scale invariant cosmology respectively according to Sect. 4.
| Quasar | Obs. | T-corrections | Obs. | (z) | ||
|---|---|---|---|---|---|---|
| ref.1,2,3,4 | from Sect. 2.2 | corrected | Std. th. | Sc. inv. | ||
| J0000+0048 | 2.5255 | 9.6 | 2.57 | 7.33 | 9.61 | 8.27 |
| J085726+185524 | 1.7293 | 7.5 | 0.96 | 6.54 | 7.44 | 6.53 |
| J104705+205734 | 1.7738 | 7.8 | 0.96 | 6.84 | 7.56 | 6.62 |
| J123714+064759 | 2.6896 | 10.5 | 1.32 | 9.18 | 10.06 | 8.63 |
| J143912+111740 | 2.4184 | 9.15 | 1.30 | 7.85 | 9.32 | 8.03 |
| J170542+354340 | 2.0377 | 8.6 | 0.96 | 7.64 | 8.28 | 7.20 |
There is another concern, related to the slightly higher values of in the DLA sample, from 7.5 to 10.5 K (Table 1), compared to 2.8 to 6.4 K in the Galaxy (Fig. 2). The values of are determined by assuming a Boltzmann distribution of the populations of the rotational levels, which are fitted by a single value . This value is given by the slope of a plot vs. the energy of the –level considered ( being the statistical weight). At least four values of have been considered by the authors quoted in Table 1 up to a value corresponding to 33 K. For J0000+0048, even a value at about 55 K has been used. In view of the broad ranges of level energies involved in the plot, a difference between K and 9 K only has a very limited effect on the –corrections. Moreover, Fig. 1 shows that the collisional corrections slightly increase with . These facts tend to indicate that the corrections we apply are not overestimated, especially more than the UV flux is equal or higher in DLA systems than in the Milky Way.
| standard | scale invariant | |||
| 0 | 1 | 2.726 | 1 | 2.726 |
| 0.2 | 0.94073 | 3.271 | 0.96991 | 3.173 |
| 0.4 | 0.89735 | 3.816 | 0.94728 | 3.615 |
| 0.6 | 0.86441 | 4.362 | 0.92973 | 4.055 |
| 1.0 | 0.81807 | 5.452 | 0.90447 | 4.931 |
| 1.5 | 0.78138 | 6.815 | 0.88396 | 6.024 |
| 2.0 | 0.75753 | 8.178 | 0.87035 | 7.118 |
| 2.5 | 0.74102 | 9.541 | 0.86082 | 8.213 |
| 3.0 | 0.72905 | 10.904 | 0.85384 | 9.310 |
| 4.0 | 0.71309 | 13.630 | 0.84444 | 11.510 |
| 10.0 | 0.68341 | 29.986 | 0.82669 | 24.789 |
| 0.66945 | 2.728 | 0.81820 | 2.232 |
4 Comparisons with cosmological models
4.1 The classical model
Since matter and radiation are decoupled in the present era of the Universe, energy conservation implies for the radiation energy density . In turn, since , we have . With , this gives the classical relation for the CMB temperature law, see for example Peebles (1993),
| (1) |
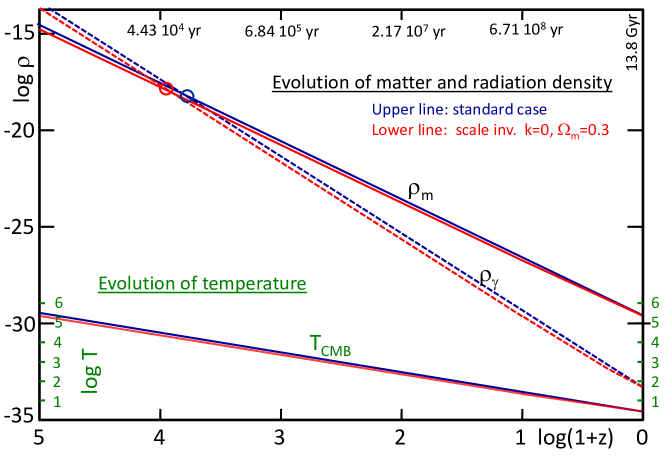
The blue line in Fig. 4 illustrates the past variations of , as well as of the matter and radiation densities and respectively. These relations are not sensitive to the shape of the expansion function (only for the classical case), as are the tests based on distances such as the diagram (Riess et al., 1998; Perlmutter et al., 1999), or as the past expansion rates vs. redshifts (Farooq & Ratra, 2013).
4.2 The scale invariant model
Several basic properties of the scale invariant cosmology, that accounts for the scale invariance of the empty space, were studied recently (Maeder, 2017). The numerical solutions of the cosmological models were presented. Comparisons with observations were performed for several major tests, with positive results. From the cosmological equations, we got the following equation of conservation,
| (2) |
which for a constant evidently gives the classical expression. From the equation of state in the general form with =1 ( being taken here as a constant) and after integration, we obtained
| (3) |
It implies that the curvature of space associated to a distribution of mass–energy has some dependence on and thus on time, since the scale factor is equal to (Maeder, 2017). For radiation density , we have and thus This leads to and the temperature of the CMB radiation behaves like
| (4) |
The domain of –values depends on the density parameter . For an empty model with , one would have at the origin and thus would enormously vary, from to 1 at present. If matter–energy is present in the Universe, the effects of scale invariance tend to disappear (Feynman, 1963). For , the whole range is limited from at the origin to 1 at present.The value appears as the limit above which scale invariance is absent from cosmological models.
Fig. 4 shows the past evolution of , and as a function of redshifts. We note the very small separations between the standard and scale invariant cases. The curves start separating at low and then from onwards their separations remain about constant, because the value of does not change significantly in the early explosive phases. The highest separation amounts to 0.087 dex for , 0.174 dex for and 0.349 dex for . Thus, the differences of the two models in the early phases of the Universe are very limited. Table 3 gives the CMB temperatures both in the standard and in the scale invariant case (for ) for some values of . The temperature in the scale invariant model is lower by about 1 K at than in the standard case, corresponding to -0.060 dex. This shows that a relatively high accuracy of the observations is necessary for a significant analysis.
4.3 Comparison of models and observations
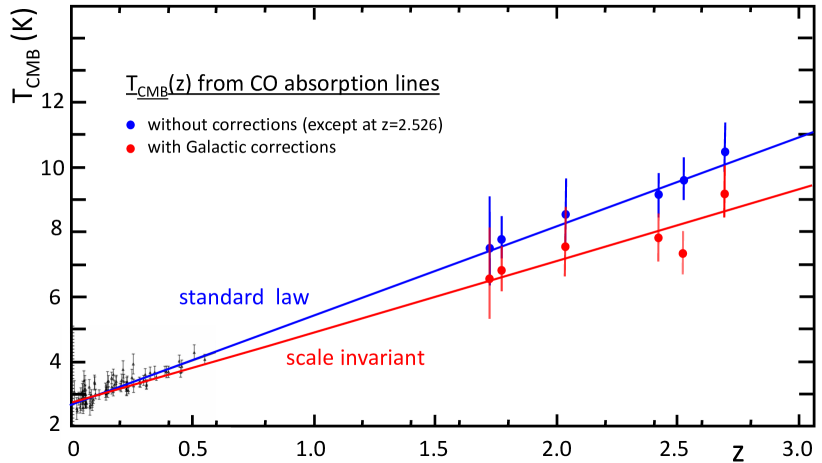
Fig. 5 shows the variations of for both the standard and scale invariant cosmological models as a function of redshift . The theoretical data are compared to the temperatures derived from the CO molecules as given in Table 2. The blue points represent the values of from CO molecular lines in DLA systems as given by the authors (see Table 1). The values were taken identical to , (the point at has been corrected for collisions). These blue points are supporting the standard case. The red points in Fig. 5 give the values of obtained with the Galactic corrections as established in Sect. 2.2, see Table 2. These last results appear to favor the scale invariant cosmological models. However, one must still be careful in the interpretation of the results, in view of the small number of CO observations, which already represent a most remarkable achievement. Coming instrumental developments of high resolution spectrographs will certainly enlarge the sample of these key observations.
5 Conclusions
The corrections to be brought to the of CO molecules seen in absorption on the sight lines of quasars in order to get is a complex problem. Nevertheless, one can safely conclude that the support generally given to the standard model by these CO observations may be questioned. The present results suggest that it is not sufficient to assume that (CO) at the observed redshifts, or to only apply the collisional corrections. The assumption of the scale invariance of the macroscopic empty space is, at least for now, not contradicted by these observations and it deserves further attention.
References
- Bolatto et al. (2013) Bolatto, A.D., Wolfire, M., Leroy, A.K. 2013, ARA&A, 51, 207
- Burgh et al. (2007) Burgh, E.B., France, K., McCandliss, S.R. 2007, ApJ, 658, 446
- Canuto et al. (1977) Canuto, V., Adams, P. J., Hsieh, S.-H., & Tsiang, E. 1977, Phys. Rev. D, 16, 1643
- Carroll et al. (1992) Carroll, S. M., Press, W. H., & Turner, E. L. 1992, ARA&A, 30, 499
- Chluba (2014) Chluba, J. 2014, MNRAS 443, 1881
- Dirac (1973) Dirac, P. A. M. 1973, Proceedings of the Royal Society of London Series A, 333, 403
- Eddington (1923) Eddington, A. S. 1923, The mathematical theory of relativity
- Elitzur (1992a) Elitzur. M. 1992a, ARA&A, 30, 75
- Elitzur (1992b) Elitzur. M. 1992b, Astronomical Masers, Astroph. & Space Sci. Library, Kluwer Acad. Publ., vol 170, 365 p.
- Farooq & Ratra (2013) Farooq, O., Ratra, B. 2013, ApJ, 766, L7
- Feynman (1963) Feynman, R. P. 1963, Feynman lectures on physics - Volume 1
- Fixsen (2009) Fixsen, D.J. 2009, ApJ, 707, 916
- Ge et al. (1997) Ge, J., Bechtold, J., Black, J.H. 1997, ApJ, 474, 67
- Krotkov et al. (1980) Krotkov, R., Wang, D., Scoville, N.Z. 1980, ApJ, 240, 940
- Ledoux et al. (2003) Ledoux, C., Petitjean, P. Srianand, R. 2003, MNRAS, 346, 209
- Lequeux (2005) Lequeux, J. 2005, The Interstellar Medium, Springer Verlag Berlin, 437 p.
- Lima et al. (2000) Lima, J.A.S., Silva, A.I., Viegas, S.M. 2000, MNRAS, 312, 747
- Luzzi et al. (2015) Luzzi, G., Genova-Santos, R.T., Martins, C.J.A.P. et al. 2015, J. Cosmology Astropart. Phys., 09, 011L
- Maeder (2017) Maeder, A. 2017, ApJ, 194, 834
- Molaro et al. (2002) Molaro, P., Levshakov, S.A., Dessauges-Zavadsky, M. et al. 2002, A&A, 381, L64
- Noterdaeme et al. (2010) Noterdaeme, P., Petitjean, P., Ledoux, C. et al. 2010, A& A, 523, A80
- Noterdaeme et al. (2011) Noterdaeme, P., Petitjean, P., Srianand, R. et al. 2011, A& A, 526, L7
- Noterdaeme et al. (2017) Noterdaeme, Krogager, J.-K., Blalashev, S. et al. 2017, A& A, 597, 82
- Peebles (1993) Peebles, P.J.E. 1993, Principles of Physical Cosmology (Princeton Univ. Press, Princeton), 736 p.
- Perlmutter et al. (1999) Perlmutter, S., Aldering, G., Goldhaber, G., et al. 1999, ApJ, 517, 565
- Reimers et al. (2003) Reimers, D., Baade, R., Quast, R., Levshakov, A. 2003, A&A 410, 785
- Riess et al. (1998) Riess, A. G., Filippenko, A. V., Challis, P., et al. 1998, AJ, 116, 1009
- Sobolev et al. (2015) Sobolev, A.I., Ivanchik, A.V., Varshalovich, D.A. and Balashev, S.A. 2015, Journal of Physics: Conf. Series 661, 1
- Srianand et al. (2000) Srianand, R., Petitjean, P., Ledoux, C. 2000, Nature, 408, 931
- Srianand et al. (2005) Srianand, R., Petitjean, P., Ledoux, C. et al. 2005, MNRAS, 362, 549
- Srianand et al. (2008) Srianand, R., Noterdaeme, P., Ledoux, C, Petitjean, P. 2008, A&A, 482, L39
- Wannier et al. (1997) Wannier, P., Penprase, B.E., Andersson, B.-G. 1997, ApJ, 487, L165
- Weyl (1923) Weyl, H. 1923, Raum, Zeit, Materie. Vorlesungen über allgemeine Relativitätstheorie. Re-edited by Springer Verlag, Berlin, 1970
- Wolfire et al. (1995) Wolfire, M.G., Hollenbach, D., McKee, C.F. 1995, ApJ, 443, 152