Breakdown flash at telecom wavelengths in InGaAs avalanche photodiodes
Abstract
Quantum key distribution (QKD) at telecom wavelengths () has the potential for fast deployment due to existing optical fibre infrastructure and mature telecom technologies. At these wavelengths, indium gallium arsenide (InGaAs) avalanche photodiode (APD) based detectors are the preferred choice for photon detection. Similar to their silicon counterparts used at shorter wavelengths, they exhibit fluorescence from recombination of electron-hole pairs generated in the avalanche breakdown process. This fluorescence may open side channels for attacks on QKD systems. Here, we characterize the breakdown fluorescence from two commercial InGaAs single photon counting modules, and find a spectral distribution between and . We also show that by spectral filtering, this side channel can be efficiently suppressed.
I Introduction
Quantum key distribution (QKD) enables two distant parties to share a random encryption key without being eavesdropped by a malicious third party. Since the proposal of BB84 protocol by Bennett and Brassard in 1984 Bennett and Brassard (1984), years of research effort have been committed to building more efficient and robust QKD systems. These systems can be implemented using photons transmitted over free space Buttler et al. (1998); Marcikic et al. (2006); Jouguet et al. (2012) or over optical fibres Townsend (1999); Bourennane et al. (1999); Ribordy et al. (2000).
QKD implementations over optical fibres receive growing interest due to their compatibility with existing telecom fibre networks Hughes et al. (2000), but require detection of single photons at telecom wavelengths (). Avalanche photodiodes (APDs) based on Indium Gallium Arsenide (InGaAs) are the commonly used detectors for this wavelength range Muller et al. (1997); Stucki et al. (2001); Hadfield (2009). Despite their relatively high dark count rate as compared to their silicon counterparts, InGaAs APDs are able to detect single photons at telecom wavelengths with quantum efficiency up to Hadfield (2009); Zhang et al. (2015).
One aspect of APD may provide a susceptibility to the so-called side channel attack in QKD implementations: the emission of fluorescence light during the avalanche breakdown process. This light emission is due to the recombination of electrons and holes in the APD junction, and covers a spectrum ranging from to in silicon based APDs. A similar florescence has also been observed in InGaAs APDs Marini et al. (2016). This fluorescence light (referred to as ’breakdown flash’) reveals information about the photon detection process to an eavesdropper Kurtsiefer et al. (2001). Depending on the detection scheme in a quantum communication setting, the eavesdropper may extract timing and/or polarization information of the detected photons by observing the breakdown flash leaked back to the optical channel. Thus, a strategy must be in place to reduce or eliminate this side channel.
In this work, we investigate the breakdown flash from two commercial InGaAs single-photon counting modules (ID220, ID Quantique). In doing so, we obtain a lower bound for the breakdown flash probability. We also characterize its spectral distribution and find that by spectral filtering, the number of detected breakdown flash events can be greatly suppressed. Under the conservative assumption on a unit detector efficiency, one can place an upper bound to the information leakage due to the breakdown flash in a QKD scenario.
II Detection of breakdown flash
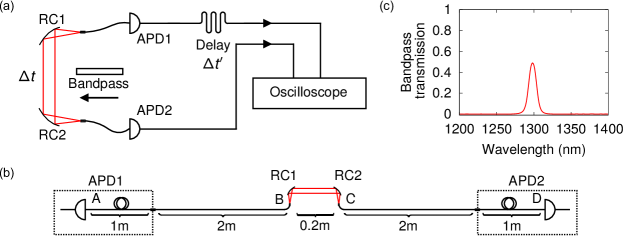
The devices under test are two InGaAs APD based single-photon counting modules, APD1 and APD2 (ID220, ID Quantique, with fibre input). We use the setup shown in Fig. 1 where each counting module acts as both source and detector. To observe the breakdown flash events, the fibre-coupled detectors APD1 and APD2 are optically coupled through free space by a pair of reflective collimators (RC1 and RC2) with an overall transmission of (including fibre losses). The reflective collimators are placed apart and each one is connected to a counting module through of optical fibre ( patchcord + fibre in the detector module).
The output signals from the two APDs are connected to two channels of an oscilloscope (Lecroy Waverunner 640 Zi), which triggers when a signal is received from APD2. Once being triggered, the oscilloscope records the arrival time of a signal from APD1 with respect to the trigger event within the next with a time resolution of . An adjustable electrical delay is applied to APD1 to offset the signal arrival time such that only positive time differences for all interesting events are recorded by the oscilloscope.
The experimental setup is kept in the dark such that the breakdown flash is only caused by dark breakdown events in the APDs. A dark breakdown event is a thermally induced avalanche breakdown in the APD, hence it emits the same breakdown flash light as what would be generated in a photodetection event Shockley and Read (1952). With the setup shown in Fig. 1(a), we observe single detector event rates of for APD1, and for APD2.
When there is a breakdown event in APD2 at , the oscilloscope is triggered. Such an event causes a breakdown flash that arrives at APD1 after a traveling time in the optical path. This generates a signal from APD1 which is delayed by due to the electrical delay connected to APD1. The signal is timestamped by the oscilloscope at , which indicates a breakdown flash emitted from APD2 and detected by APD1. Alternatively, a breakdown event detected in APD1 at causes a breakdown flash that reaches APD2 at and triggers the oscilloscope. The corresponding breakdown signal from APD1 reaches the oscilloscope and is recorded at , indicating a breakdown flash event from APD1 detected by APD2.
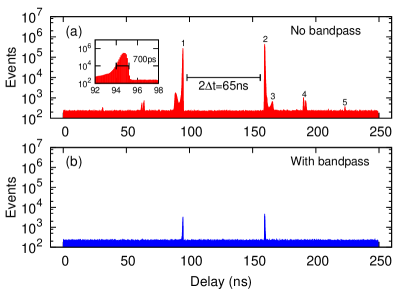
Fig. 2 (a) shows the histogram of the event timings recorded by the oscilloscope over an integration time of . Peak 1 (located at ) and peak 2 (located at ) correspond to breakdown flash events between the two APDs along paths A-B-C-D and D-C-B-A, respectively. Each peak has a full width at half maximum (FWHM) of . The timing separation between the two peaks is , matching twice the optical transit time from A to D.
Peak 3 () is suspected to be afterpulsing signals of APD2 Marini et al. (2016). Peak 4 () actually consists of two small peaks. They are possibly due to the back reflections of photons at the reflective collimators from a secondary breakdown flash in APD1 (triggered by flash photons from APD2), i.e., follow a path D-C-B-A-B/C-A. The timing difference between peak 4 and peak 2 is about , which corresponds to a fibre length of about (from point A to B/C then back to A, Fig. 1 (b)). Peak 5 () is suspected to be a tertiary breakdown from APD2 (triggered by photons from the secondary flash in APD1), as it is about away from peak 2 and the timing difference matches a fibre length of about (from point A to D then back to A, Fig. 1 (b)).
This measurement was repeated with a bandpass filter (transmission profile shown in Fig. 1 (c)) inserted between RC1 and RC2. The events timing histogram is shown in Fig. 2. The two major peaks (peak 1 and peak 2) are suppressed by factor of about 100, while the other small peaks are no longer observable. This indicates that spectral filtering could be used as a countermeasure to effectively reduce the breakdown flash.
The recording of timing histograms with the oscilloscope does not directly permit the determination of absolute detection rates for breakdown flash photons, as the histogram processing disables data taking for an unpredictable time. We therefore employ a different method involving a hardware coincidence stage to determine the absolute probability of detecting a breakdown flash event. (see Fig. 3 (a)). For flash events emitted by APD1 and detected by APD2, the signal from APD1 is electrically delayed by , matching the photon traveling time . Then, an initial breakdown signal from APD1, and the breakdown flash signal from APD2 arrive at the coincidence stage within a coincidence window of . Such a coincidence event indicates a breakdown flash emitted from APD1 detected by APD2, and is recorded by a hardware counter, avoiding the dead time of the oscilloscope in data processing. The number of breakdown flash events emitted by APD2 is measured in the same manner, except that the same electrical delay is applied to signals from APD2.
For each configuration, we continuously record the number of coincidences for . We find a rate of from APD1 to APD2, and from APD2 to APD1. Normalized by the count rate of the emitting APDs, this yields a probability of for APD2 detecting a breakdown flash from APD1, and a probability of in the reverse direction.
In comparison, these probabilities drop to and , respectively, when the bandpass filter is inserted. We estimate the rate of accidental coincidences by blocking the optical path between the APDs, yielding a rate of , with dark count rates of and for APD1 and APD2, respectively. Therefore, applying spectral filtering can effectively suppress the rate of breakdown flash by two orders of magnitude.
III Spectral distribution of breakdown flash

The spectral information available from the bandpass experiment is somewhat limited. We therefore analyze the spectral distribution of the breakdown flash light with the setup shown in Fig. 3 (b). A monochromator consisting of a reflective grating (, blazed at ) and a pair of reflective collimators (RC1 and RC2) is inserted in the optical path between the two APDs. The grating is rotated to select the transmission wavelength between them. To estimate the spectral resolution of the monochromator, we measure the instrument response to a single mode diode laser, and find a full width at half maximum (FWHM) of . For the first-order diffraction of the same light, we observe a transmission of from point A to B in Fig. 3 (b).
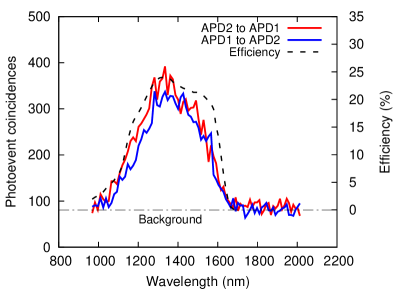
We sampled 84 wavelengths ranging from to with a grating angle incrementation of . We perform same coincidence measurement as with the single bandpass in the optical path, but with an integration time of . The results are shown in Fig. 4. The coincidence events span a wide range from to , with a maximum at about . These results are not corrected for the transmission efficiency of the monochromator, nor the wavelength-dependent detection efficiencies of the two APDs. However, the observed spectra (Fig. 4, left axis) follow closely the spectral dependency of the nominal quantum efficiency dat (right axis). We are not able to detect spectral components outside the 1000 nm-1650 nm band. The close match of spectral sensitivity and observed spectrum of the flash suggests that the spectrum could be relatively flat over the whole region we are able to observe, and could even extend beyond that sensitivity range. A more comprehensive measurement of the actual spectrum would require more wide-band photodetectors. The recent progress with superconducting nanowire detectors Gol’tsman et al. (2001) would make these devices a good choice for such a measurement.
IV Conclusion
Commercial InGaAs single-photon counting modules do show breakdown flash, similar to their silicon counterparts Kurtsiefer et al. (2001). We characterized the breakdown flash from two such devices using a coincidence measurement, and obtain a lower bound for the probability of detecting a breakdown flash of . Given that these APDs have a nominal detection efficiency of about , the breakdown flash could contain at least 0.04 photons emerging from the fiber connector of the devices. This may result in a considerable amount of information leakage that has to be considered in practical QKD implementations.
In some sense, this should not come as a surprise, as light emission for electron-hole recombinations in direct bandgap semiconductors like InGaAs is more likely to happen than in indirect bandgap semiconductors like silicon. However, a direct comparison with photon numbers due to the breakdown flash in different APD types based on our observation is not directly obvious: the overall breakdown flash photon number is likely to be proportional to the charge released in a breakdown, which is significantly smaller in InGaAs APD than in silicon APDs due to the lower excess voltage above breakdown. Another unknown in the experimental observations we have access to is the different coupling efficiencies of the diodes in this experiment (diodes are connected to multi-mode fibers with a small core diameter) and free space diodes used in earlier experiments Kurtsiefer et al. (2001).
The spectral distribution of the breakdown flash appears to be relatively wide. Thus, a spectral filter in front of an APD is a suitable countermeasure to prevent potential information leakage through the breakdown flash in a quantum key distribution scenario. In that narrow spectral window, the detection efficiency can be assumed to be constant. With a conservative estimation of the detector efficiency, the observed detected breakdown flash probability can then be used to provide an upper bound for estimating the number of photons being transmitted to the optical channel due the breakdown flash.
Acknowledgements
This research is supported by the Ministry of Education, Singapore, and the National Research Foundation, Prime Minister’s Office, Singapore, partly under its Corporate Laboratory@University Scheme, National University of Singapore, and Singapore Telecommunications Ltd.
References
- Bennett and Brassard (1984) C. H. Bennett and G. Brassard, in International Conference on Computers, Systems & Signal Processing, Bangalore, India, Dec 9-12, 1984 (1984) pp. 175–179.
- Buttler et al. (1998) W. T. Buttler, R. J. Hughes, P. G. Kwiat, S. K. Lamoreaux, G. G. Luther, G. L. Morgan, J. E. Nordholt, C. G. Peterson, and C. M. Simmons, Phys. Rev. Lett. 81, 3283 (1998).
- Marcikic et al. (2006) I. Marcikic, A. Lamas-Linares, and C. Kurtsiefer, Appl. Phys. Lett. 89, 101122 (2006) .
- Jouguet et al. (2012) P. Jouguet, S. Kunz-Jacques, A. Leverrier, P. Grangier, and E. Diamanti, Nature Photonics 7, 378 (2012) .
- Townsend (1999) P. D. Townsend, in OFC/IOOC . Technical Digest. Optical Fiber Communication Conference, 1999, and the International Conference on Integrated Optics and Optical Fiber Communication, Vol. 4 (1999) pp. 141–143.
- Bourennane et al. (1999) M. Bourennane, F. Gibson, A. Karlsson, A. Hening, P. Jonsson, T. Tsegaye, D. Ljunggren, and E. Sundberg, Opt. Express 4, 383 (1999).
- Ribordy et al. (2000) G. Ribordy, J. D. Gautier, N. Gisin, O. Guinnard, and H. Zbinden, Journal of Modern Optics 47, 517 (2000).
- Hughes et al. (2000) R. J. Hughes, G. L. Morgan, and C. G. Peterson, Journal of Modern Optics 47, 533 (2000) .
- Muller et al. (1997) A. Muller, T. Herzog, B. Huttner, W. Tittel, H. Zbinden, and N. Gisin, Applied Physics Letters 70, 793 (1997).
- Stucki et al. (2001) D. Stucki, G. Ribordy, A. Stefanov, H. Zbinden, J. G. Rarity, and T. Wall, Journal of Modern Optics 48, 1967 (2001) .
- Hadfield (2009) R. Hadfield, Nature Photonics 3, 696 (2009).
- Zhang et al. (2015) J. Zhang, M. A. Itzler, H. Zbinden, and J.-W. Pan, Light: Science & Applications 4, e286 (2015) .
- Marini et al. (2016) L. Marini, R. Camphausen, C. Xiong, B. Eggleton, and S. Palomba, Photonics and Fiber Technology 2016 (ACOFT, BGPP, NP) (2016).
- Kurtsiefer et al. (2001) C. Kurtsiefer, P. Zarda, S. Mayer, and H. Weinfurter, Journal of Modern Optics 48, 2039 (2001).
- Shockley and Read (1952) W. Shockley and W. T. Read, Phys. Rev. 87, 835 (1952).
- (16) Data sheet for ID220 Infrared Single-Photon Detector, ID Quantique.
- Gol’tsman et al. (2001) G. N. Gol’tsman, O. Okunev, G. Chulkova, A. Lipatov, A. Semenov, K. Smirnov, B. Voronov, A. Dzardanov, C. Williams, and R. Sobolewski, Applied Physics Letters 79, 705 (2001) .