The evolution of Galactic planetary nebula progenitors through the comparison of their nebular abundances with AGB yields.
Abstract
We study the chemical abundances of a wide sample of 142 Galactic planetary nebulae (PNe) with good quality observations, for which the abundances have been derived more or less homogeneously, thus allowing a reasonable comparison with stellar models. The goal is the determination of mass, chemical composition and formation epoch of their progenitors, through comparison of the data with results from AGB evolution. The dust properties of PNe, when available, were also used to further support our interpretation.
We find that the majority () of the Galactic PNe studied has nearly solar chemical composition, while of the sources investigated have sub-solar metallicities. About half of the PNe have carbon star progenitors, in the mass range, which have formed between 300 Myr and 2 Gyr ago. The remaining PNe are almost equally distributed among PNe enriched in nitrogen, which we interpret as the progeny of stars, younger than 250 Myr, and a group of oxygen-rich PNe, descending from old ( Gyr) low-mass () stars that never became C-stars.
This analysis confirms the existence of an upper limit to the amount of carbon which can be accumulated at the surface of carbon stars, probably due to the acceleration of mass loss in the late AGB phases. The chemical composition of the present sample suggests that in massive AGB stars of solar (or slightly sub-solar) metallicity, the effects of third dredge up combine with hot bottom burning, resulting in nitrogen-rich - but not severely carbon depleted - gaseous material to be ejected.
keywords:
Planetary Nebulae: individual – Stars: abundances – Stars: AGB and post-AGB. Stars: carbon140.252.118.146
1 Introduction
The stars of mass below , after the end of core helium burning, enter the AGB phase, during which a CNO burning shell provides the thermonuclear energy supply almost entirely. Periodically, a helium-rich layer above the degenerate core is ignited in conditions of thermal instability, hence the name ”thermal pulse” (hereinafter TP), used to define these episodes.
Despite relatively short in comparison with the core hydrogen and helium burning phases, the AGB evolution proves extremely important to understand the feedback of these stars on their host system, because it is during this phase that most of the mass loss occurs, with the consequent pollution of gas and dust of the interstellar medium.
A full comprehension of the AGB evolution proves crucial for a number of astrophysical contexts, such as the determination of the masses of galaxies at high redshifts (Maraston et al., 2006), the formation and chemical evolution of galaxies (Romano et al., 2010; Santini et al., 2014), the dust content of high-redshift quasars (Valiante et al., 2011), and the formation of multiple populations of stars in globular clusters (Ventura et al., 2001).
The modelling of the AGB phase has made significant progresses in the recent years, with the description of the dust formation process in the winds, coupled to the evolution of the central star (Ferrarotti & Gail, 2006; Nanni et al., 2013, 2014; Ventura et al., 2012a, b; Di Criscienzo et al., 2013; Ventura et al., 2014a).
The results are still rather uncertain though, because of the poor knowledge of convection and mass loss, two physical mechanisms having a strong impact on the physical and chemical features of the AGB evolution (Karakas & Lattanzio, 2014; Ventura & D’Antona, 2005). Therefore, the comparison with the observations is extremely important to allow a qualitative step towards an exhaustive knowledge of the main properties of these stars.
The Magellanic Clouds (MC) have been so far the most investigated environments to this aim, owing to their relatively short distances (51 kpc and 61 kpc respectively, for the Large and Small Magellanic Cloud, Cioni et al. 2000; Keller & Wood 2006) and the low reddening ( mag and 0.04 mag, respectively, for the LMC and SMC, Westerlund 1997). The near- and mid-infrared observations of stars in the MC, particularly suitable to study AGB stars, given the cool (below K) surface temperatures of these objects, have been extensively used to constrain the AGB models (Izzard et al., 2004; Girardi & Marigo, 2007; Groenewegen et al., 2007; Riebel et al., 2010, 2012; Srinivasan et al., 2009, 2011; Boyer et al., 2011, 2012). These studies have been completed by more recent investigations, focused on dust production expected from this class of stars, and the relative effects on the infrared colours, (Dell’Agli et al., 2014, 2015a, 2015b; Ventura et al., 2015a, 2016a; Nanni et al., 2016).
A complementary approach to infer valuable information on the evolution of AGB stars is offered by the study of PNe. The chemical composition of these objects reflects the final surface chemistry, at the end of the AGB phase, and is determined by the combination of the two mechanisms potentially able to change their surface chemistry, namely third dredge up (TDU) and hot bottom burning (HBB). The determination of the abundances of the individual species in the PN winds provides a unique tool to understand the efficiency of the two mechanisms.
Motivated by these arguments, we have recently started a research project aimed at interpreting the observed sample of PNe based on recent AGB models, accounting for the formation of dust in the circumstellar envelope. In the first two papers of this series we focused on the PNe population of the LMC (Ventura et al. 2015b, hereinafter paper I) and of the SMC (Ventura et al. 2016b, paper II). These works allowed the characterization of the observed PNe in terms of the mass and metallicity of the progenitors.
Here we extend this study to the population of Galactic PNe, whose -element abundances indicate a wider range of progenitor metallicities. Our aim is twofold: a) we attempt to characterize the individual PNe observed and to identify the progenitors; b) we test AGB evolution and the dust formation process against a different and more complex environment than that of Magellanic Cloud PNe.
The paper is organised as follows: section 2 provides a description of the most important physical and chemical input used to model the AGB phase; in section 3 we discuss the modification of the surface chemical composition of AGB stars, and the expected, final abundances of the various chemical species; the interpretation of the two samples of Galactic PNe studied in the present work is addressed in section 4; in section 5 we discuss the results obtained on the basis of the dust features detected in the spectra of some of the PNe observed;the conclusions are given in section 6.
2 AGB modelling
Our aim is to interpret the abundances of specific Galactic PN samples on the basis of AGB models of different mass and chemical composition. Our goal is to deduce the mass and the metallicity of the progenitor of the individual PNe observed, by comparing the abundances of the various chemical species at the end of the AGB phase with the values derived from the observations. Before entering this detailed comparison, we provide a brief description of the AGB models adopted.
The evolutionary sequences have been calculated by the ATON code for stellar evolution. The details of the numerical structure of the code are extensively discussed in Ventura et al. (1998), whereas the most recent updates are presented in Ventura & D’Antona (2009). Here we provide a short description of the physical and chemical input most relevant to this work.
2.1 Convection
The temperature gradient within regions unstable to convective motions is found by the full spectrum of turbulence (FST) model for convection (Canuto & Mazzitelli, 1991). Mixing of chemicals and nuclear burning are treated simultaneously, by means of a diffusive-like approach. During the two major core burning phases we assume that convective velocities decay exponentially from the border of the core within radiatively stable regions, with an e-folding distance of ; this choice is motivated by a calibration of core overshooting based on the observed extension of the main sequences of open clusters, given in Ventura et al. (1998). During the AGB phase we assume overshoot from the base of the envelope and from the borders of the convective shell which forms at the ignition of each TP; in this case the e-folding distance of convective velocities is , according to a calibration based on the luminosity function of carbon stars in the LMC, given in Ventura et al. (2014a).
2.2 Mass loss
We adopt the formalism by Blöcker (1995) to describe mass loss of oxygen-rich AGB stars. Blocker’s formula consists in the canonical Reimers’ mass loss rate multiplied by a power of the luminosity, . The free parameter entering the Reimers’ rate was set to , following the study on the luminosity function of lithium-rich stars in the MC, by Ventura et al. (2000).
2.3 Opacities
Radiative opacities are calculated according to the OPAL release, in the version documented by Iglesias & Rogers (2006). The molecular opacities in the low-temperature regime ( K) are calculated by means of the AESOPUS tool (Marigo & Aringer, 2009). The opacities are constructed to follow the changes of the envelope chemical composition, in particular carbon, nitrogen and oxygen individual abundances.
2.4 Chemical composition
The AGB models used here have metallicities , , , . In the models we assume the mixture by Grevesse & Sauval (1998), with an enhancement ; the models were calculated with the Grevesse & Sauval (1998) mixture and an enhancement ; the models are based on the solar-scaled mixture by Lodders (2003); finally, the and models have a solar-scaled mixture, with the distribution by Grevesse & Sauval (1998). The initial abundances of the chemical species mostly used in the present work for the various metallicities is reported in Table 1.
| Z | (He/H) | (C/H) | (N/H) | (O/H) | (Ne/H) | |||
|---|---|---|---|---|---|---|---|---|
| 10.92 | 6.975 | 6.376 | 7.685 | 6.932 | 1-7.5 | 3 | 1.25 | |
| 10.92 | 7.276 | 6.677 | 7.986 | 7.233 | 1-7.5 | 3 | 1.25 | |
| 10.95 | 7.746 | 7.147 | 8.266 | 7.502 | 1-8 | 3.5 | 1.25 | |
| 10.95 | 8.05 | 7.45 | 8.56 | 7.806 | 1-8 | 3.5 | 1.25 | |
| 10.97 | 8.432 | 7.871 | 8.731 | 7.915 | 1-8 | 3.5 | 1.5 | |
| 11.00 | 8.568 | 7.965 | 8.875 | 8.129 | 1-8 | 3.5 | 1.5 | |
| 11.06 | 8.941 | 8.339 | 9.249 | 8.503 | 1-8 | 4 | - |
2.5 Dust formation
Dust formation in the winds of AGB stars is described according to the schematization introduced by Ferrarotti & Gail (2006). The wind is assumed to expand isotropically under the effects of radiation pressure, acting on dust grains, partly counterbalanced by gravity. The dynamics of the wind is described by means of the momentum conservation equation and by mass conservation, giving the radial stratification of density as a function of the gas velocity and of the rate of mass loss.
The effects of the radiation pressure is calculated by means of the opacity coefficient, which, in turn, depends on the number and the size of the dust particles formed. The growth rate of the dust particles of a given species are found via the difference between the growth and the vaporisation terms.
All the relevant equations, with an exhaustive discussion on the role played by various physical factors, are given in Ferrarotti & Gail (2006).
The dust species considered depend on whether the surface of the star is oxygen-rich or carbon rich: in the former case we consider the formation of silicates and of alumina dust, whereas for carbon stars we model the formation and growth of silicon carbide and of solid carbon grains (Ventura et al., 2012a, b).
3 Changes in the surface chemistry of AGB stars
The AGB models used in the present analysis were introduced and discussed in previous papers by our group. We address the interested reader to Ventura et al. (2014b) (), Ventura et al. (2013) (, initial mass above ), Ventura et al. (2014a) (low–mass models of metallicity and initial mass below ), paper II () and Di Criscienzo et al. (2016) (). To complete the array of comparison models we also introduce here a series of updated, unpublished models with solar metallicity and with .
3.1 Low mass domain: the formation of carbon stars
The surface chemistry of stars of mass below is altered only by the first dredge up (FDU) and by a series of TDU events, which may eventually turn the star into a carbon star. The number of TDU experienced is higher the larger is the initial mass, as more massive objects start the AGB phase with a more massive envelope: this is the reason why only stars with initial mass above a threshold value will eventually become carbon stars. The minimum mass required to become carbon star, shown in Table 1 (col. 9) depends on the metallicity: the higher is Z, the more difficult is to achieve C/O ratios above unity, owing to the larger quantity of oxygen in the star. For sub-solar metallicities, the lowest mass becoming carbon star is ; in the solar case this lower limit is , whereas no carbon stars are expected to form for . The upper limit in mass for carbon stars coincides with the minimum mass required to ignite HBB; the latter process prevents the achievement of the C-star stage, via destruction of the surface carbon.
The chemical composition of carbon stars will be enriched in nitrogen, as a consequence of the FDU. An increase in the surface oxygen, significantly smaller in comparison to carbon, is also expected, particularly in low-metallicity stars.
3.2 Hot bottom burning and helium enrichment in massive AGB stars
Stars with with initial mass above a given threshold experience HBB during the AGB phase. The minimum mass required for the ignition of HBB depends on the metallicity. Table 1 (col. 8) reports the values corresponding to the different metallicities.
The ignition of HBB strongly affects the AGB evolution, because the proton-capture nucleosynthesis activated at the base of the convective envelope significantly changes the surface chemical abundances of these stars. Among all, it provokes the destruction of the surface carbon and the production of great quantities of nitrogen. While this is a common property of all models, the destruction of the surface oxygen, which requires higher HBB temperatures ( MK), is sensitive to the metallicity, and is higher the lower is (Ventura et al., 2013). The destruction of oxygen is extremely sensitive to the modelling of convection: in the present analysis, based on the FST description, we find significant depletion of oxygen in metal poor AGB stars; conversely, when a less efficient convective model is used, the HBB experienced is weaker, thus limiting the efficiency of oxygen burning (Ventura & D’Antona, 2005; Di Criscienzo et al., 2016). In this context, the detection of oxygen-poor PNe, enriched in nitrogen, would be an important evidence in favour of a very efficient convective transport of energy in the internal regions of the envelope of AGB stars.
The stars experiencing HBB are also exposed to the second dregde-up (SDU), after the consumption of the helium in the core. The main effect of the SDU is the increase in the surface helium (), which is sensitive to the initial mass of the star: typically, is negligible in stars with mass close to the minimum threshold required to start HBB, and increases with the initial mass, up to for . This result is much more robust than the predictions concerning the depletion of oxygen, because the SDU takes place before the TP phase, thus the results are unaffected by most of the uncertainties affecting AGB modelling.
3.3 Surface chemistry at the end of AGB evolution
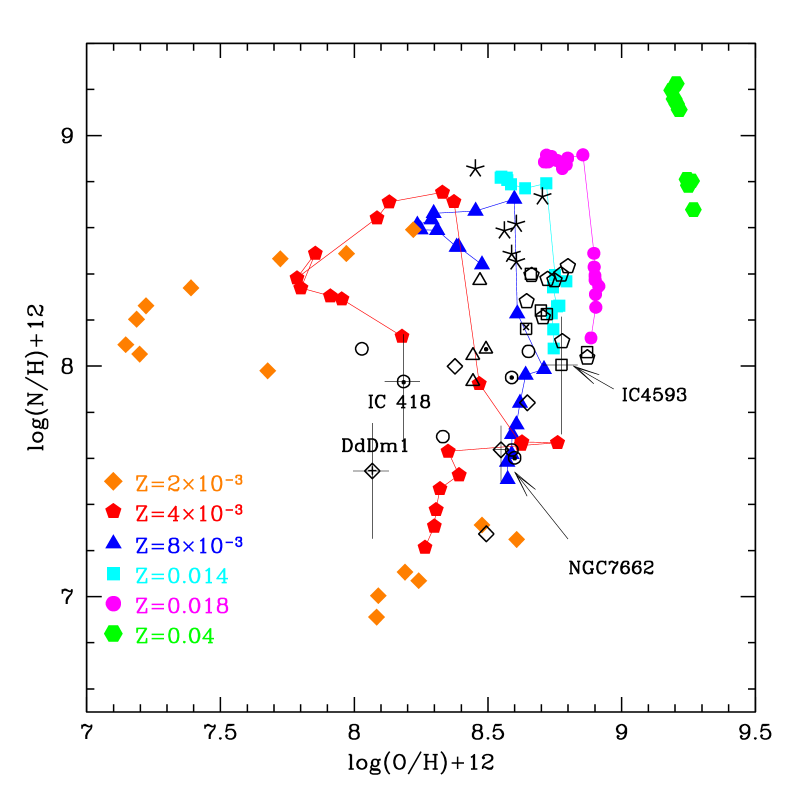
The final chemical composition of the models used here, which will be used to interpret the PN abundances, are shown in Fig. 1, in the CN (left) and ON (right) planes. The distribution of the mass fractions of the individual species at the end of the AGB evolution models in these planes allows us to understand the role played by mass and metallicity on the evolution of the chemistry of the surface layers in AGB stars. For all the metallicities investigated, the lines connecting models of different mass define a typical counterclockwise shape, moving from the lowest () to the highest mass stars considered. As shown in the left panel of Fig. 1, the range of carbon abundances spanned by the models extends over two order of magnitudes, independently of the metallicity. Conversely (see right panel of Fig. 1), the distribution of the oxygen abundances is much more sensitive to metallicity: models exhibit a negligible variation in oxygen, whereas in the case we find an overall variation of a factor . This behaviour is due to the larger sensitivity of C to HBB and TDU, compared to O. TDU favours a significant increase in the surface C, whereas the effects on O are much smaller. The activation of HBB provokes the destruction of the surface C, independently of Z, whereas the destruction of the surface oxygen via HBB is limited to the stars with the lowest metallicity.
The lowest masses considered never become carbon stars, because they loose the external mantle before the surface carbon exceeds the oxygen content. Compared to the initial chemical composition, with which they formed, their chemistry is enriched in nitrogen, as a consequence of the FDU. For carbon the situation is more tricky. If no TDU occurred, the final carbon is smaller than the initial quantity, because during the FDU the surface convection reached regions where carbon was consumed by CN nucleosynthesis; however, if some TDU events take place, the situation is reversed, and the final carbon is above the starting abundance. We remark here that for these stars, owing to the null effects of HBB and the small effects of TDU, the final chemical composition is extremely dependent on the assumptions regarding the chemical mixture of the gas from which the stars formed.
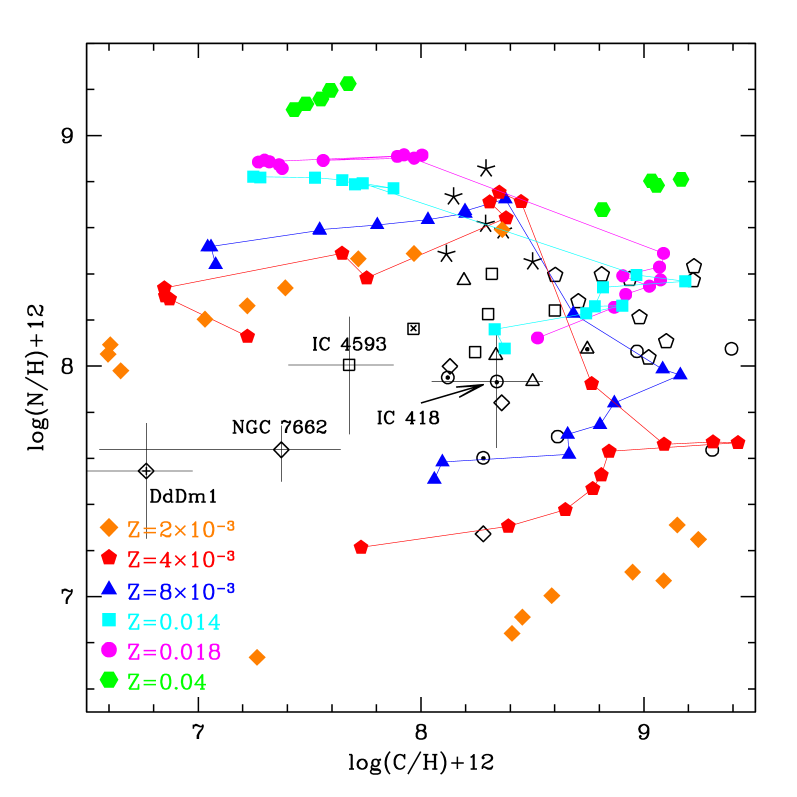
As more massive objects, up to , are considered, the theoretical sequences move to the right on the CN plane, owing to the increase in the surface carbon, as a consequence of repeated TDU events. On the contrary, nitrogen keeps approximately constant in this range of mass. The final carbon, could be potentially used as a mass indicator for stars, because stars of higher mass reach higher carbon abundances in the final AGB phases.
A word of caution on the predictions regarding the evolution of the surface nitrogen of stars is needed here. In the present models, when modelling the red giant branch (RGB) phase, neither thermohaline nor any sort of extra-mixing was considered; this is going to underestimate the N increase, which occurs during the ascending of the RGB (Charbonnel & Lagarde, 2010). Therefore, the N abundances of the models of initial mass below are to be considered as lower limits, with an overall uncertainty of dex.
Regarding the possibility of using the abundances of some chemical elements to infer the metallicity of the progenitors of the PNe, it is evident from the models locii of Fig. 1 (left panel), that carbon should not be used to infer metallicity of the PN progenitors, since the abundance of this element is determined by the number of TDU events experienced by the star, which is scarcely related to metallicity. PN oxygen abundances, on the other hand, can be used as probes of the progenitor’s metallicity, at least in the higher metallicity domain. In fact, in the right panel of Fig. 1, we observe a tight correlation between metallicity and oxygen abundances, for . For lower metallicities, we should also consider: a) for massive progenitors, HBB in low-Z AGB stars favours a significant decrease in the surface O, which breaks out any O-Z relationship; b) in low-mass progenitors the surface oxygen increases under the effects of TDU (see the line in the figure).
García-Hernández et al. (2016a) interpreted oxygen enhancement observed in low-metallicity Galactic PNe based on these same modelling feature.
The nitrogen abundance is also correlated to metallicity in the low-mass domain; however, the afore mentioned uncertainties affecting the extent of the nitrogen increase during the RGB phase prevents the use of the measured N as a robust metallicity indicator.
Stars with mass above the minimum threshold required to activate HBB, , show the imprinting of CN or, in some cases, CNO nucleosynthesis, in their surface chemical composition. A robust prediction in this case is the significant increase in the nitrogen content, which at the end of the AGB phase is a factor of higher than the N initially present in the star. The final carbon of these stars is more uncertain, as it is sensitive to the relative importance of HBB and TDU. In an HBB-dominated environment the final C will be almost a factor smaller than the initial value; however, a few TDU events, in the very final AGB phases, after HBB was turned off, might partly counterbalance the effects of the proton-capture nucleosynthesis; this argument is still debated. According to the models used here, shown in the left panel of Fig. 1, we find that stars of initial mass evolve to final phases characterised by a great increase in N and a carbon content similar to the matter from which they formed; this is because in these stars a few final TDU episodes make the surface carbon, previously destroyed by HBB, to rise again; conversely, stars reach the final evolutionary stages with a surface carbon reduced by almost an order of magnitude in comparison with the initial chemistry. The effect of metallicity in this region of the CN plane is that higher Z stars evolve to higher N: this is because the equilibrium abundance of N in a region where CNO nucleosynthesis is active is proportional to the overall C+N+O content.
Concerning oxygen, the results are metallicity-dependent: as shown in the right panel of Fig. 1, the extent of the depletion of oxygen in massive AGB stars is negligible in solar chemistry models, whereas it amounts to almost a factor 10 in the case.
4 Comparison of the observed PN abundances with the AGB final yields
Our aim is to study a large sample of Galactic PNe, for which the chemical abundances were derived homogeneously, in the framework of AGB evolution.
To trace AGB evolution and especially the HBB and TDU phenomena, the most important abundances are those of carbon, oxygen, and nitrogen. Dust properties of the PNe add another handle to determine carbon enrichment (see Stanghellini et al. 2012) even in the cases where carbon abundances are not available.
Stanghellini et al. (2007) found clear correlations between gas and dust composition for a sample of PNe in the LMC. PNe with carbon-rich dust (CRD) features were found to have typically carbon-rich gas as well (i.e. ), while PNe with oxygen-rich dust (ORD) features had . The same analysis could not be done for Galactic PNe (Stanghellini et al. 2012) for the unavailability of dust and gas chemistry in the same sample of Galactic PNe.
It is worth recalling here that oxygen and nitrogen abundances in Galactic PNe are within easy reach from optical spectra. On the other hand, carbon abundances, and information on the nature of the nebular dust, are observationally harder to determine. Carbon in PNe can be measured via collissionally-excited emission lines (CELs), the majority of which are emitted in the UV regime, with C II] at 2626-28 Å, and C III] at 1907-09 Å. These two intensities are usually sufficient for a complete carbon determination for low and intermediate excitation PNe. For high excitation PNe, the UV recombination line C IV 1548-50 Å is also used.
An additional possibility is to estimate the C/O ratio from optical recombination lines (ORLs), which are much easier to acquire. There are several C/O estimates in the literature from OLRs analysis, both from the assumption that C2+/O C/O, and from ICF evaluation (see for a discussion Delgado-Inglada & Rodríguez 2014). However, we prefer to avoid carbon estimates from ORLs in this study, to avoid mixing determinations from CELs and RLs.
The dust content of PNe has been studied in recent years with the advent of the Spitzer Space Telescope. IRS/Spitzer spectra have been exploited to determine whether PNe have carbon or oxygen rich dust, or a mixture of both (see Stanghellini et al. 2012; García-Hernández & Górny 2014). The PNe whose dust content has been classified into carbon-rich and oxygen-rich classes to date do not overlap with those with a CELs carbon determination. For this reason, we decided to select two PN samples for the AGB model comparison: the first (Sample 1) is driven by the availability of carbon abundances determined from CELs in the literature; the second (Sample 2) is driven by being classified based on their dust contents based on IRS/Spitzer data.
4.1 Sample 1 PNe
Sample 1 PNe are Galactic PNe whose carbon, oxygen, and nitrogen abundances are available in the literature to date, with carbon abundances determined from UV emission lines. Before the HST had became available, UV spectra of Galactic PNe have been acquired with the IUE satellite. Data have been accumulated in the decades, and two main groups have revisited the IUE spectra and derived carbon abundances of Galactic PNe. Kingsburg and Barlow (1994), and Henry et al. (2000) published carbon abundances, with one target in common. We also searched the literature for Galactic PNe whose spectra has been acquired with the HST. Henry et al. (2015) and Dufour et al. (2015) examined 7 carbon determinations in Galactic PNe (4 in common with the IUE samples described above). Furthermore, Henry et al. (2008) observed the halo PN DdDm 1 (PN G061.9+41.3), and Bianchi et al. (2001) observed a globular cluster PN (K648 in M15).
In summary, reliable carbon abundances are available for 40 Galactic PNe from UV data, 7 of which are from HST spectra. For all these PNe, the original papers also gave abundances of He, N, O, Ne. We list Sample 1 PNe in Table 2, where we give their PN G numbers (column 1), their usual names (column 2), their dust and morphological types (columns 3 and 4, see table note for description of the keys), and their C, N, and O abundances in the usual scale of log(X/H)+12 (columns 5 through 7). The asymmetric log uncertainties have been calculated from the uncertainties in the original references, when given. The references for the abundances are given in column 8.
It is worth noting that all abundance references use the same ICF scheme (Kingsburgh & Barlow 1994), and are thus homogeneous, with the exception of the 7 PNe whose abundances are from Dufour et al. (2015). We comment on possible use of the model abundances from Henry et al. (2015), based on Dufour et al.’ s (2015) data, in specific cases in the following sections. It is important to note that we have checked all PNe in this sample for possibly being located in the bulge or halo of the Galaxy, according to the definition which is commonly adopted (see Stanghellini & Haywood 2010). We found none of the Sample 1 PNe to belong to the bulge, while H 4-1 (PN G049.3+88.1), BoBn 1 (PN G108.4-76.1), DdDm 1 (PN G061.9+41.3), and Me 2-1 (PN G342.1+27.5) may belong to the Galactic halo.
| PN G | Name | Dust | Morph. | log(C/H)+12 | log(N/H)+12 | log(O/H)+12 | Ref. |
|---|---|---|---|---|---|---|---|
| (1) | (2) | (3) | (4) | (5) | (6) | (7) | (8) |
| 025.3+40.8 | IC 4593 | 2 | 7.678 | 8.005 | 8.775 | 1 | |
| 036.1–57.1 | NGC 7293 | 2 | 8.602 | 8.395 | 8.663 | 1 | |
| 037.7–34.5 | NGC 7009 | 4 | 8.318 | 8.400 | 8.661 | 2 | |
| 043.1+37.7 | NGC 6210 | 4 | 3 | 7.966 | 8.162 | 8.643 | 1 |
| 049.3+88.1 | H 4-1 | 8.613 | 7.694 | 8.332 | 1 | ||
| 051.4+09.6 | Hu 2-1 | 3 | 4 | 8.746 | 8.073 | 8.493 | 1 |
| 061.4–09.5 | NGC 6905 | 2 | 8.243 | 8.061 | 8.871 | 2 | |
| 061.9+41.3 | DdDm 1 | 5 | 6.767 | 7.545 | 8.068 | 1 | |
| 063.1+13.9 | NGC 6720 | 2 | 8.811 | 8.397 | 8.774 | 1 | |
| 083.5+12.7 | NGC 6826 | 2 | 2 | 8.120 | 7.951 | 8.589 | 1 |
| 084.9–03.4 | NGC 7027 | 4 | 8.980 | 8.211 | 8.706 | 1 | |
| 106.5–17.6 | NGC 7662 | 2 | 7.373 | 7.637 | 8.549 | 3 | |
| 108.4–76.1 | BoBn 1 | 9.393 | 8.075 | 8.029 | 1 | ||
| 123.6+34.5 | IC 3568 | 1 | 8.193 | 8.372 | 8.470 | 3 | |
| 130.9–10.5 | NGC 650 | 4 | 9.220 | 8.372 | 8.749 | 1 | |
| 161.2–14.8 | IC 2003 | 3 | 8.969 | 8.064 | 8.652 | 2 | |
| 189.1+19.8 | NGC 2372 | 4 | 8.301 | 8.225 | 8.720 | 2 | |
| 194.2+02.5 | J 900 | 3 | 9.307 | 7.636 | 8.590 | 2 | |
| 197.8+17.3 | NGC 2392 | 2 | 8.336 | 8.046 | 8.444 | 1 | |
| 206.4–40.5 | NGC 1535 | 2 | 8.279 | 7.272 | 8.494 | 1 | |
| 215.2–24.2 | IC 418 | 3 | 2 | 8.340 | 7.933 | 8.185 | 1 |
| 221.3–12.3 | IC 2165 | 2 | 8.501 | 7.933 | 8.444 | 3 | |
| 231.8+04.1 | NGC 2438 | 2 | 8.130 | 7.999 | 8.377 | 2 | |
| 234.8+02.4 | NGC 2440 | 4 | 8.290 | 8.616 | 8.606 | 3 | |
| 243.3–01.0 | NGC 2452 | 2 | 8.501 | 8.453 | 8.606 | 2 | |
| 261.0+32.0 | NGC 3242 | 2 | 2 | 8.279 | 7.602 | 8.600 | 3 |
| 265.7+04.1 | NGC 2792 | 2 | 8.924 | 8.759 | 2 | ||
| 278.1–05.9 | NGC 2867 | 2 | 9.100 | 8.107 | 8.778 | 2 | |
| 278.8+04.9 | PB 6 | 9.225 | 8.432 | 8.799 | 1 | ||
| 285.7–14.9 | IC 2448 | 2 | 8.936 | 8.378 | 8.723 | 2 | |
| 296.6–20.0 | NGC 3195 | 3 | 8.600 | 8.241 | 8.698 | 2 | |
| 307.2–03.4 | NGC 5189 | 4 | 8.114 | 8.486 | 8.589 | 2 | |
| 309.1–04.3 | NGC 5315 | 4 | 8.369 | 8.587 | 8.562 | 3 | |
| 312.3+10.5 | NGC 5307 | 3 | 8.210 | 8.629 | 2 | ||
| 315.0–00.3 | He 2-111 | 4 | 8.292 | 8.856 | 8.453 | 2 | |
| 320.3–28.8 | He 2-434 | 3 | 8.362 | 7.841 | 8.648 | 2 | |
| 320.3–28.8 | NGC 5979 | 2 | 8.706 | 8.281 | 8.752 | 2 | |
| 327.8+10.0 | NGC 5882 | 2 | 7.895 | 7.760 | 8.645 | 3 | |
| 341.8+05.4 | NGC 6153 | 2 | 8.146 | 8.735 | 8.704 | 2 | |
| 342.1+27.5 | Me 2-1 | 2 | 9.021 | 8.037 | 8.872 | 2 |
Dust type is either featureless (F, 0); carbon rich dust (CRD) aromatic (1); CRD aliphatic (2); CRD both aromatic and aliphatic (3); oxygen rich dust (ORD) crystalline (4); ORD amorphous (5); ORD both crystalline and amorphous (6); mixed chemistry dust (MCD, 7). Morphology is Round (1); Elliptical (2) Bipolar Core (3); Bipolar (4); Point-symmetric (5). Elemental abundance references are from a series of papers summarized in Henry et al. (2000, 1); from Kingsburg & Barlow (1994, 2); from Dufour et al. (2015, 3).
4.1.1 The origin of the Sample 1 PNe
We can take full advantage of the availability of gaseous carbon abundances in sample 1 PNe to interpret them by comparison with the AGB yields. Combined with the measurements of nitrogen and oxygen, this allows the knowledge of the overall CNO chemistry, which can be used to infer the progenitors of the individual sources in the sample. We therefore followed an approach similar to paper I and paper II
Fig. 1 shows the Sample 1 PN chemical abundances in the CN (left panel) and ON (right panel) planes. Superimposed to the data we show the final yields of AGB models of various mass and metallicity, discussed in the previous section. The symbols used to indicate the PNe reflect our understanding of the mass and chemical composition of the progenitors. We reiterate here that for those cases when the N and O abundances observed provided different directions for interpretation, we relied on the O determinations, because of the on-the-average smaller errors associated to the measurements of oxygen compared to nitrogen, and for the uncertainty affecting the predictions of the variation of the surface nitrogen in low-mass AGB stars, owing to the still debated effects of extra-mixing during the RGB ascending.
Approximately of Sample 1 PNe descend from solar metallicity stars, whereas have a slightly sub-solar chemistry, with metallicity .
About half of Sample 1 PNe descend from carbon stars. Their surface chemical composition was modified mainly by TDU, with no effects of HBB. These sources are indicated in Fig. 1 with open pentagons (solar metallicity) and circles (sub-solar chemistry). The progenitors of this group of PNe, characterised by masses in the range , formed between 2 Gyr and 500 Myr ago. According to our interpretation, the PNe belonging to this group with the largest carbon abundance are younger and descend from higher mass progenitors. In this sub-sample we find NGC 3242 (PN G261.0+32.0), NGC 6826 (PN G083.5+12.7), and IC 418 (PN G215.2-24.2), whose IR spectra, analysed by Delgado-Inglada et al. (2015), exhibit traces of carbon dust, consistently with the interpretation given in García-Hernández et al. (2016a) and confirmed in the present study.
of the PNe in this sample descend from low-mass progenitors, with mass in the range, that never reached the C-star stage. These stars, indicated with open squares (solar chemistry) and diamonds (sub-solar metallicity) in Fig. 1, are the oldest PNe, formed between 10 Gyr and 2 Gyr ago. This group of PNe includes NGC 6210 (PN G043.1+37.7), also present in the sample studied by Delgado-Inglada et al. (2015), and interpreted by García-Hernández et al. (2016b) as the progeny of a low-mass progenitor.
This sample also include a group of objects that experienced HBB. These PNe are indicated as asterisks and open triangles in Fig. 1, according to whether their metallicity is, respectively, solar, or sub-solar. We used once more the combination of the O and N abundances to deduce the metallicity. These PNe descend from stars of mass above , formed in more recent epochs, younger than 250 Myr. Their surface chemistry, largely contaminated by HBB, exhibits extremely large N abundances; the carbon of these PNe, in all cases above 8, suggests the additional effects of TDU and seems to rule out progenitors. The helium abundances of these sources, in all but one case , further supports this interpretation. In this group we include Hu2-1 (PN G051.4+09.6), surrounded by carbon dust, suggesting the combined effects of HBB and TDU.
4.1.2 Similarities and differences of Sample 1 Galactic PNe with the PNe in the Magellanic Clouds
The PNe of Sample 1 are the only Galactic PNe with measured carbon from CELs. There are two other notabe samples of PNe with measured carbon abundances from CELs, namely, those in the SMC and the LMC, discussed, respectively, in paper I and paper II. We can now compare results from the three different galaxies, based on carbon abundances.
According to the results found in this paper, we confirm one of the main findings of papers I, and II: the present models of carbon stars nicely reproduce the largest abundances of gaseous carbon observed. The observations indicate across the galaxies studied, in agreement with the models. This confirms the existence of an upper limit to the amount of carbon which can be accumulated in the external regions of AGB stars. This limit is likely due to the formation of large quantities of carbon dust in the winds of carbon stars, which favours a fast loss of the external mantle, owing to the effects of radiation pressure, acting on dust grains.
In Sample 1 PNe we did not find pure HBB contamination, at odds with what found for the Magellanic Cloud PNe in papers I and II: while a few N-rich PNe in the LMC (see left panel of Fig 4 of paper I) and the SMC (see left panel of Fig 2 of paper II) disclosed extremely low carbon abundances (), here we find for all N-rich PNe. The small number of N-rich PNe in all studied galaxies does not allow any robust statistics. However, part of the explanation of this result could reside in the averagely higher metallicities of Sample 1 PNe compared with those of paper I and paper II, because the HBB experienced by massive AGB stars is stronger the lower is Z.
4.1.3 A few outliers
In the analysis of the PNe in the present sample, as stated previously, we attempted to deduce the main properties of the progenitors based on the combination of the CNO abundances observed. While the agreement between the observations and the theoretical expectations was generally extremely satisfactory, in a few cases we could not fit simultaneously the abundances of all the elements. We analyse these PNe individually, in the following.
IC 4593 (PN G025.3+40.8). The abundances of N, O and Ne suggest a low-mass () progenitor, with solar metallicity. As evident in the left panel of Fig. 1, the only problem with this interpretation is the carbon content, with is lower than expected. A possible explanation could be that the chemistry of IC 4593 reflects the sole effects of mixing during the RGB ascending, and that some additional carbon depletion occurred, owing to unusually large extra-mixing during the RGB phase. It is worth adding that both carbon and nitrogen error bars are very large for this PN and the inconsistency with the models could be ascribed to the low-quality data available.
DdDm 1 (PN G061.9+41.3). The O and N abundances indicate a low-mass, metal-poor chemistry, with . The presence of traces of silicate dust in the spectra is compatible with this hypothesis. While the carbon abundance is substantially compatible with this interpretation, the measured N is a factor higher than expected (see the left panel of Fig. 1). Possible explanations are an overestimation of the surface N and/or a difference in the original N content in comparison to the typical pop II chemistry, although the large errorbar for nitrogen may indicate a poor S/N spectrum. It is worth recalling that this is a halo PNe (Henry et al. 2008), thus the initial chemical mixture ratios used for the AGB models may not be the ideal choice to model it.
NGC 7662 (PN G106.5-17.6). The N, O and Ne abundances indicate a low-mass progenitor, of sub-solar metallicity, . As shown in the left panel of Fig. 1, the surface carbon (7.37) is too small for this interpretation (but note the huge errorbar). Note that the carbon abundance whose derivation is based on photoionisation models (Henry et al. 2015) is in much better agreement with our interpretation. NGC 7662 is a inhomogeneous PN, with a lot of stratification (see Dufour et al. 2015). This may help to explain the disagreement between the carbon and other abundance indicators.
IC 418 (PN G215.2-24.2). The O and Ne abundances point in favour of a low metallicity progenitor, . This interpretation would also be in agreement with the presence of carbon dust in the surroundings of this object. If this is the case, we deduce from the right panel of Fig. 1 that the N content is overestimated by a factor of . The carbon content is also an issue in this case, as according to the models a higher amount of carbon is expected (see left panel of Fig. 1). IC 418 was discussed in García-Hernández et al. (2016a): the interpretation was different in terms of metallicity, as the oxygen content derived by Delgado-Inglada et al. (2015) is significantly lower compared to the values upon which the present analysis is based.
4.2 Sample 2 PNe
Sample 2 PNe are those Galactic PNe whose dust spectrum has been observed by IRS/Spitzer, and whose dust properties have been uniformly analyzed in the recent past by Stanghellini et al. (2012), Perea-Calderón et al. (2009) and Gutenkunst et al. (2008). Elemental abundances for these PNe are available from García-Hernández & Górny (2014) (hereinafter GG14), who targeted explicitly these dust-analyzed PNe and recalculated the principal elemental abundances from published and newly observed optical emission lines. As in turned out, unfortunately none of the Sample 2 PNe have carbon abundance measured from the CELs UV lines, thus, while interesting, they lack one of the major observing constraints for this type of work. There is still purpose of using this large sample to confront with the AGB yields.
In Table 3 we give the Sample 2 PN names, dust and morphological properties (note that the dust content codes and the morphological type codes are the same as in Table 2), and the elemental abundances (nitrogen, oxygen, and argon, see Fig. 2) with their uncertainties. It is worth noting that the Sample 2 PNe, consisting of 101 targets, is more restricted than the whole sample discussed by GG14. In fact, we have eliminated from the GG14 sample those PNe whose ionization correction factor were deemed by the authors to be uncertain (S. K. Górny, private communication), i.e., those with O. In the Tables we mark with 1 and 2 the PNe that are likely to belong to the Galactic bulge or halo respectively, based on the prescription in Stanghellini & Haywood (2010).
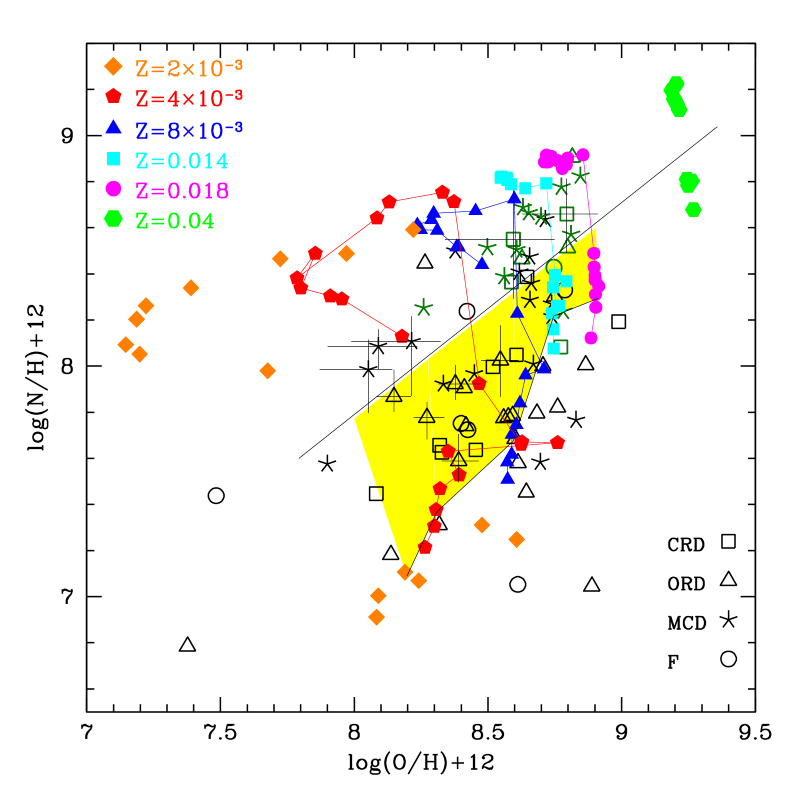
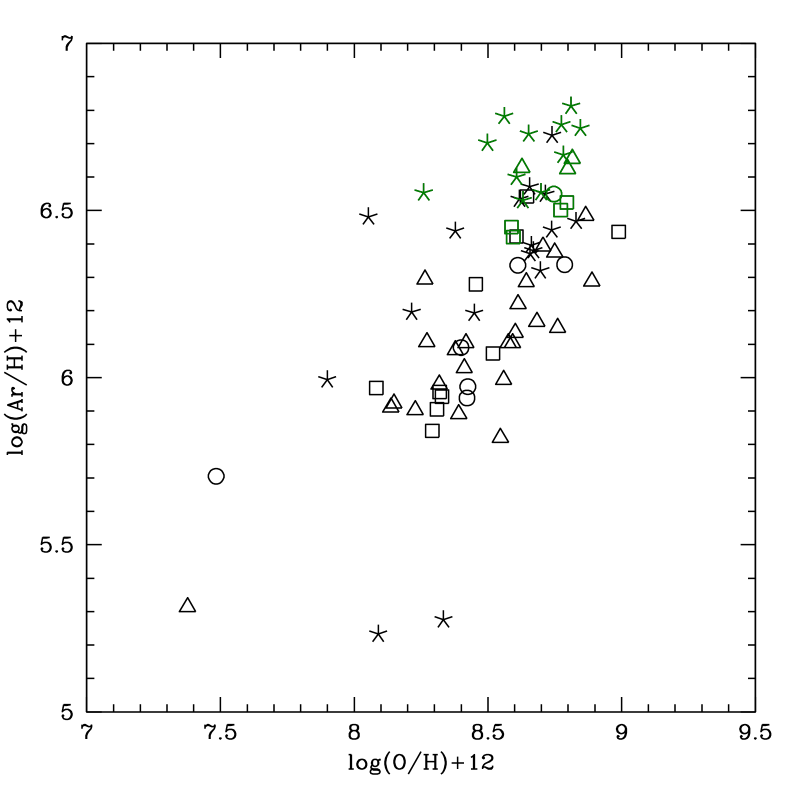
We base our comparison between abundances and yields on the O-N plane. The N and O abundances observed are shown in the left panel of Fig. 2, overimposed to the results from AGB modelling. The observations have been indicated with different symbols, according to the dust properties. The yellow-shaded region indicates the zone of the O-N plane where we expect to find the progeny of carbon stars; in the interpretation of the PNe located close to the lower and upper borders of this region, we will consider the uncertainties related to the final nitrogen of low-mass stars, discussed in section 3.3. The right panel of Fig. 2 shows the observed oxygen and argon abundances. The PNe shown in green in both panels are those with helium abundances , which we will take as the typical threshold above which we see the signature of the second dredge-up, operating in stars of initial mass above .
To derive the mass, age, and metallicity of the progenitors of the Sample 2 PNe we rely on their position on the O-N plane to understand the relative importance of HBB and TDU in modifying the surface chemical composition, which provides an indication on the initial mass (see discussion in section 3.3). The metallicity of the progenitors is deduced on the basis of the position on the O-Ar plane, shown in the right panel of Fig. 2. Among the various species unaffected by AGB evolution, we prefer to use Argon as metallicity indicator, because: a) the chlorine abundance is available only for part of the PNe in the sample; b) the sulphur detected might not reflect the original content, because part of this element is absorbed in dust particles, particularly in carbon-rich environments (Pottasch & Bernard-Salas, 2006).
4.3 Mass and metallicity distribution
The comparison between the Sample 2 PN abundances and the models indicate that approximately half of the PNe in this sample have solar/supersolar metallicity, the remaining exhibit a sub-solar chemistry, with . We find also a few metal-poor objects, namely M 2-39 (PN G008.1-04.7), Pe 2-7 (PN G285.4+02.2), M 4-6 (PN G358.6+01.8): based on the N, O and Ar abundances, we interpret these PNe as the progeny of low-mass stars, with mass below and metallicity . The relative distribution of PNe of different metallicity exhibits a slight change according to the position in the Galaxy: in the bulge, the ”solar” component exceeds by the ”sub-solar”group, whereas in the disk the solar metallicity PNe account for of the total, the more numerous component being the sub-solar one.
The diagonal line in the left panel of Fig. 2 represents an approximate separation between the stars that experienced some HBB, with the consequent nitrogen enrichment of the surface layers, and those that experienced only dredge-up effects. The PNe above this line are identified as the progeny of stars of mass , which underwent SDU and HBB. The fact that most of the PNe in this zone of the O-N plane are also helium-rich adds more robustness to this interpretation. These PNe are the objects formed more recently in the sample examined, and are younger than Myr. The fraction of PNe which have been exposed to HBB during the AGB phase is approximately .
The PNe within the shaded region in the O-N plane are generally interpreted as the progeny of stars with mass in the range , which reached the carbon star stage during the AGB evolution. This is the dominant component in the sample, including of the PNe observed. Similarly to the analysis of Sample 1 PNe, we may conclude that Sample 2 PNe have ages in the range 300 Myr - 2 Gyr, with no straightforward trend between age and the position on the O-N plane. We reiterate here that the vertical extension of this region is somewhat uncertain, as it is sensitive to the extent of the N enrichment occurring during the RGB, which is still debated, and may be different between stars of the same mass.
The remaining of Sample 2 PNe are located below the shaded region in the left panel of Fig. 2; these are the descendants of low-mass stars, which did not reach the C-star stage during the AGB phase. These are the oldest PNe, formed between 2 Gyr and 10 Gyr ago. The spectra of the majority of the PNe in this sub-sample exhibit the feature of silicate dust, in agreement with our interpretation. We do not expect any carbon enhancement in the surface chemical composition of these objects.
4.4 Galactic distribution of Sample 2 PNe
The mass and metallicity distribution of Sample 2 PNe can be used to outline some important points, regarding how PNe of different mass, chemistry and dust type are distributed across the Galaxy.
According to our interpretation, PNe with solar/supersolar metallicity progenitors are composed by of objects that experienced HBB during their AGB life, an indication of massive and relatively young progenitors. The remaining half of solar metallicity PNe are divided among the progeny of C-stars and of low-mass stars, in approximately equivalent percentages. These relative numbers hold both for the bulge and the disk.
4.5 A few outliers
The PNe Mac1-2 (PN G309.5-02.9) and H1-33 (PN G355.7-03.0, in the bulge), represented by the two open squares in the HBB region (i.e., above the straight line) in the left panel of Fig. 2, are enriched in nitrogen, thus indicating the signature of HBB. Their surface chemical composition suggests a progenitor, of solar metallicity. The problem with this interpretation is that their spectra exhibit the typical features of carbon dust; this is at odds with our understanding, as the stars that experience HBB during the AGB phase destroy the surface carbon, thus leaving no room for the formation of carbon dust in the circumstellar envelope. The only possibility to reconcile these results with our theoretical description is that the nitrogen of these PNe are overestimated (the errors associated to the N determination are of the order of 0.2 dex), so that in the O-N plane they fall into the carbon star zone, yellow-shaded in Fig. 2. Alternatively, we are left with three possibilities: a) carbon dust can be formed around PNe, despite the surface oxygen is in excess of carbon; b) in the very final AGB phases, after HBB is turned off by the loss of the external mantle, a sequence of TDU events may favour the formation of a carbon star; (c) the PN is of the MCD type, but the oxygen dust features are too weak to be seen in the spectra. It goes without saying that the knowledge of the carbon content of Mac1-2 and H1-33 would be crucial to answer these questions.
The bulge PNe Th3-4 (PN G354.5+03.3), M3-44 (PN G359.3-01.8), and H1-61(PN G006.5-03.1) exhibit MCD type. In the O-N plane they are represented with the three asterisks at , . The O and N abundances indicate gas processed by HBB, typical of massive () AGB stars; the low oxygen suggests a metallicity . The surface helium is not significantly enriched, at odds with the expectations regarding massive AGB stars. For what regards H1-61 and Th3-4, the observed helium is close to ; taking into account the errors (), these results can be reconciled with the theoretical expectations from SDU computations, thus confirming low-metallicity, massive progenitors for these two PNe. The interpretation for M3-44 is more tricky, because the observed helium is with an error of ; this value is definitively too low to be compatible with SDU effects, thus ruling out a massive progenitor. Given the very small argon abundances, our best interpretation is that M3-44 descends from a metal-poor star (), with initial mass , which experienced some HBB, triggering the increase in the surface N.
Mac 1-11 (PN G008.6-02.6), H1-46 (PN G358.5-04.2), M2-50 (PN G097.6-02.4), He2-62 (PN G295.3-09.3) and H1-1 (PN G343.4+11.9, in the halo) exhibit evidences of the presence of silicates in their spectra, despite being in the region of the O-N plane where we expect to find carbon stars. They are represented by open triangles within the shaded region in the left panel of Fig. 2. Mac 1-11 is in the lower region of the shaded region in the left panel of Fig. 2. Given the uncertainties associated with the measurement of nitrogen dex and the poor understanding of the nitrogen enrichment during the RGB ascending of low-mass stars, we suggest that this PNe descends from a low mass progenitor, and is indeed oxygen-rich.
H1-46 is located in the middle of the C-star region in Fig. 2. Either the N is largely overestimated, or there is no way of explaining this PNe within our modelling.
| PN G | Name | Dust | Morph. | log(N/H)+12 | log(O/H)+12 | log(Ar/H)+12 |
|---|---|---|---|---|---|---|
| (1) | (2) | (3) | (4) | (5) | (6) | (7) |
| 000.1+04.31 | H 1-16 | 7 | 7.766 | 8.830 | 6.468 | |
| 000.7+03.21 | He 2-250 | 4 | 8.464 | 8.627 | 6.628 | |
| 001.4+05.31 | H 1-15 | 4 | 7.348 | 8.422 | 6.350 | |
| 001.6–01.3 | Bl Q | 4 | 8.446 | 8.265 | 6.294 | |
| 001.7–04.61 | H 1-56 | 4 | 7.764 | 8.763 | 6.530 | |
| 002.0–13.4 | IC 4776 | 7 | 7.584 | 8.696 | 6.320 | |
| 002.2–02.71 | M 2-23 | 6 | 7.310 | 8.318 | 5.980 | |
| 002.2–09.41 | Cn 1-5 | 7 | 4 | 8.442 | 8.807 | 6.725 |
| 002.9–03.91 | H 2-39 | 5 | 7.905 | 8.412 | 6.029 | |
| 003.1+02.9 | Hb 4 | 7 | 3 | 8.648 | 8.699 | 6.554 |
| 003.2–04.41 | KFL 12 | 5 | 7.045 | 8.889 | ||
| 003.6+03.11 | M 2-14 | 7 | 8.389 | 8.561 | 6.782 | |
| 004.1–03.81 | KFL 11 | 5 | 7.740 | 8.418 | 6.104 | |
| 006.0+02.81 | Th 4-3 | 7 | 7.722 | 8.365 | 5.403 | |
| 006.0–03.61 | M 2-31 | 7 | 8.360 | 8.662 | 6.396 | |
| 006.1+08.3 | M 1-20 | 3 | 1 | 7.775 | 8.559 | 5.994 |
| 006.3+04.41 | H 2-18 | 5 | 7.795 | 8.683 | 6.167 | |
| 006.4+02.01 | M 1-31 | 7 | 5 | 8.563 | 8.701 | 6.686 |
| 006.5–03.11 | H 1-61 | 7 | 7.985 | 8.053 | 6.481 | |
| 006.8+04.11 | M 3-15 | 7 | 8.364 | 8.723 | 6.540 | |
| 007.2+01.8 | Hb 6 | 7 | 2 | 8.474 | 8.656 | 6.571 |
| 008.1–04.71 | M 2-39 | 4 | 6.784 | 7.377 | 5.314 | |
| 008.2–04.81 | M 2-42 | 0 | 8.330 | 8.787 | 6.338 | |
| 008.3–01.1 | M 1-40 | 7 | 2 | 8.515 | 8.498 | 6.702 |
| 008.6–02.61 | MaC 1-11 | 5 | 7.588 | 8.391 | 5.891 | |
| 009.3+04.1 | Th 4-6 | 6 | 8.000 | 8.566 | 5.989 | |
| 010.6+03.2 | Th 4-10 | 1 | 8.386 | 8.569 | 6.477 | |
| 011.1+07.0 | Sa 2-237 | 5 | 4 | 8.905 | 8.816 | 6.655 |
| 012.5–09.8 | M 1-62 | 2 | 2 | 6.824 | 8.423 | 5.856 |
| 014.3–05.5 | V-V 3-6 | 1 | 3 | 7.752 | 8.427 | 5.866 |
| 018.6–02.2 | M 3-54 | 0 | 7.053 | 8.612 | 6.336 | |
| 019.2–02.2 | M 4-10 | 6 | 7.779 | 8.576 | 6.104 | |
| 019.4–05.3 | M 1-61 | 7 | 5 | 8.009 | 8.670 | 6.380 |
| 019.7+03.2 | M 3-25 | 7 | 8.215 | 8.740 | 6.725 | |
| 019.7–04.5 | M 1-60 | 7 | 8.777 | 8.775 | 6.757 | |
| 020.9–01.1 | M 1-51 | 7 | 4 | 8.572 | 8.811 | 6.812 |
| 023.8–01.7 | K 3-11 | 7 | 7.923 | 8.334 | 5.276 | |
| 025.3–04.6 | K 4-8 | 5 | 5 | 7.785 | 8.592 | 6.104 |
| 027.6–09.6 | IC 4846 | 5 | 2 | 7.685 | 8.602 | 6.134 |
| 032.9–02.8 | K 3-19 | 2 | 8.250 | 8.579 | 6.090 | |
| 038.7–03.3 | M 1-69 | 0 | 8.428 | 8.747 | 6.549 | |
| 042.9–06.9 | NGC 6807 | 6 | 4 | 7.821 | 8.761 | 6.149 |
| 052.9+02.7 | K 3-31 | 2 | 8.193 | 8.989 | 6.436 | |
| 055.5–00.5 | M 1-71 | 2 | 8.083 | 8.772 | 6.501 | |
| 060.5+01.8 | He 2-440 | 4 | 8.407 | 9.650 | 6.573 | |
| 068.7+01.9 | K 4-41 | 4 | 2 | 8.004 | 8.866 | 6.484 |
| 079.9+06.4 | K 3-56 | 5 | 2 | 8.228 | 5.903 | |
| 097.6–02.4 | M 2-50 | 5 | 2 | 7.922 | 8.378 | 6.083 |
| 107.4–02.6 | K 3-87 | 2 | 2 | 8.292 | 5.841 | |
| 184.0–02.1 | M 1-5 | 2 | 2 | 7.447 | 8.083 | 5.969 |
| 205.8–26.7 | MaC 2 | 2 | 2 | 7.328 | 8.320 | 5.829 |
| 235.3–03.9 | M 1-12 | 2 | 5 | 7.760 | 8.606 | 5.501 |
| 263.0–05.5 | PB 2 | 2 | 2 | 8.310 | 5.905 | |
| 264.4–12.72 | He 2-5 | 2 | 1 | 7.554 | 8.378 | 5.976 |
Chemical abundances and other properties of Sample 2 PNe PN G Name Dust Morph. log(N/H)+12 log(O/H)+12 log(Ar/H)+12 (1) (2) (3) (4) (5) (6) (7) 275.3–04.72 He 2-21 2 2 7.626 8.328 5.943 278.6–06.7 He 2-26 2 2 7.997 8.519 6.072 285.4+01.5 Pe 1-1 1 4 8.049 8.607 6.422 285.4+02.2 Pe 2-7 0 2 7.438 7.484 5.705 286.0–06.5 He 2-41 2 4 7.656 8.320 5.957 289.8+07.72 He 2-63 0 2 7.724 8.425 5.973 295.3–09.3 He 2-62 5 4 7.868 8.149 5.923 296.3–03.0 He 2-73 7 5 8.408 8.618 6.534 297.4+03.7 He 2-78 1 2 7.871 8.677 6.127 300.7–02.0 He 2-86 7 4 8.666 8.653 6.729 307.5–04.9 MyCn 18 7 4 8.281 8.590 6.438 309.0+00.8 He 2-96 7 2 8.238 8.782 6.666 309.5–02.9 MaC 1-2 1 2 8.550 8.595 6.420 324.8–01.1 He 2-133 7 3 8.688 8.631 6.530 327.8–06.1 He 2-158 7 4 7.967 8.449 6.193 334.8–07.4 SaSt 2-12 4 4 6.844 6.656 336.3–05.6 He 2-186 1 4 8.364 8.588 6.450 336.9+08.3 StWr 4-10 5 2 7.182 8.137 5.911 340.9–04.6 Sa 1-5 0 2 7.751 8.400 6.090 343.4+11.92 H 1-1 5 3 8.025 8.547 5.820 344.4+02.8 Vd 1-5 2 7.637 8.455 6.279 345.2–08.8 Tc 1 3 1 7.498 8.453 6.307 348.4–04.12 H 1-21 7 4 8.636 8.715 6.549 348.8–09.0 He 2-306 0 2 8.718 6.471 351.9–01.91 Wray 16-286 7 8.270 8.739 6.442 352.6+03.01 H 1-8 7 8.483 8.619 6.635 354.2+04.31 M 2-10 1 8.387 8.646 6.542 354.5+03.31 Th 3-4 7 8.107 8.215 6.196 355.2–02.5 H 1-29 7 8.155 8.619 6.320 355.6–02.71 H 1-32 6 7.580 8.613 6.220 355.7–03.01 H 1-33 1 8.660 8.795 6.524 355.7–03.51 H 1-35 6 7.453 8.644 6.286 356.2–04.41 Cn 2-2 6 8.303 8.750 6.375 356.9+04.41 M 3-38 7 8.500 8.378 6.439 357.6+01.71 H 1-23 4 8.512 8.798 6.624 357.6+02.6 H 1-18 7 9.387 9.882 7.358 358.2+03.61 M 3-10 4 8.000 8.706 6.393 358.2+04.21 M 3-8 7 8.117 8.377 6.403 358.5–04.21 H 1-46 6 7.777 8.272 6.107 358.6+01.81 M 4-6 7 2 7.576 7.899 5.994 358.7–05.21 H 1-50 7 8.286 8.657 6.371 358.9+03.21 H 1-20 7 8.505 8.607 6.600 358.9+03.41 H 1-19 7 8.253 8.260 6.553 359.3+03.61 Al 2-E 0 8.238 8.422 5.939 359.3–01.81 M 3-44 7 8.086 8.090 5.233 359.7–02.6 H 1-40 7 7.943 8.528 6.233 359.9–04.51 M 2-27 7 8.825 8.846 6.746
The N content of M-50 and He2-62 is too large to be compatible with a low-mass progenitor that failed to reach the C-star stage. The discrepancy between the models and the observation in this case amounts to dex, far in excess of the uncertainties associated to the measurements (very small in these cases) or to the modelling of extra-mixing during the RGB phase. Our favourite possibility here is that the N is slightly underestimated, thus rendering the chemical composition of M-50 and He2-62 compatible with a progenitor, that experienced some HBB, thus inhibiting the formation of a carbon star.
For what concerns H1-1, there is the possibility that it descends from a low-mass () progenitor, which never reached the C-star stage. The reason for its anomalous position, within the C-star region, might be related to a different nitrogen content, possibly enhanced, in the halo region where it formed.
In all these outlier cases, it is almost impossible to proceed without a measure of the atomic carbon content of the PNe. With these measurements on hand, we are confident that the evolutionary paths to the observed chemistry, given initial mass and metallicity, would be more obvious.
5 Discussion
Dust properties of PNe have been linked to their progenitors in a variety of environments (e.g., Stanghellini et al. 2007, 2012).
With Sample 1 we find similar conclusions that were addressed by Stanghellini et al. (2007) for LMC PNe. 4 out of the 6 PNe for which dust identification is available confirm that ORD corresponds to , and CRD to . Statistics is very limited for sample 1 though, and we do find 2 exceptions of CRD PNe with (NGC 6826 and NGC 3242).
We can not use Sample 2 PNe for this type of analysis, given the lack of carbon abundances for these PNe.
In this work, using Sample 2 PNe, we found a similar fraction of subsolar and solar metallicity PNe with ORD dust chemistry. GG14 analyzed several of the Sample 2 PNe, together with other PNe with known dust properties, and found that solar ORD PNe predominate. It is worth noting that we did not include in Sample 2 PNe with uncertain abundances, while GG14 had, so this selection may explain the different population fraction.
CRD PNe are rare in the bulge, as noted by GG14. On the other hand, MCD PNe are frequent in the bulge. These PNe lie in the carbon star progeny locus of the ON diagram (the yellow region of Fig. 2). Naturally, the conclusion about these progenitors is linked to the reliability of the ON diagnostics to predict that these AGB stars do not experience HBB. It is also worth adding that, as noted by García-Hernández et al. (2016b), we can not disregard other formation channels for MCD PNe, such as extra-mixing, rotation, binary interaction, or pre-He enrichment. These channels will only be constrained when carbon gas abundances will be available for these PNe.
We found that the majority () of disk PNe with sub-solar metallicity are the progeny of carbon stars. This results, in agreement with the analysis by GG14, could be partly due to the intrinsic difficulty in detecting PNe with very massive progenitors, owing to the short time they evolve at high luminosity. This paucity of HBB PNe with very massive progenitors is seen in both the disc and the bulge.
By comparing the observed chemistry of each object with the model predictions we found that both sub-solar and solar metallicity MCD PNe could be the progeny of massive () AGB evolution. Once again, gas phase carbon abundances will clarify this point, especially since there are chemical outliers that could have a very different origin (see a relevant discussion in GG14). We also found that the fraction of PNe descending from AGB stars that experienced HBB in the bulge is higher () than in the disc, suggesting a higher percentage of young PN progenitors in the bulge than in the disc. The latter result is based on 12 PNe, thus it must be taken with some caution, and follow up when carbon abundances of these PNe will be available.
6 Conclusions
We study the PNe population of the Milky Way, based on the properties of two samples of Galactic PNe, selected according to the availability of their physical parameters in the literature. Sample 1 includes 40 PNe, for which the CNO abundances are available, with carbon measurements are from ultraviolet emission lines. Sample 2 includes 102 PNe whose dust properties and abundances of several elements are available, but atomic carbon has not been measured from CELs so far.
By comparing the PNe chemical composition data samples at hand with the yields from AGB evolution of an array of models, we discussed the possible progenitors of the PNe observed. Particular importance have the abundances of elements related to CNO cycling, which are the most sensitive to the efficiency of the physical processes able to alter the surface chemical composition of stars during the AGB evolution.
The mass fraction of neon and argon are also used in the comparison, mainly to infer the metallicity of the progenitor populations, because these elements are not expected to undergo significant changes during the AGB phase.
Furthermore, the enrichment in the helium abundance helps the interpretation, being a sign of SDU, operating only in massive AGB stars.
According to our interpretation the majority of PN progenitors, about , have a solar chemical composition, the remaining having metallicities in the range . A few metal-poor objects are also present in the samples. Half of the sources in both samples disclose a carbon-rich chemistry, thus suggesting a C-star origin. These PNe descend from progenitors, formed between 500 Myr and 2 Gr ago.
A small fraction () of Sample PNe 1 are nitrogen enriched, indicating that they have been exposed to HBB during the AGB evolution. The progenitors of these PNe are the youngest stars to have ejected a PN, formed not earlier than 250 Myr ago, and with mass above . The fraction of nitrogen rich PNe is slightly higher () in Sample 2 than in Sample 1.
The remaining PNe of both samples are the progeny of low-mass () stars, which are older than 2 Gyr. These old stars failed to reach the carbon star stage because they lost the external envelope before achieving the condition at the surface of the star.
We conclude that measuring gas phase carbon abundance in PNe is crucial to allow a robust classification of PNe and their progenitors. Carbon is the most sensitive element to the two physical mechanisms potentially able to alter the surface chemical composition of AGB stars, namely TDU and HBB. In this context, the analysis of Sample 1 PNe provides a more robust analysis of the AGB progenitors than that of Sample 2 PNe. The observed carbon abundances are nicely reproduced by the yields of AGB evolution used in the present analysis, in particular for the upper limits of the carbon amounts. This finding supports the outcome of AGB modeling, indicating an upper limit to the quantity of carbon which can be accumulated to the surface regions of the stars, and that can be observed directly in PNe. This is due to the low effective temperature reached during the carbon star stage, which favours the formation of great quantities of carbon dust, leading to a rapid loss of the external envelope, once the surface carbon is largely in excess of oxygen.
A few Sample 2 PNe present a HBB contaminated chemistry, yet they are unexpectedly are surrounded by carbon dust. Measuring atomic carbon from UV CELs in these PNe would be extremely important to shed new light on the very final AGB phases of massive AGB stars, particularly on the possibility, still highly debated, that late TDU events could favour the C-star stage, after HBB is extinguished.
Acknowledgments
L.S. is indebted to the Observatory of Rome for the warm hospitality during her sabbatic leave and to S. K. Górny for useful discussions. D.A.G.-H. was funded by the Ramon y Cajal fellowship number RYC-2013-14182. D.A.G.-H. and F.D. acknowledge support provided by the Spanish Ministry of Economy and Competitiveness (MINECO) under grant AYA-2014-58082-P.
References
- Bianchi et al. (2001) Bianchi L., Bohlin R., Catanzaro G., Ford H., Manchado A. 2001, AJ, 122, 1538
- Blöcker (1995) Blöcker T. 1995, A&A, 297, 727
- Boyer et al. (2011) Boyer M. L., Srinivasan S., van Loon, J. T., et al. 2011, AJ, 142, 103
- Boyer et al. (2012) Boyer M. L., Srinivasan S., Riebel D., McDonald I., van Loon J. Th., Clayton G. C., Gordon K. D., Meixner M., Sargent B. A., Sloan G. C. 2012, ApJ, 748, 40
- Canuto & Mazzitelli (1991) Canuto V. M. C., Mazzitelli I. 1991, ApJ, 370, 295
- Charbonnel & Lagarde (2010) Charbonnel C., Lagarde, N. 2010, A&A, 522, A10
- Cioni et al. (2000) Cioni M.-R. L., van der Marel R. P., Loup C., Habing H. J. 2000, A&A, 359, 601
- Delgado-Inglada & Rodríguez (2014) Delgado-Inglada G., Rodríguez M. 2014, ApJ, 784, 173
- Delgado-Inglada et al. (2015) Delgado-Inglada G., Rodríguez M., Peimbert M., Stasińska G., Morisset C. 2015, MNRAS, 449, 1797
- Dell’Agli et al. (2014) Dell’Agli F., Ventura P., García-Hernández D. A., Schneider R., Di Criscienzo M., Brocato E., D’Antona F., Rossi C. 2014, MNRAS, 442, L38
- Dell’Agli et al. (2015a) Dell’Agli F., Ventura P., Schneider R., Di Criscienzo M., García-Hernández D. A., Rossi C., Brocato E. 2015a, MNRAS, 447, 2992
- Dell’Agli et al. (2015b) Dell’Agli F., García-Hernández D. A., Ventura P., Schneider R., Di Criscienzo M., Rossi C. 2015b, MNRAS, 454, 4235
- Di Criscienzo et al. (2013) Di Criscienzo M., Dell’Agli F., Ventura P., Schneider R., Valiante R., La Franca F., Rossi C., Gallerani S., Maiolino, R. 2013, MNRAS, 433, 313
- Di Criscienzo et al. (2016) Di Criscienzo M., Ventura P., García-Hernández D. A., et al. 2016, MNRAS, 462, 395
- Dufour et al. (2015) Dufour R. J., Kwitter K. B., Shaw R. A., et al. 2015, ApJ, 803, 23
- Ferrarotti & Gail (2006) Ferrarotti A. D., Gail H. P. 2006, A&A, 553, 576
- García-Hernández & Górny (2014) García-Hernández D. A., & Górny S. K. 2014, A&A, 567, A12
- García-Hernández et al. (2016a) García-Hernández,D. A., Ventura P., Delgado-Inglada G., Dell’Agli F., Di Criscienzo M., Yague A. 2016a, MNRAS, 458, L11
- García-Hernández et al. (2016b) García-Hernández,D. A., Ventura P., Delgado-Inglada G., Dell’Agli F., Di Criscienzo M., Yague A. 2016b, MNRAS, 461, 542
- Girardi & Marigo (2007) Girardi L., Marigo P. 2007, A&A, 462, 237
- Grevesse & Sauval (1998) Grevesse N., Sauval A. J. 1998, SSrv, 85, 161
- Groenewegen et al. (2007) Groenewegen M. A. T., Wood P. R., Sloan G. C., et al. 2007, MNRAS, 376, 313
- Gutenkunst et al. (2008) Gutenkunst S., Bernard-Salas J., Pottasch S. R., Sloan G. C., Houck, J. R. 2008, ApJ, 680, 1206-1221
- Henry et al. (2000) Henry, R. B. C., Kwitter, K. B., Bates, J. A. 2000, ApJ, 531, 928
- Henry et al. (2008) Henry, R. B. C., Kwitter, K. B., Dufour, R. J., Skinner, J. N. 2008, ApJ, 680, 1162-1173
- Henry et al. (2015) Henry, R. B. C., Balick, B., Dufour, R. J., et al. 2015, ApJ, 813, 121
- Iglesias & Rogers (2006) Iglesias C. A., Rogers F. J. 1996, ApJ, 464, 943
- Izzard et al. (2004) Izzard R. G., Tout C. A., Karakas A. I., Pols, O. R. 2004, MNRAS, 350, 407
- Karakas & Lattanzio (2014) Karakas A. I., Lattanzio J. C. 2014, PASA, 31, e030
- Keller & Wood (2006) Keller S. C., Wood P. R. 2006, ApJ, 642, 834
- Kingsburgh & Barlow (1994) Kingsburgh R. L., Barlow M. J. 1994, MNRAS, 271, 257
- Lodders (2003) Lodders K. 2003, ApJ, 591, 1220
- Maraston et al. (2006) Maraston C., Daddi E., Renzini A., et al. 2006, ApJ, 652, 85
- Marigo & Aringer (2009) Marigo P., Aringer B. 2009, A&A, 508, 1538
- Nanni et al. (2013) Nanni A., Bressan A., Marigo P., Girardi L. 2013, MNRAS, 434, 2390
- Nanni et al. (2014) Nanni A. Bressan A. Marigo P. Girardi L. 2014, MNRAS, 438, 2328
- Nanni et al. (2016) Nanni A., Marigo P., Groenewegen M. A. T., et al. 2016, MNRAS, 462, 1215
- Perea-Calderón et al. (2009) Perea-Calderón J. V., García-Hernández D. A., García-Lario P., Szczerba R., Bobrowsky M. 2009, A&A, 495, L5
- Pottasch & Bernard-Salas (2006) Pottasch S. R., Bernard- Salas J. 2006, A&A, 457, 189
- Riebel et al. (2010) Riebel D., Meixner M., Fraser O., Srinivasan S., Cook K., Vijh U. 2010, ApJ, 723, 1195
- Riebel et al. (2012) Riebel D., Srinivasan S., Sargent B., Meixner M. 2012, AJ, 753, 71
- Romano et al. (2010) Romano D., Karakas A. I., Tosi M., Matteucci, F. 2010, A&A, 522, A32
- Santini et al. (2014) Santini P., Maiolino R., Magnelli B., et al. 2014, A&A, 562, A30
- Srinivasan et al. (2009) Srinivasan S. et al. 2009, AJ, 137, 4810
- Srinivasan et al. (2011) Srinivasan S., Sargent B. A., Meixner, M. 2011, A&A, 532, A54
- Stanghellini et al. (2007) Stanghellini L., Garcia-Lario P., García-Hernández D. A., et al. 2007, ApJ, 671, 1669
- Stanghellini & Haywood (2010) Stanghellini L., Haywood M. 2010, ApJ, 714, 1096
- Stanghellini et al. (2012) Stanghellini L., García-Hernández D. A., García-Lario P., Davies, J. E., Shaw R. A., Villaver E., Manchado A., Perea-Calderón J. V. 2012, ApJ, 753, 172
- Valiante et al. (2011) Valiante R., Schneider R., Salvadori S., Bianchi S. 2011, MNRAS, 416, 1916
- Ventura et al. (2000) Ventura P., D’Antona F., Mazzitelli I. 2000, A&A, 363, 605
- Ventura et al. (2001) Ventura P., D’Antona F., Mazzitelli I., Gratton R. 2001, ApJL, 550, L65
- Ventura & D’Antona (2005) Ventura P., D’Antona F. 2005, A&A, 431, 279
- Ventura & D’Antona (2009) Ventura P., D’Antona F. 2009, MNRAS, 499, 835
- Ventura et al. (2012a) Ventura P., Di Criscienzo M., Schneider R., Carini R., Valiante R., D’Antona F., Gallerani S., Maiolino R., Tornambé A. 2012a, MNRAS, 420, 1442
- Ventura et al. (2012b) Ventura P., Di Criscienzo M., Schneider R., Carini R., Valiante R., D’Antona F., Gallerani S., Maiolino R., Tornambé A. 2012b, MNRAS, 424, 2345
- Ventura et al. (2014a) Ventura P., Dell’Agli F., Di Criscienzo M., Schneider R., Rossi C., La Franca F., Gallerani S., Valiante R. 2014a, MNRAS, 439, 977
- Ventura et al. (2014b) Ventura, P., Di Criscienzo, M. D., D’Antona, F., et al. 2014, MNRAS, 437, 3274
- Ventura et al. (2013) Ventura P., Di Criscienzo M., Carini R., D’Antona F. 2013, MNRAS, 431, 3642
- Ventura et al. (1998) Ventura P., Zeppieri A., Mazzitelli I., D’Antona F. 1998, A&A, 334, 953
- Ventura et al. (2015a) Ventura P., Karakas A. I., Dell’Agli F., Boyer M. L., García-Hernández D. A., Di Criscienzo M., Schneider R. 2015a, MNRAS, 450, 3181
- Ventura et al. (2016a) Ventura P., Karakas A. I., Dell’Agli F., García-Hernández D. A., Boyer M. L., Di Criscienzo M. 2016a, MNRAS, 457, 1456
- Ventura et al. (2015b) Ventura P., Stanghellini L., Dell’Agli F., García-Hernández D. A. & Di Criscienzo M. 2015a, MNRAS, 452, 3679 (paper I)
- Ventura et al. (2016b) Ventura P., Stanghellini L., Di Criscienzo M., García-Hernández D. A., Dell’Agli, F. 2016b, MNRAS, 460, 3940 (paper II)
- Wachter et al. (2002) Wachter A., Schröder K. P., Winters J. M., Arndt T. U., Sedlmayr E. 2002, A&A, 384, 452
- Wachter et al. (2008) Wachter A., Winters J. M., Schröder K. P., Sedlmayr E. 2008, A&A, 486, 497
- Westerlund (1997) Westerlund B. E. 1997, The Magellanic Clouds. Cambridge Univ. Press, Cambridge