Towards Release Strategy Optimization for Apps
in Google Play
I. Introduction
In the past few years, the “app economy” has been growing fast and gaining revenues to developers. As of 2015, millions of apps have been developed and distributed in app marketplaces such as Apple Store and Google Play. It was reported that the yearly revenue from the Apple AppStore has reached over 20 billion USD as of 2015,111http://www.computerworld.com/article/3019716/apple-ios/apples-cut-of-2015-app-store-revenue-tops-6b.html and the aggregated revenue from all app stores is expected to reach 70 billion by 2017.222http://www.digi-capital.com/reports The great profits and rapidly released apps make the app marketplaces very competitive, and developers have an urgent requirement to distinguish their own apps out of various competitors that provide similar features.
Release (or update) strategies are believed to be important to app success. Nayebi et al. (2016) found from their survey that experienced developers believe that release strategy affects user feedback. Martin et al. (2016) demonstrated that releases can have causal impact to user feedback in Google Play. McIlroy et al. (2016) suggested that developers should not shy away from updating their apps very frequently. However, the rationale behind the relationship between app success and release strategy is still not comprehensively studied. Hence, directive information is lacked for developers to optimize their release strategy.
In this paper we propose an empirical study to help developers decide the opportunity of release to maximize positive feedback from users at scale. Our approach is conducted with 17,820 apps from Google Play. Compared to previous study (McIlroy et al. (2016)), we have some new insights as follows.
First, we find that the release frequency is not always a comprehensive indicator for app release strategy. For example, an app is updated 4 times in a week but stays stable in the following 3 weeks. Another app is updated once for each of the 4 weeks. Both of the two apps have a weekly release frequency. However, the update results of the two apps can be different, because users are concerned about and even annoyed by the frequent updates333http://www.makeuseof.com/answers/many-android-apps-update-frequently/ (i.e., the 4 updates in one week). To alleviate this problem, we propose to measure the frequency of each update with the interval information against its previous update. The interval can characterize the locality of releases instead of the average frequency. We divide the update interval to three groups of successive, normal, and sparse and find differences in feedback.
Second, the effect of a release should not only be related to the release behavior itself, but also an aggregated result of the quality (Lu et al. (2017)) and accumulated user adoption of the corresponding app. Intuitively, a user may be more tolerant to successive updates for the app that she likes than that she dislikes. We employ the ranking of an app, which is provided by Google Play, to indicate the position of the app in its category. Analysis results show that the change of ranking after a successive update suggests the Matthew Effect, i.e., the high-ranked apps get higher ratings and the lowly-ranked apps get lower ratings. Additionally, we leverage the rating trend, which is detected from the rating curve, to indicate the current situation of an app. We find that a timely subsequent release can take a turn for a descending rating trend with a higher probability than a late release.
Third, user feedback can be different to releases with different purposes. Traditional reasons for app releases include bug fixes, new features, and library updates (Gui et al. (2015)), which also apply to traditional software releases. With the unique and low-cost deployment platform such as Google Play in the mobile era, new version of apps are also released for additional reasons, such as stimulating downloads and ratings (Comino et al. (2015)). Terms indicating different purposes appear unequally in releases with positive and negative impacts (Martin et al. (2016)). We move a step further to see how the purpose affects feedback with different update frequency. Results imply that developers should not shy away from fixing bugs by performing hotfixes, but be cautious not to change features too frequently.
We follow up on the empirical results with a Multinomial Naive Bayes model to predict update effect based on the aforementioned factors. The prediction achieves a high accuracy of 76% in a 5-fold cross validation. By maximizing the effect variable, we provide developers with an optimal interval for the next update. Developers can refer to the suggested interval to optimize their release plan and optimize development process.
More specifically, we make the following main contributions:
-
•
We propose to measure app release patterns in finer grain and use interval to characterize the local features of releases. Various findings and implications are derived from the observations.
-
•
We conduct an empirical analysis to explore the relation among update effect and app ranking, rating trend, and update purpose using large scale of apps from Google Play, i.e., 41,028 releases of 17,820 apps.
-
•
We propose the first approach to optimizing app release strategy by training a Multinomial Naive Bayes model and give actionable suggestions to Android app developers to optimize their release strategy.
The rest of the paper is organized as follows. Section II introduces the concepts and terms used in this paper. Section III explains the research questions. Section IV describes the data set. Section V, VI, and VII study the three research questions posed in Section III, respectively. Section VIII discusses threats to validity of this study. Section IX describes the related work of app release. Section X concludes the paper.
II. Definitions
In this section we define the terms and metrics used in this paper.
i. Update Interval
Instead of using average frequency to represent release pattern of an app (McIlroy et al. (2016)), in this study we focus on each single update of apps. That is, for each update, we count the days of interval to its previous one as the frequency of this update. For example, let denote the th update of app . was conducted on the day , and the update of was conducted on the day . The interval of to is . In this way, each update is described with the interval, and the releases of an app can be represented as a sequence of intervals.
To investigate the difference of user feedback in updates with different intervals, we first categorize the updates according to their intervals into three groups, i.e., successive updates, normal updates, and sparse updates.
Successive Updates are updates that have intervals between 1 day to 5 days to its previous update. Users concern about the reason and necessity of an additional update right after an existing one. Additionally, app quality can be unstable with fast iteration. We assume it interesting to see the change of user feedbacks to such updates.
Normal Updates are updates that have intervals between 5 days to 20 days to its previous update. Such updates can be considered to perform routine maintenance and improvement of apps.
Sparse Updates are updates that have intervals longer than 20 days to its previous update. Such intervals are quite long in the fast iterative environment. A sparse update can be a release of version with new features or just a bugfix. We would like to see the influence of sparse updates.
ii. Rating
Rating is an important indicator of popularity and success of an app. For different versions of apps, ratings rise or fall to capture the satisfaction levels of users (Ruiz et al. (2016)). We adopt rating to evaluate user feedbacks to updates in this study.
In addition to reacting to updates, ratings of apps can be influenced by multiple factors including latent ones. In other words, ratings are unstable (Martin et al. (2016)). In comparison, a fitting curve can describe user adoption to both the app itself and recent changes with disturbance omitted, which is more reliable. We fit the trend of rating from the curve and detect turning points after which the trend changes significantly. The approach to detecting the turning points is described in Section III.
iii. Factors Influential to Update Effects
Effect of an update to an app is related to various kinds of factors. One important factor is the opportunity of releasing, i.e., the interval of the update. In addition, the current popularity of the app which is measured with its ranking, the rating trend which reflects user adoption of the app in the dynamic perspective, and the purpose of update (i.e., fixing bugs or adding new features) can also contribute to update effects.
Ranking. Google Play provides a ranking list for top apps in each category. Each list contains 540 apps. The ranking of each app in this list reflects aggregated popularity of the app in relative to other apps in the same category. Although the algorithm of ranking works as a blackbox, user adoption is considered to be involved in the algorithm. We assume that users hold different levels of tolerance to highly ranked apps and lowly ranked apps. The lists keep updating and we crawl them daily.
Rating Trend. Due to various reasons, user adoption of an app can change. For example, ratings of a famous app can decline because of unstable networking service. Rating of a little-known app can increase for its fascinating new functions. We wonder whether the current trend of rating show inertia when coming with a new update. In other words, will a new update assist a good trend or reverse a bad trend?
Update Purpose. Existing research has revealed that bug fixing occupies a large proportion of development efforts. In addition, terms of ‘bug’, ‘fix’, ‘new’, and ‘feature’ are more common in releases that positively affected ratings, as opposed to those that negatively affected ratings (Martin et al. (2016)). In this paper, we take a further step to reveal the reasons of both positive and negative effects of an update with either purpose of fixing bugs or adding new features.
III. Research Questions
In this section we propose three research questions and explain the methodology to answer them.
RQ1: Is interval of update a good metric to characterize app releases?
Before studying user feedback of releases, we first conduct an empirical analysis about the distribution of update intervals in Google Play in Section V. Since we assume that the metric interval is better in characterizing local release patterns than average frequency, we determine whether successive updates are significant in all the updates, and whether it is common in apps. If the catholicity of successive updates is supported, this motivates further analysis of them.
Furthermore, we explore the philosophy behind different patterns of intervals. It is expected that the features of update interval can reveal more information about the developers such as the attitudes towards release strategy.
RQ2: What impacts update feedbacks?
We measure update effects using the app rating as user feedback. Because of the instability of app ratings (Martin et al. (2016)), it is hard to trace the rating change back to release impacts. Hence, we focus on significant updates within time-lag slots before turning points, and explore the influential factors in Section VI.
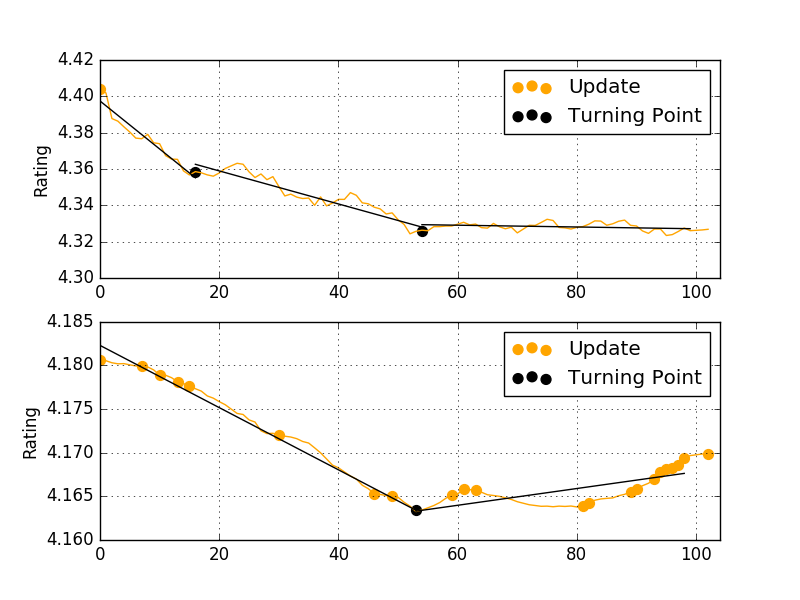
Turning Points. A turning point is where the rating trend change significantly in the fitted rating curve. We detect the turning point in two steps. First, the ratings of a specific app could be aggregated into a time series vector . In this way the detection problem can be framed into a segmentation problem, which can be traditionally settled with producing the best representation of using only segments (Sugiura and Ogden (1994), Ge and Smyth (2001)). Second, we employ Top-Down online algorithm to train a concurrent Piecewise Linear Representation (Chua and Deng (1986)) model (i.e., PMR model) on . For clarity, this method works by considering every possible partitioning of the time series vector and splitting it at the best location. Both subsections are then tested to see if their approximation error is below the user-specified threshold, which we set as the median consecutive changes of . Otherwise, the algorithm recursively continues to split the sub-sequences until all the segments have approximation errors below the threshold.
Obviously, various models besides PLR model can support the segmentation mining, such as the Bayesian Structural Time-Series model (Wilkinson (1999)) applied by (Martin et al. (2016)). This method focuses on the probability that model generate by comparing an occurred time series vector post-release with the counterfactual prediction. A low -value () will indicate a significant change of rating, which means a turning point has been detected. However, we choose to fit the trend of time series vector by Linear Interpolation (De Boor et al. (1978)), and the turning point occurs when the trend changes. The way of detecting turning points is demonstrated in Figure 1.
Time Lag. Given the fact that users need time to react to a new version of apps (to update the app on their devices, to get familiar with new functions, etc.) by rating, the lag-effect between update curve and rating curve undoubtedly exists. To detect such effect, we first model update points and ratings into two series vectors, and , respectively. Smooth operations are employed on and to eliminate the noise. Second, we use the Pearson product-moment correlation coefficient (i.e., PPCC) (Lee Rodgers and Nicewander (1988)) to estimate how update and rating are correlated with different time lags. Similar to the correlation study between the proposed features of a company and the financial time series for its stock (Ruiz et al. (2012)), we apply this time lag detection method to each app and calculate the PPCC value for each pair of vectors with different time lags. A low -value () indicates that the update vector correlates with the rating vector significantly.
By accumulating the percentage of significantly correlated vectors of each app with different time lags, it is found that 4 days lag between update vector and rating vector is the largest as 48% where the values at 0 day lag is 35%. The analysis suggests the existence of time lag between update behavior and rating reaction, which in turn indicates that an update within a proper time slot before a rating change is correlated with the change with high possibility.
RQ3: How to optimize the strategy of app release?
It is a complex task to optimize release strategy because multiple factors, even latent ones, can influence the effect of updates. Based on the factors studied in this paper, we take the first step to help developers to select an optimized time to release next version of their apps through a Multinomial Naive Bayes model in Section VII.
IV. Data Set
We collected a set of 17,820 apps of 33 categories in Google Play from November 25, 2016 to March 10, 2017 (105 days in total). The gathered apps all appeared in the ‘top 540’ lists of each category during this period. We adopt this list because the included apps are likely to have many releases, received feedbacks from users, and have reliable data of ratings, yet alleviate the App Sampling Problem (Martin et al. (2015a)).
The crawler cycles over each of the 17,820 apps in the span of 24 hours. Finally, 41,028 updates are collected. We then extract the information we need in our study, i.e., ranking, rating, text in what’s new, and version of each app.
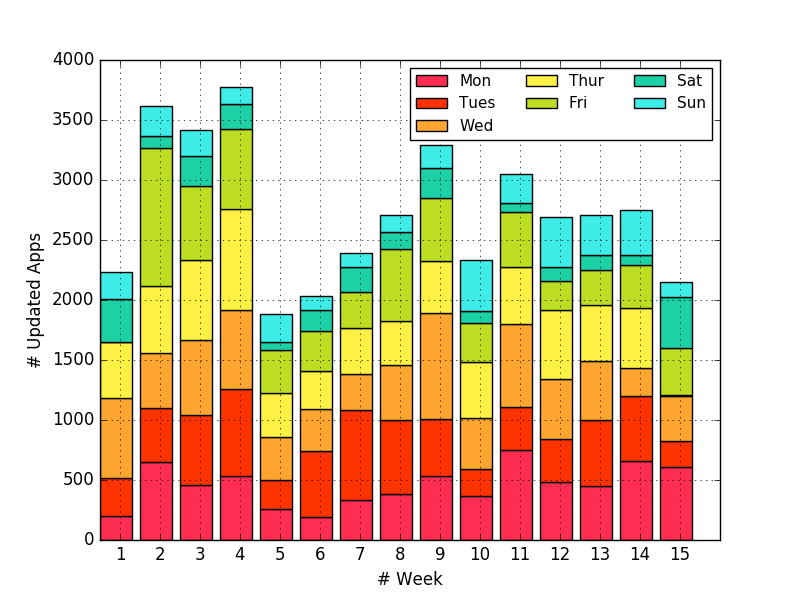
We take a first look at the data set by plotting the distribution of updates in each week. As shown in Figure 4, each bar represents a week and each part of the bar denotes number of updated apps in a day. The number of updated apps varies a lot across weeks and no obvious pattern is observed. However, within each week, we find that more apps choose to update on weekdays than weekends. Meanwhile, there are still apps choose to update on weekends in some weeks. Such observations consist with developers’ working mode. No significantly favored day is observed for developers to update their app. We infer that developers prefer releasing apps once they are ready to following a weekly schedule.
V. Update Patterns
This section studies the first research question, i.e., Is interval of update a good metric to characterize app releases?
i. Interval Distribution
In previous work, frequency is an average value calculated as the number of updates divided by number of weeks. We propose that the interval of update contains more information about the local characteristics of release behaviors. In this study, the frequency of each update is measured by the interval.
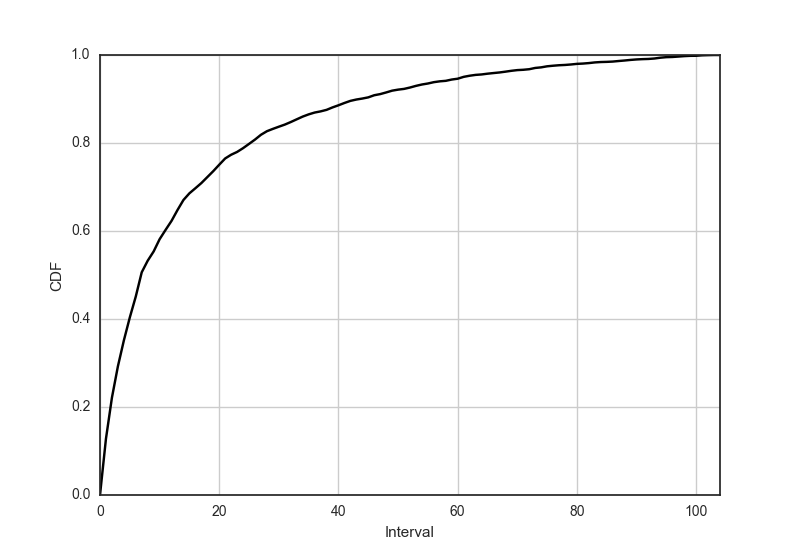
We plot the cumulative distribution function (CDF) of updates with different intervals in Figure 3. The intervals spans largely from 1 day to over 100 days, which implies the necessity of considering more metrics than average frequency. The distribution shows that 75% percent of updates have an interval of no more than 20 days. In addition, 40% of updates have an interval between 1 day to 5 days. The high proportion of successive proves that successive updates constitute a large part of all updates and motivates us to study them further. The distribution of 40% successive updates, 35% normal updates, and 35% sparse updates supports the reasonability of the categorization of update intervals in Section i.
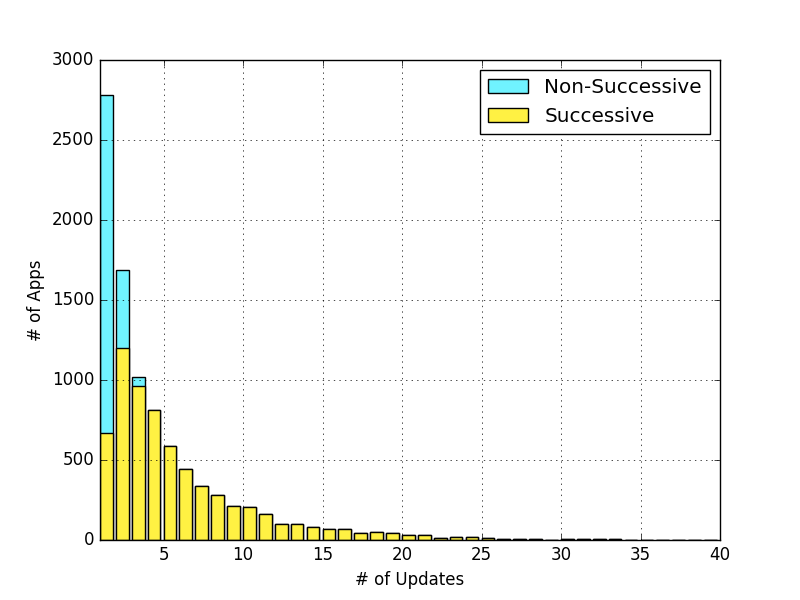
An important concern is the catholicity of successive updates in apps, given that they hold a high proportion in all updates. We present the app distribution to the number of updates it experienced in our data set. Considering that 54% of apps were not updated, we only use the 46% of apps that experienced at least one update. As Figure 4 shows, the number of apps sharply decreases when the number of updates increases. Such results implies that most apps do not update, and most of the updated apps only update for only a few times during 15 weeks.
Furthermore, approximately 56% of the updated apps experienced the successive-update pattern for at least one time, which means the update interval is less than 5 days, as Figure 4 demonstrates. The proportion is quite high and proves that successive updates occur in the updates of most apps. Additionally, a sizable subset (˜15% of the updated apps) experienced the normal-update pattern, which means an update interval less than 21 days.
Based on the general analysis, we then investigate the interval distribution of apps in different categories. By calculating the possibility of successive updates in each category, we find that apps in tools are most likely to experience successive updates, followed by apps in social category. Apps in categories such as art and medical are less likely to have successive updates.
Finding (F1): Successive updates constitute 40% of all updates in our data set, and occur in approximately 56% of the updated apps. The catholicity of successive updates motivates further study of them.
ii. Update Consistency
As we proposed, the update interval can reflect local characteristics of release behaviors. We are then curious if the update interval pattern can reveal the philosophy of developers.
To this end, we calculate the mean value and the standard deviation of update intervals for each app. The relation between the two variables is shown in Figure 5. As is observed, apps with lower mean update interval tend to have lower standard deviation of update intervals. We apply a linear regression model and find it fits well with the R-square as 0.77 and -value .
A high mean value of an app represents high possibility of having sparse updates, and a low mean value represents high possibility of having successive updates. The standard deviation indicates the possibility and extent of changing update intervals. A considerable quantity of apps are possible to have a relatively consistent release schedule as they are clustered in the down-left part of the figure. Hence, the linear relation between the two variables suggest that app developers tend to perform consistent release strategy (i.e., similar update intervals) if they release app more successively. Similarly, developers who release apps sparsely tend to choose release opportunity with quite different update intervals.

Finding (F2): Characteristics of update intervals can reflect developers’ philosophy in releasing apps. Developers favoring successive updates tend to perform releases routinely, while those favoring sparse updates are more likely to choose a random opportunity to release their apps.
iii. Local Pattern Clustering
Given that considerable apps tend to release new versions consistently, we wonder whether update behaviors show some patterns in a period. More specifically, we extract short vectors with elements from release sequences for each app, and cluster such vectors to find potential patterns.
For each update in a release sequence, we model update behaviors in the following days using a time series vector. Each element in the vector is valued as if there is an update on the corresponding day, otherwise. We then employ two standard algorithms, the t-SNE model and the Ward hierarchical method, to perform the clustering task.
The t-SNE model stands for t-distributed stochastic neighbor embedding algorithm (Maaten and Hinton (2008)), a nonlinear dimensionality reduction technique. This model is particularly well-suited for embedding high-dimensional data into a space of two or three dimensions. Specifically, it constructs a probability distribution over the high-dimensional objects in the way that similar objects have a high probability to be picked. Based on this distribution, t-SNE defines another similar probability distribution over the points in the low-dimensional map and minimizes the Kullback-Leibler divergence (Kullback and Leibler (1951)) between the two distributions with respect to the locations of the points in the map. In this way, t-SNE method could model each high-dimensional vector by a two- or three-dimensional point where similar objects are modeled by nearby points and dissimilar objects are modeled by distant points.
The Ward hierarchical method (Ward Jr (1963)) is specifically a criterion that models the cluster problem into a variance problem. Basically, this method conducts agglomerative hierarchical clustering procedure. At each step, the model chooses the pair of clusters to merge based on the minimal value of the total within-cluster variance.
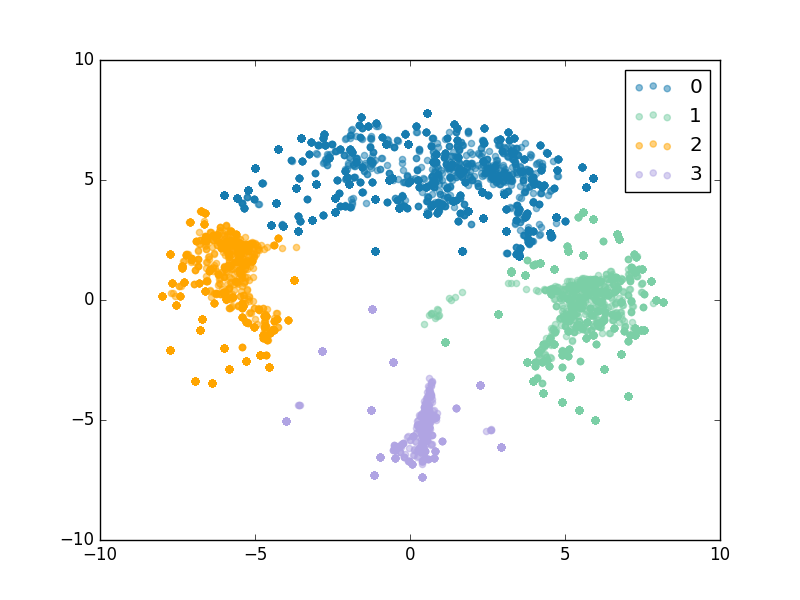
For a given sliding window of days, we first extract the time series vectors for each update. We choose the sliding window of 13 days (McIlroy et al. (2016)) and the local pattern following each update is then modeled with such vectors. Secondly, we employ the t-SNE model to embed the space of all vectors into a two-dimensional map. In this way, the similarity between update vectors keeps with dimensionality reduced. As demonstrated in Figure 6, similar vectors are modeled by nearby points and dissimilar vectors are modeled by distant points. Thirdly, to find general patterns from the embedded map, we use Ward hierarchical method to classify the points into 4 clusters. Points in different clusters are colored in Figure 6.
The clustering results implies that the update behaviors after an update present several patterns. This finding suggests a direction to study behaviors of developers, although some of them update their apps quite inconsistently.
We additionally characterize the 4 clusters by aggregating vectors in each cluster and visualize them in Figure 7. The aggregated vectors, with average values of original vectors in each cluster, present 4 distinguished release patterns. Given an update happened on day 0, the possibility of subsequent update in pattern 0 peaks on day 3 and day 7 and descends to 0 on day 13. The possibility of update in pattern 1 follows an approximately ascending trend to day 12 with a small peak on day 6. Pattern 2 shows high possibility of subsequent updates on day 2 and 3, which implies successive updates, and then the possibility descends. Pattern 3 shows significant high possibility of updates on day 13, which is a normal update in about 2 weeks, after comparatively small fluctuations. In general, developers show different preferences to performing successive updates, weekly updates, and bi-weekly updates in these 4 different release patterns.
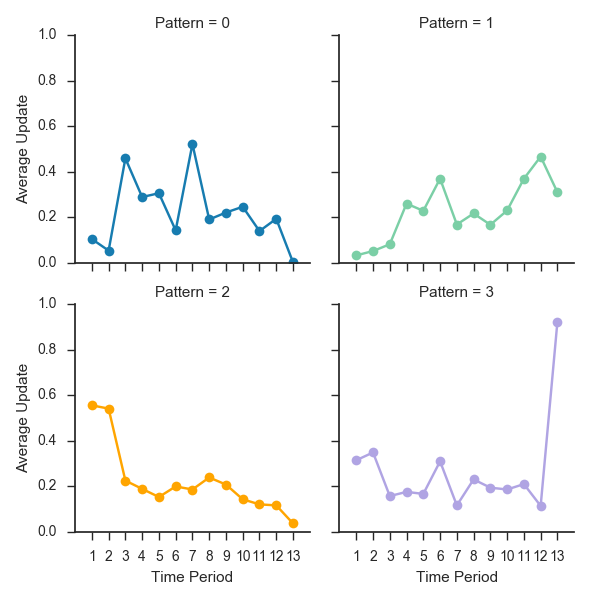
Finding (F3): Local release patterns can be detected from release behaviors after an update. With a 13-day sliding window, developers are found to present 4 general patterns, each with different preferences to performing successive updates, weekly updates, and bi-weekly updates.
VI. Update Effects
This section studies the second research question, i.e., What impacts update feedbacks?
The effect (or the user feedback) of an update should be influenced by multiple factors. We choose to measure user feedback with app rating. We propose three important factors that can affect ratings, i.e., the current ranking of the app, the rating trend of the app, and the purpose of the update. In the three update groups , i.e., successive updates, normal updates, and sparse updates, we analyze performance of the three factors respectively.
i. Ranking
Ranking of an app, which is evaluated by Google Play, reflects the relative position of the app in a category. Apps with higher rankings are often with high quality or popularity, while those with lower rankings can be more sensitive to external changes. We hypothesis that apps with different ranks achieve different feedbacks after updates.
To this end, we choose to group the updates from two dimensions. The first dimension is the update interval, and the second is the direction of app reaction which is reflected on the rating. The rating of app can increase after an update, which indicates a positive reaction. Accordingly, a negative reaction means decrease of app rating after an update. In this way, we have 6 groups of updates, i.e., successive-positive, successive-negative, normal-positive, normal-negative, sparse-positive, and sparse-negative.
We then investigate the distribution of app rankings before the update in different groups, as shown in Figure 8. Results show that the rankings are lower in the successive-positive group (median ranking=131) than those in the successive-negative group (median ranking=190). We perform Mann-Whitney U test between the rank distributions in these two update groups and witness significant difference (-value=0.001). Such a result indicates that high-ranked apps tend to get positive feedback after successive updates in comparison to lowly-ranked apps. Meanwhile, rank distributions are not significantly different between sparse-positive and sparse-negative groups (-value=0.291), or between normal-positive and normal-negative groups (-value=0.323).
The phenomenon in the ranking feedback is kind of Matthew effect that described in sociology, i.e., the rich get richer and the poor get poorer. If the update is going to be successive to its previous update, apps with high rankings are more likely to get a higher rating while those with low rankings are more likely to get a lower rating. It is reasonable because the factors of people - users’ attitudes, are important to the rating of apps. It is supported that users are sensitive to successive updates. Additionally, users may tend to believe that a successive update is necessary and beneficial to a high-ranked app, while to be annoyed for a lowly-ranked app. This is effect of accumulated advantage of apps’ performance and popularity in history.
Given such results, developers should be careful before updating their apps. For high-ranked apps, developers can choose an update frequency according to their needs. But for low-ranked apps, a conservative strategy of updating normally is suggested.
Finding (F4): App rating in response to successive updates is kind of Matthew effect. High-ranked apps tend to gain higher ratings while low-ranked apps gain lower ratings. Developers of apps with low rankings are suggested to maintain updating frequency not to be too frequent.
ii. Rating Trend
Although update feedback can be affected by accumulated advantage of apps, updating apps is a main way for developers to make their apps better, e.g., to stimulate downloads or ratings. We are curious whether an update can “save” an app by reversing or slowing down the accumulated getting-worse direction. If so, does the frequency of the updates matter to the resulted ratings?
We leverage rating trend to represent the accumulated direction of user adoption of apps, and see what happens to a descending trend after an update. We consider only the significant updates, which are the nearest update within the time-lag slot before turning points. In total 1,905 updates are detected for this study. For each turning point in the rating curve, we calculate the trends of rating before and after it. The trends are quantified with the slope of the fitted curve. The rating trend can be reversed to be increasing, or be still descending after the turning point, either slower or quicker. We then group the updates according to their effects to reversed increasing, restrained descending, and aggravated descending. It is found that 69% of updates show positive effects to apps with a descending rating trend, including 49% in reversed increasing and 20% in restrained descending. Such results prove that updates can be beneficial to apps with getting-worse ratings.
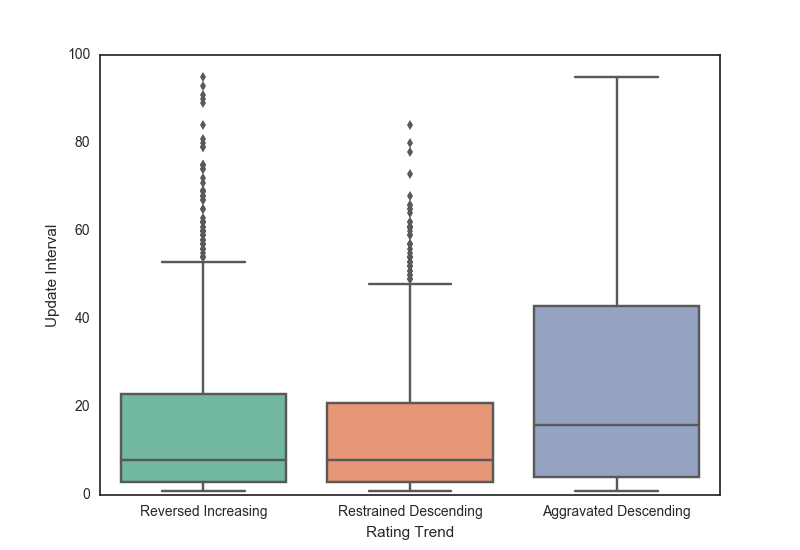
However, there are still updates related to worsening rating trends. We then move on to see why some updates have positive effects while others have negative effects. In specific, we plot the distribution of update intervals in the groups of reversed increasing, restrained descending, and aggravated descending. The median update interval in the three groups are 8, 8, and 16, respectively. As shown in Figure 9, update intervals are shorter in the first two groups than in the aggravated descending group. Such a result indicates that updates with shorter intervals are more likely to “save” an app. An example is demonstrated in Figure 1. Two apps in Figure 1 experience similar descending trends of rating. However, with more updates, the descending trend of the second app slowly restrains and finally turns into an ascending trend. Yet the trend in the first figure remains descending. We suggest developers not to hesitate to update their apps with a descending ranking trend.
Additionally, we conduct the same analysis to turning points after an increasing trend. No obvious difference of interval distribution is observed among the three corresponding rating trend groups, i.e., reversed descending, restrained increasing, and accelerated increasing.
Finding (F5): Successive updates can be helpful to apps undergoing a descending rating trend.
iii. Update Purpose
In addition to ranking and rating trend of the app, we assume that the purpose of an update is important to the feedback of the update. Bug fixing and feature adding are proved to be the most frequent terms in such release text (Martin et al. (2016)). However, the relation between update results and update purpose remains not revealed. To this end, we untangle the update feedbacks to what is updated. Considering that the frequency of updates can influence the result, we keep the updates in the three groups (i.e., successive updates, normal updates, and sparse updates) in this analysis.
Apps in Google Play use the field WhatsNew as the release text to imply the difference of the a version. We use this field of each update to extract update purpose. Note that sometimes WhatsNew is not revised with app updates (McIlroy et al. (2016)). Such updates are discarded.
Pre-processing. We perform information retrieval techniques on the text. The first step is to cast the text into lower case and filter them for punctuation and stop words using Porter stemmer (Porter (1980)). We then employ TF.IDF (Manning et al. (2008)) model to embed each text with a ‘term vector’. The trained ‘term vector’ contains 18,728 dimensions. Each dimension stands for the relative importance of the term to the text by calculating the term frequency inverse text frequency.
Term Importance. We use Lasso (Tibshirani (1996)), a standard linear-regression model, to correlate the influence of the update with update purposes. In specific, we regress the rating trend difference, i.e., slope of rating trend after the update minus that before the update, to each of the ‘top terms’. The coefficients of variables learned by Lasso indicate the importance of the corresponding features.
After performing Lasso on each group of updates, we find that the importance of terms are quite different. The terms are visualized in Figure 10 according to their importance to updates in successive and sparse groups. Each point represents a term. Terms in the left part have a negative coefficient with a sparse update, while terms in the right part positive. Similarly, terms in the lower part have a negative coefficient with a successive update, while terms in the upper part positive. We are interested in the terms in the left-upper and right-lower parts. The purpose, represented by the terms, affects the successive updates and sparse updates in different directions in these two parts.
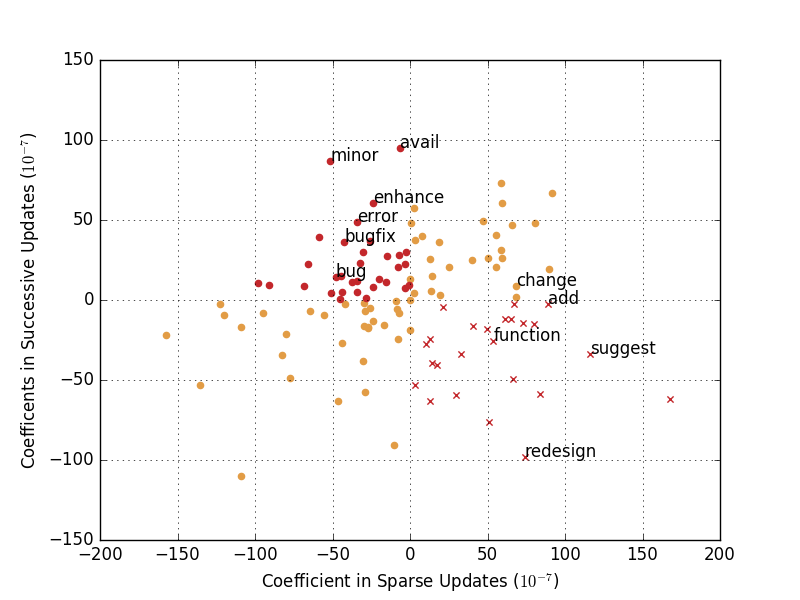
As shown in Figure 10, terms in the left-upper part are mostly about fixing bugs, such as bug, bugfix, and error. However, terms in the right-lower part are more about changing features, such as function, redesign, and add. Such results imply that influence of update purposes varies according to the frequency of update. Releasing a new version with bug fixed quickly after a version can be beneficial to an app, while changing features successively can be harmful. In contrast, changing features is more likely to be welcomed for sparsely updated apps, while fixing bugs can cause negative results.
Finding (F6): The change of rating trend after an update is related to the purpose of the update considering the release frequency. We suggest that developers should not shy away from fixing bugs by performing hotfixes, but be cautious not to change features too frequently.
VII. Update Optimization
Thus far, we have studied the roles of app ranking, rating trend, and purpose in updates of different frequency. Analysis results support that update results can be influenced by these aspects. The third research question then comes from the developers naturally - How to optimize the strategy of app release? Given the complexity of factors that can influence update results, we simplify this problem by restricting factors to the three aspects we have studied. This section introduces the approach to optimizing release opportunity in two steps.
Step 1. Modeling release effect. We employ all the aspects discussed above into a general model to demonstrate the relation between the factors and the update effect. The model applied is Multinomial Naive Bayes (Rennie et al. (2003)) (i.e., the MNB model), which implements the naive Bayes algorithm for multinomially distributed data. We choose the MNB model because it is well-suited for discrete features. The factor vector derived from discrete term importance vector and other factors can be well expressed in this way.
For clarity, let denote the effect of a focal release. We model this effect as a float variable, where the positive or negative value stands for the direction of effects. Let denote the current ranking of the corresponding app at this release, which can be directly found in Google Play. Let denote the planning update interval. Let , the slope of the previous fitted segmentation of rating curve detected by the Top-Down method, denote the previous rating trend. Let denote the importance vector of terms in the release text. The model is formulated as below:
To validate this model, we perform a 5-fold cross validation (Kohavi et al. (1995)) to predict the direction of update effect. Accuracy of this model achieves 76%. Considering that the update purpose is a relatively known factor to update effects (Martin et al. (2016)), we simplify this model by removing , and to provide a baseline. Accuracy of this baseline achieves only 54%. We then improve the baseline by adding and and can have an accuracy of 70%. The performance of our model with 76% accuracy supports the advantage of considering the app ranking, rating trend, and update interval comprehensively with update purpose.
Step 2. Optimizing release opportunity. Based on the proposed model, the task can be conducted through an optimization procedure. Given the app ranking , rating trend , and importance vector , we need to find a to maximize the effect . Formally, the optimization could be expressed as:
The output of the optimization, , suggests a best opportunity to release a new version based on the current app ranking, rating trend, and the purpose of update. However, release planning is a process of trade-off among various aspects such as market feedback, app quality, and development efforts. Hence the validation of the optimization output is out of scope of this paper. The aim of this work is to reveal the rationale of update effect by well modeling it with influential factors. Developers can combine our findings and suggestions with their knowledge from experience to pursue better update effects.
Finding (F7): Update interval with app ranking, rating trend, and update purpose can well model the effect of updates through MNB. Developers can leverage our model to optimize their release strategy.
VIII. Threats to Validity
In this section we discuss threats to construct, conclusion, and external validity in our study.
Construct Validity: The analysis performed in this study are correlation analysis but not causal analysis. Although causal analysis can provide the most directive suggestions, it is hard to imply causality from data analysis, especially for the analysis of successive updates. However, findings from our correlation analysis are reasonable and can give useful implications to developers when managing their releases.
We use three factors (i.e., app ranking, rating trend, and update purpose) in addition to update interval to study the effects of updates. However, there will always be unknown factors that are hard to capture from data. Nonetheless, we believe the method can be applied to studying effects of new factors.
Factors can change over time, thus the factors in the release opportunity prediction model should be functions of time variable. We assumed the factors to be relatively stable in the model. In the future we plan to model the factors with time series and improve the prediction model.
Conclusion Validity: The app ranking algorithm is not released by Google Play and can change over time. If the algorithm changes, the analysis results about app ranking can not directly apply.
External Validity: We believe the empirical analysis and the prediction model can give actionable suggestions to developers, although the real effect can be influenced by more factors.
The findings can not be simply applied to other app stores. Nevertheless, the methods we used in this study can be performed on data from other app stores.
IX. Related Work
This section looks at the literature related to update cycles of traditional software development, followed by prior work related to apps release engineering.
i. Software Release
In traditional software development, various work has focused on enabling short, steady and consistent release cycles. For instance, de Jonge et al. (2004) and Van Der Storm (2005) developed basic infrastructures which can automatically build, package and deploy individual code changes. These ideas in turn stir more and more advanced environments to offer the ability of running sets of unit, integration or even acceptance tests in a massively parallel way in the shorter time between releases (Downer (2012)). Humble and Farley (2010) posed the concept of continuous delivery, which uses highly automated infrastructure to deploy new releases in record time. Amazon, for example, deploys on average every 11.6 seconds (Jenkins (2011)), achieving more than 1,000 deployments per hour.
Despite all the work discussed above on pushing for shorter release cycles, empirical evidence that directly shows its improvements on product quality is lacked. Khomh et al. (2012) report that bugs are fixed faster under rapid release models, but proportionally less bugs are fixed compared to the traditional release model based on their study of release model of Firefox. Marschall (2007) found that short release cycles require a more steady flow of releases to control the number of reported bugs. Releasing too frequently not only decreases the time to run tests, but also might make customers weary of yet another update to install (Porter et al. (2006), Jansen and Brinkkemper (2006)), which is in a way the same situation in app stores.
ii. Release Engineering for Mobile Apps
Considering app stores, Martin et al. Martin et al. (2015a) introduced the concept of App Sampling Problem, a threat to validity for app store analysis due to the inherent biases associated with partial information. This threat can be ameliorated by using inferential statistical techniques and/or by carefully defining the scope of claims of apps. In this paper, we alleviate the App Sampling Problem by limiting our claims to the most consistently popular apps in each category of Google Play and the ‘significant updates’.
There has been considerable work that studies app releases which can be divided into three aspects:
Concerning about the general update behavior of app, Heitkötter et al. (2012) investigated release times and user activity in the Apple App Store, and concluded that Sunday evening was the best time for deploying games in 2011. Their study also found that version updates were an effective strategy for raising an app’s rank in the store. In 2013 Datta and Kajanan (2013) studied review counts from the Apple App Store, and found that apps received more reviews after deploying updates on Thursdays or late in the week. McIlroy et al. (2016) found that only 1% of the studied apps received more than one update per week, and only 14% were updated in a two-week period by studying update frequencies in the Google Play store after mining data of 10,713 mobile apps, the authors also indicated that rating was not affected by update frequency, which is not the same in our paper.
The second aspect is about the update purpose and its general effect with different app release patterns. Lee and Raghu (2014) studied the factors that affect an app’s likelihood of staying in the top charts in the Apple App Store in 2014 . They found that free apps are more likely to ‘survive’, and that frequent feature updates are the most important factor in ensuring their survival, along with releasing in smaller categories. In 2015 Gui et al. found from 21 apps from Google Play with frequent releases, that 23% of their releases contained ad-related changes (Gui et al. (2015)). Comino et al. (2016) studied the top 1,000 apps in Apple App Store and Google Play, finding that for iTunes, numbers of app releases were more likely to increase when the app performs badly, and that releases could boost downloads.
The last is about the causal effect of app release. Martin et al. (2015b) conducted a longitudinal study on 1,033 apps mined from Google Play and Windows Phone Store over a 12 month time period. The authors used causal inference to identify the releases with most impact on ratings and downloads. However, the releases actually used in the causal effect analysis are limited to those who have no releases within 3 weeks before or after them. Most of the studies use correlation analysis. For example, the findings of Guerrouj et al. (2015) indicate that high code churn in releases correlates with lower ratings.
All of these previous findings on app releases tantalizingly aim at the possibility that whether certain releases may have higher impact than others. In fact, the situation of developers is totally a different story. When a new version of an app is about to release, the current condition of the app is known, and the last thing for the developers to decide is when to perform the release considering the update purpose.
X. Conclusion
In this work we propose an approach to optimizing release strategy for apps in Google Play. In particular, we use update interval instead of average frequency to characterize release patterns and find influential factors using 41,028 Google Play app releases during 105 days, for all apps that appear on the top lists of 33 categories. For these apps, we found that the update intervals are informative to reveal release patterns. App ranking, rating trend, and update purpose all play a role in affecting the update results. High-ranked apps tend to achieve higher ratings after a successive update while low-ranked apps tend to achieve lower ratings; a successive update can be helpful to reverse a descending trend of app rating; bug fixing is more welcomed in successive updates while feature changing have more positive feedback in sparse updates. We have shown that a Multinomial Naive Bayes model can well describe the update effects and the factors. Optimized update interval from this model suggests developers to improve their release strategy. In the future we plan to combine our previous work on user management analysis (Li et al. (2015b, a); Lu et al. (2016); Liu et al. (2017a, b)) with this work to develop the release-pattern analytic tool, and provide it as a web service (Ma et al. (2013); Wang et al. (2012); Liu et al. (2014); Liu et al. (2015); Liu et al. (2009); Ma et al. (2015)).
References
- (1)
- Chua and Deng (1986) La Chua and An-Chang Deng. 1986. Canonical Piecewise-Linear Modeling. IEEE Transactions on Circuits and Systems 33, 5 (1986), 511–525.
- Comino et al. (2015) Stefano Comino, Fabio M Manenti, and Franco Mariuzzo. 2015. Updates Management in Mobile Applications. iTunes vs Google Play. Centre for Competition Policy (CCP) Working Paper (2015).
- Comino et al. (2016) Stefano Comino, Fabio M Manenti, and Franco Mariuzzo. 2016. Updates Management in Mobile Applications. iTunes vs Google Play. (2016).
- Datta and Kajanan (2013) Diya Datta and Sangaralingam Kajanan. 2013. Do App Launch Times Impact Their Subsequent Commercial Success? An Analytical Approach. In International Conference on Cloud Computing and Big Data, CloudCom-Asia 2013. 205–210.
- De Boor et al. (1978) Carl De Boor, Carl De Boor, Etats-Unis Mathématicien, Carl De Boor, and Carl De Boor. 1978. A Practical Guide to Splines. Vol. 27.
- de Jonge et al. (2004) M de Jonge, E Visser, et al. 2004. Nix: A Safe and Policy-Free System for Software Deployment. UU WINFI Informatica en Informatiekunde (2004), 79–92.
- Downer (2012) T Downer. 2012. Some Clarification and Musings. Accessed on January 6 (2012).
- Ge and Smyth (2001) Xianping Ge and Padhraic Smyth. 2001. Segmental Semi-Markov Models for Endpoint Detection in Plasma Etching. IEEE Transactions on Semiconductor Engineering 259 (2001), 201–209.
- Guerrouj et al. (2015) Latifa Guerrouj, Shams Azad, and Peter C Rigby. 2015. The Influence of App Churn on App Success and Stackoverflow Discussions. In Proceedings of the 22nd IEEE International Conference on Software Analysis, Evolution and Reengineering, SANER 2015. 321–330.
- Gui et al. (2015) Jiaping Gui, S Mcilroy, M Nagappan, and W. G. J Halfond. 2015. Truth in Advertising: The Hidden Cost of Mobile Ads for Software Developers. In IEEE/ACM IEEE International Conference on Software Engineering, ICSE 2015. 100–110.
- Heitkötter et al. (2012) Henning Heitkötter, Sebastian Hanschke, and Tim A Majchrzak. 2012. Evaluating Cross-Platform Development Approaches for Mobile Applications. In International Conference on Web Information Systems and Technologies. 120–138.
- Humble and Farley (2010) Jez Humble and David Farley. 2010. Continuous Delivery: Reliable Software Releases through Build, Test, and Deployment Automation (Adobe Reader).
- Jansen and Brinkkemper (2006) Slinger Jansen and Sjaak Brinkkemper. 2006. Ten Misconceptions about Product Software Release Management Explained Using Update Cost/Value Functions. In International Workshop on Software Product Management, IWSPM 2006. 44–50.
- Jenkins (2011) J Jenkins. 2011. Velocity Culture (the Unmet Challenge in Ops). In Presentation at O’Reilly Velocity Conference.
- Khomh et al. (2012) Foutse Khomh, Tejinder Dhaliwal, Ying Zou, and Bram Adams. 2012. Do Faster Releases Improve Software Quality?: An Empirical Case Study of Mozilla Firefox. In Proceedings of the 9th IEEE Working Conference on Mining Software Repositories, MSR 2012. 179–188.
- Kohavi et al. (1995) Ron Kohavi et al. 1995. A Study of Cross-Validation and Bootstrap for Accuracy Estimation and Model Selection. Ijcai 14, 2 (1995), 1137–1145.
- Kullback and Leibler (1951) Solomon Kullback and Richard A Leibler. 1951. On Information and Sufficiency. The Annals of Mathematical Statistics 22, 1 (1951), 79–86.
- Lee and Raghu (2014) Gunwoong Lee and T Santanam Raghu. 2014. Determinants of Mobile Apps’ Success: Evidence from the App Store Market. Journal of Management Information Systems 31, 2 (2014), 133–170.
- Lee Rodgers and Nicewander (1988) Joseph Lee Rodgers and W Alan Nicewander. 1988. Thirteen Ways to Look at the Correlation Coefficient. The American Statistician 42, 1 (1988), 59–66.
- Li et al. (2015a) Huoran Li, Xuanzhe Liu, Wei Ai, Qiaozhu Mei, and Feng Feng. 2015a. A Descriptive Analysis of a Large-Scale Collection of App Management Activities. In Proceedings of the 24th International Conference on World Wide Web Companion, WWW 2015, Florence, Italy, May 18-22, 2015 - Companion Volume. 61–62.
- Li et al. (2015b) Huoran Li, Xuan Lu, Xuanzhe Liu, Tao Xie, Kaigui Bian, Felix Xiaozhu Lin, Qiaozhu Mei, and Feng Feng. 2015b. Characterizing Smartphone Usage Patterns from Millions of Android Users. In Proceedings of the 2015 ACM Internet Measurement Conference, IMC 2015, Tokyo, Japan, October 28-30, 2015. 459–472.
- Liu et al. (2017a) Xuanzhe Liu, Wei Ai, Huoran Li, Jian Tang, Gang Huang, Feng Feng, and Qiaozhu Mei. 2017a. Deriving User Preferences of Mobile Apps from Their Management Activities. ACM Transactions on Information Systems (TOIS) 35, 4 (2017), 39.
- Liu et al. (2009) Xuanzhe Liu, Gang Huang, and Hong Mei. 2009. Discovering Homogeneous Web Service Community in the User-Centric Web Environment. IEEE Transactions on Services Computing 2, 2 (2009), 167–181.
- Liu et al. (2014) Xuanzhe Liu, Gang Huang, Qi Zhao, Hong Mei, and M. Brian Blake. 2014. iMashup: A Mashup-Based Framework for Service Composition. SCIENCE CHINA Information Sciences 57, 1 (2014), 1–20.
- Liu et al. (2017b) Xuanzhe Liu, Huoran Li, Xuan Lu, Tao Xie, Qiaozhu Mei, Hong Mei, and Feng Feng. 2017b. Understanding Diverse Smartphone Usage Patterns from Large-Scale Appstore-Service Profiles. IEEE Transactions on Software Engineering (2017), Accepted to appear.
- Liu et al. (2015) Yi Liu, Xuanzhe Liu, Yun Ma, Yunxin Liu, Zibin Zheng, Gang Huang, and M. Brian Blake. 2015. Characterizing RESTful Web Services Usage on Smartphones: A Tale of Native Apps and Web Apps. In 2015 IEEE International Conference on Web Services, ICWS 2015, New York, NY, USA, June 27 - July 2, 2015. 337–344.
- Lu et al. (2017) Xuan Lu, Zhenpeng Chen, Xuanzhe Liu, Huoran Li, Tao Xie, and Qiaozhu Mei. 2017. PRADO: Predicting App Adoption by Learning the Correlation between Developer-Controllable Properties and User Behaviors. In Proceedings of the 2017 ACM International Joint Conference on Pervasive and Ubiquitous Computing, UbiComp 2017). to appear.
- Lu et al. (2016) Xuan Lu, Xuanzhe Liu, Huoran Li, Tao Xie, Qiaozhu Mei, Dan Hao, Gang Huang, and Feng Feng. 2016. PRADA: Prioritizing Android Devices for Apps by Mining Large-Scale Usage Data. In Proceedings of the 38th International Conference on Software Engineering, ICSE 2016, Austin, TX, USA, May 14-22, 2016. 3–13.
- Ma et al. (2013) Yun Ma, Xuanzhe Liu, Yihan Wu, and Paul Grace. 2013. Model-Based Management of Service Composition. In Seventh IEEE International Symposium on Service-Oriented System Engineering, SOSE 2013, San Francisco, CA, USA, March 25-28, 2013. 103–112.
- Ma et al. (2015) Yun Ma, Xuanzhe Liu, Meihua Yu, Yunxin Liu, Qiaozhu Mei, and Feng Feng. 2015. Mash Droid: An Approach to Mobile-Oriented Dynamic Services Discovery and Composition by In-App Search. In 2015 IEEE International Conference on Web Services, ICWS 2015, New York, NY, USA, June 27 - July 2, 2015. 725–730.
- Maaten and Hinton (2008) Laurens van der Maaten and Geoffrey Hinton. 2008. Visualizing Data Using t-SNE. Journal of Machine Learning Research 9, Nov (2008), 2579–2605.
- Manning et al. (2008) Christopher D Manning, Prabhakar Raghavan, and Hinrich Schütze. 2008. Scoring, Term Weighting and the Vector Space Model. Introduction to information retrieval 100 (2008), 2–4.
- Marschall (2007) Matthias Marschall. 2007. Transforming A Six Month Release Cycle to Continuous Flow. In Agile Conference, AGILE 2007. 395–400.
- Martin et al. (2015a) William Martin, Mark Harman, Yue Jia, Federica Sarro, and Yuanyuan Zhang. 2015a. The App Sampling Problem for App Store Mining. In IEEE/ACM 12th Working Conference on Mining Software Repositories, MSR 2015. 123–133.
- Martin et al. (2015b) William Martin, Federica Sarro, and Mark Harman. 2015b. Causal Impact Analysis Applied to App Releases in Google Play and Windows Phone Store. RN 15 (2015), 07.
- Martin et al. (2016) William Martin, Federica Sarro, and Mark Harman. 2016. Causal Impact Analysis for App Releases in Google Play. In Proceedings of the 24th ACM SIGSOFT International Symposium on Foundations of Software Engineering, FSE 2016. 435–446.
- McIlroy et al. (2016) Stuart McIlroy, Nasir Ali, and Ahmed E Hassan. 2016. Fresh Apps: An Empirical Study of Frequently-Updated Mobile Apps in the Google Play Store. Empirical Software Engineering 21, 3 (2016), 1346–1370.
- Nayebi et al. (2016) M Nayebi, B Adams, and G Ruhe. 2016. Mobile App Releases–A Survey Research on Developers and Users Perception. In Proceedings of the 23rd IEEE International Conference on Software Analysis, Evolution and Reengineering, SANER 2016.
- Porter et al. (2006) Adam Porter, Cemal Yilmaz, Atif M Memon, Arvind S Krishna, Douglas C Schmidt, and Aniruddha Gokhale. 2006. Techniques and Processes for Improving the Quality and Performance of Open-Source Software. Software Process: Improvement and Practice 11, 2 (2006), 163–176.
- Porter (1980) Martin F Porter. 1980. An Algorithm for Suffix Stripping. Program 14, 3 (1980), 130–137.
- Rennie et al. (2003) Jason D Rennie, Lawrence Shih, Jaime Teevan, and David R Karger. 2003. Tackling the Poor Assumptions of Naive Bayes Text Classifiers. In Proceedings of the 20th International Conference on Machine Learning, ICML 2003. 616–623.
- Ruiz et al. (2012) Eduardo J Ruiz, Vagelis Hristidis, Carlos Castillo, Aristides Gionis, and Alejandro Jaimes. 2012. Correlating Financial Time Series with Micro-blogging Activity. In Proceedings of the Fifth ACM International Conference on Web Search and Data Mining. 513–522.
- Ruiz et al. (2016) Israel J Mojica Ruiz, Meiyappan Nagappan, Bram Adams, Thorsten Berger, Steffen Dienst, and Ahmed E Hassan. 2016. Examining the Rating System Used in Mobile-App Stores. IEEE Software 33, 6 (2016), 86–92.
- Sugiura and Ogden (1994) N Sugiura and RT Ogden. 1994. Testing Change-Points with Linear Trend. Communications in Statistics-Simulation and Computation 23, 2 (1994), 287–322.
- Tibshirani (1996) Robert Tibshirani. 1996. Regression Shrinkage and Selection via the Lasso. Journal of the Royal Statistical Society. Series B (Methodological) 58, 1 (1996), 267–288.
- Van Der Storm (2005) Tijs Van Der Storm. 2005. Continuous Release and Upgrade of Component-Based Software. In Proceedings of the 12th International Workshop on Software Configuration Management. 43–57.
- Wang et al. (2012) Xudong Wang, Xuanzhe Liu, Ying Zhang, and Gang Huang. 2012. Migration and Execution of JavaScript Applications between Mobile Devices and Cloud. In Conference on Systems, Programming, and Applications: Software for Humanity, SPLASH ’12, Tucson, AZ, USA, October 21-25, 2012. 83–84.
- Ward Jr (1963) Joe H Ward Jr. 1963. Hierarchical Grouping to Optimize an Objective Function. Journal of the American statistical association 58, 301 (1963), 236–244.
- Wilkinson (1999) Leland Wilkinson. 1999. Statistical Methods in Psychology Journals: Guidelines and Explanations. American psychologist 54, 8 (1999), 594.