Magnetism and charge density waves in RNiC2 (R = Ce, Pr, Nd)
Abstract
We have compared the magnetic, transport, galvanomagnetic and specific heat properties of CeNiC2, PrNiC2 and NdNiC2 to study the interplay between charge density waves and magnetism in these compounds. The negative magnetoresistance in NdNiC2 is discussed in terms of the partial destruction of charge density waves and an irreversible phase transition stabilized by the field induced ferromagnetic transformation is reported. For PrNiC2 we demonstrate that the magnetic field initially weakens the CDW state, due to the Zeeman splitting of conduction bands. However, the Fermi surface nesting is enhanced at a temperature related to the magnetic anomaly.
I introduction
The interaction between charge density waves (CDW) and different types of orderings such as superconductivity Chang et al. (2012); da Silva Neto et al. (2014); Chang et al. (2016), spin density waves Fawcett (1988); Jacques et al. (2016); Young and Sokoloff (1974) and magnetismBalseiro et al. (1980) has been a long standing area of interest. Magnetic order or applied magnetic field have been found to impact the CDW state through changing the geometry of the Fermi surface (FS). The effect can be destructive due to the disturbance of the FS nesting caused by the magnetic field-induced splitting of the conduction bands or modification of the electronic structure due to a magnetic transition Tiedje et al. (1975). Alternatively, a constructive effect has been observed in a group of materials, in which this FS transformation leads to the enhancement of the nesting conditions or when the nesting vector has the ability to adapt to the evolution of the Fermi surfaceBrooks et al. (2006); Wang et al. (2014); Andres et al. (2011); Zanchi et al. (1996); Graf et al. (2004a); Winter et al. (2013); Murata et al. (2015). Recently, much attention of the researchers exploring the coupling between CDW, superconductivity and magnetic order has been devoted to the two families of ternary compounds: M5Ir4Si10, (where M = Y, Dy, Ho, Er, Tm, Yb or Lu )Lalngilneia et al. (2015); van Smaalen et al. (2004); Galli et al. (2000, 2002); Hossain et al. (2005); Leroux et al. (2013); Singh et al. (2004); Sangeetha et al. (2012); Kuo et al. (2006) and RNiC2, (where R = La, Ce, Pr, Nd, Sm, Gd or Tb)Kim et al. (2013); Prathiba et al. (2016). Most of the members of the latter family exhibit the Peierls transitions towards the charge density wave state Murase et al. (2004). The relevance of a Peierls instability has been confirmed for R = Gd, Tb, Nd, Pr and Sm, while the LaNiC2 and CeNiC2 compounds do not show any anomalies that could be attributed to CDW Yamamoto et al. (2013); Laverock et al. (2009); Ahmad et al. (2015); Shimomura et al. (2016); Wölfel et al. (2010). Instead, LaNiC2 is an unconventional noncentrosymmetric superconductor with = 2.7 K Lee et al. (1996); Pecharsky et al. (1998); Wiendlocha et al. (2016). Next to the CDW, the members of the RNiC2 family show a wide range of magnetic orderings originating from the RKKY interaction between local magnetic moments and conduction electrons Schäfer et al. (1997); Kotsanidis et al. (1989). The ground state of RNiC2 depends on the rare-earth atom marked in the above formula by R: CeNiC2, NdNiC2, GdNiC2 and TbNiC2 show the antiferromagnetic character Bhattacharyya et al. (2014); Yakinthos et al. (1990); Hanasaki et al. (2011); Uchida et al. (1995); Matsuo et al. (1996); Pecharsky et al. (1998), SmNiC2 is a ferromagnet, while the PrNiC2 compound has been identified as a van Vleck paramagnet Onodera et al. (1998). This rich variety of the types of magnetic ordering shown by the RNiC2 family members motivated us to explore the interplay of charge density waves and various magnetic ground states. Here, we compare the physical properties of three isostructural, yet highly dissimilar compounds: NdNiC2, PrNiC2 and CeNiC2. The first compound, NdNiC2 shows the Peierls instability with = 121 K and antiferromagnetic ordering with = 17 K. The second, PrNiC2 undergoes the CDW transition at = 89 K and instead of long range magnetic ordering, shows a magnetic anomaly at = 8 K. The last compound, CeNiC2 becomes an antiferromagnet at = 20 K and does not exhibit the CDW transition.
II experimental details
The polycrystalline samples of RNiC2 (where R = Ce, Pr, and Nd) were synthesized by arc-melting the stoichiometric amounts of pure elements: Ni (4N), C (5N) and Ce (3N), Pr (3N), Nd (3N) in a high purity argon atmosphere. Small excess of Ce, Pr, Nd () and C () was used to compensate the loss during arc-melting. To obtain good homogeneity of samples, the specimens were turned over and remelted four times in a water-cooled copper hearth. A zirconium button was used as an oxygen getter. The buttons obtained from the arc-melting process were wrapped in tantalum foil, placed in evacuated quartz tubes, annealed at 900oC for 12 days and cooled down to the room temperature by quenching in cold water. Overall mass loss after the melting and annealing processes were negligible ().
The low temperature experiments were performed with a Quantum Design physical properties measurements system (PPMS) allowing for the application of a magnetic field as large as 9 T. Thin Pt wires ( = 37 m) serving as electrical contacts for transport and Hall measurements were spark-welded to the polished sample surface. A standard four-probe contact configuration was used to measure resistivity. A magnetic field was applied perpendicularly to the current direction. The Hall voltage was collected in reversal directions of magnetic field in order to remove the parasitic longitudinal magnetoresistance voltage due to misalignment of electrical contacts. The specific heat measurements were performed using the dual slope method on flat polished samples. Magnetization measurements were carried out using the ACMS susceptometry option of the PPMS system. Pieces of the samples were fixed in standard polyethylene straw holders.
III Results and discussion
The phase composition and crystallographic structure of the samples were checked by powder X-ray diffraction (pXRD) at room temperature. The pXRD analysis shows that all observed peaks for NdNiC2 and PrNiC2 are successfully indexed in the orthorhombic CeNiC2-type structureMatsuo et al. (1996) with a space group Amm2 (# 38), which confirms the phase purity of the obtained samples. Only for the CeNiC2 sample, additional reflections corresponding to a small amount of the secondary phaseSakai et al. (1980) CeC2 are observed. The lattice parameters were determined from the LeBail profile refinements of the pXRD patterns carried out using FULLPROF softwareRodríguez-Carvajal (1993). The obtained values of the lattice constants, shown in Table 1 are in good agreement with those reported in the literature Motoya et al. (1997); Yakinthos et al. (1990); Onodera et al. (1998); Schäfer et al. (1992).
| CeNiC2 | PrNiC2 | NdNiC2 | |
|---|---|---|---|
| a (Å) | 3.8753(2) | 3.8239(5) | 3.7834(1) |
| b (Å) | 4.5477(2) | 4.5428(8) | 4.5361(1) |
| c (Å) | 6.1601(3) | 6.1448(1) | 6.1285(1) |
| V (Å3) | 108.565(8) | 106.746(3) | 105.178(3) |
| Rp | 12.3 | 7.51 | 8.35 |
| Rwp | 16.5 | 10.1 | 10.8 |
| Rexp | 11.49 | 7.54 | 7.7 |
| 2.05 | 1.81 | 1.96 |
.
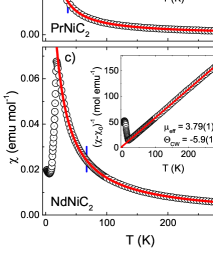
The temperature dependence of the magnetic susceptibility () measured at 1 T applied magnetic field is presented in Figure 1. All three compounds show paramagnetic behavior at high temperatures. The data were fitted using the modified Curie-Weiss expression:
| (1) |
where is the Curie constant, is the Curie-Weiss temperature, and is the temperature-independent susceptibility resulting from both sample (Pauli and Van Vleck paramagnetism, Landau diamagnetism) and sample holder (small diamagnetic contribution of sample straw assembly). Having estimated the parameter and assuming that the magnetic moment originates from ions only, one can calculate the effective magnetic moment using the relation shown in Equation 2:
| (2) |
where is the Boltzmann constant, is the Bohr magneton, and is Avogadro’s number. The resulting effective magnetic moments of CeNiC2, PrNiC2 and NdNiC2 are consistent with the values expected for free ionsJensen and Mackintosh (1991). The negative sign of obtained for the Ce- and Nd-bearing compounds (-26 K and -5.9 K, respectively) indicate an effectively antiferromagnetic coupling between the magnetic moments. In the case of PrNiC2, the absolute value of is close to 0 suggesting the weakness or absence of magnetic interactions down to 2 K.
It is worth noting that the measured susceptibility of PrNiC2 is well reproduced by the modified Curie-Weiss equation, yielding reasonable values of , , and and suggesting that the contribution of Pr3+ local moments is the dominant part of magnetic susceptibility above 35 K. The Van Vleck paramagnetic contribution reported by Onodera et al. Onodera et al. (1998) is in our case well modeled by the temperature-independent term .
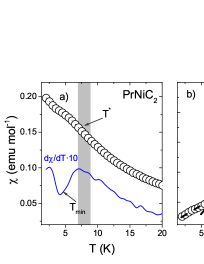
Upon crossing the Néel temperature = 17 K, the magnetic susceptibility of NdNiC2 drops rapidly. A similar drop, yet much less pronounced, is seen also in CeNiC2 below = 19 K. The susceptibility of PrNiC2 shows no clear sign of a magnetic transition above 2 K, in agreement with previous reports Kotsanidis et al. (1989); Onodera et al. (1998), however a small kink in the curve is seen at 8 K (see Fig. 3), consistent with the decrease in magnetization along the a crystallographic axis seen at this temperature by Onodera et al. Onodera et al. (1998)). The underlying cause for this magnetization anomaly is not clear, but may suggest some type of electronic or crystal structure transition, resulting in the decrease of Pauli or Van Vleck paramagnetic susceptibility.
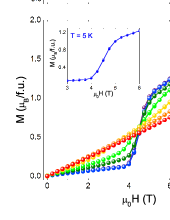
Magnetization vs. applied field () for CeNiC2, PrNiC2, and NdNiC2 is presented in Figure 2. For CeNiC2 (Fig. 2a) the magnetization is linear above , with an upturn developing above approx. 4 T in the lower temperatures. Below the second transition temperature ( = 7 K) hysteresis is observed in . Even at 9 T applied magnetic field, the magnetization reaches only 0.27 which is ca. 13 of the expected saturation magnetization for Ce3+ ion = 2.14 (where is the Lande -factor, and is the total angular momentum)Jensen and Mackintosh (1991). The magnetization at 2 K and 9 T for CeNiC2 is however approximately half of the observed saturation moment for a pure Ce metal which is only 0.6Jensen and Mackintosh (1991).
For PrNiC2, is roughly linear up to 9 T applied field at temperatures above 40 K (see Fig. 2b), below which the curves start to slightly deviate from linearity. At 10 K and below (Inset of Fig. 2b) the deviation is more pronounced and the curves start to saturate. At 2 K and 9 T applied field the of PrNiC2 reach approx. 1.5 , which is half of the expected saturation magnetization for Pr3+ ion = 3.20 Jensen and Mackintosh (1991).
In case of NdNiC2, the magnetization curves are linear down to 20 K (Fig. 2c and d). Below the the () is strongly suppressed, but above 4 T a sudden upturn is observed, resulting from field-induced magnetic order-order transition that reduces the AFM compensation of local moments. Similar transitions have been previously observed in GdNiC2 Kolincio et al. (2016a). Above the transition the curves start to saturate, reaching 1.6 in 9 T at 2 K, about one half the saturation magnetization for Gd ion ( = 3.27 Jensen and Mackintosh (1991)). The magnetization loop shows no trace of hysteresis at the AFM-FM transition as it is presented in the inset of Fig. 2c.
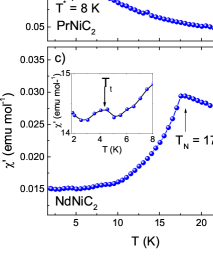
The real part of the ac magnetic susceptibility of CeNiC2 and NdNiC2 shows a drop at the Néel temperature of 19 and 17 K, respectively (see Fig. 4a,c), in agreement with previous reports Onodera et al. (1998). Below both compounds undergo further magnetic transitions. In CeNiC2 a sudden drop of susceptibility is seen at = 7 K followed by a pronounced upturn. The change in magnetic order below 10 K was previously observed by magnetization, specific heat and NMR measurementsMotoya et al. (1997); Onodera et al. (1998). An additional small upturn around 29 K results from the presence of a minor quantity of the antiferromagnetic CeC2 impurity phaseSakai et al. (1980) ( = 30 K), observed in XRD measurements. In NdNiC2 a small feature is seen around 4 K (see the inset of Fig. 4c) that was reported by Onodera et al.Onodera et al. (1998). The ac susceptibility of PrNiC2 shows no clear sign of magnetic transition, however the slightly saturating dependency of and its derivative resembles the results obtained for the Pb2Sr2PrCu3O8 compound in which a quasi-2D magnetic order is observed below 7 K as evidenced by neutron diffraction study Hsieh et al. (1994). In the aforementioned case the ac susceptibility show a saturation below the ordering temperature rather than a pronounced drop while the differential exhibit a minimum at the ordering temperature. In our case there is no clear minimum of the differential curve, yet it would be necessary to perform a neutron diffraction measurement in order to confirm or deny the presence of long-range magnetic order below the .
In contrast with CeNiC2 and NdNiC2, PrNiC2 does not reveal any clear magnetic transition. Since the three compounds are chemically similar, the discrepancy arises likely from the difference in the detailed structure of 4f energy levels. The ground state of a free Pr3+ ion is ninefold degenerate with total angular momentum = 4. The crystalline electric field (CEF) acting on the Pr3+ removes the degeneracy (either fully or partially), with the nature of the effect dependent on the point symmetry of the ion crystallographic position. In the orthorhombic PrNiC2 the site occupied by a Pr atom has the point symmetry group . For such relatively low symmetry one would expect a complete uplifting of the ground state degeneracy, yielding a nonmagnetic configuration with 9 separated singlet states similarly as in PrNi2Al5Akamaru et al. (2001). Note however that in the case of exchange interaction energy exceeding the first CEF excitation, the magnetic order may appear due to the intermixing of higher energy states into a ground state with higher degeneracySnyman and Strydom (2013). Such situation occurs in the orthorhombic PrNiGe2 compound crystallizing in the CeNiSi2-type structure (related to CeNiC2) in which the Pr3+ ion position has the same point symmetry as in PrNiC2, yet the material reveals ferromagnetic (FM) ordering at = 13 KGil et al. (1994); Snyman and Strydom (2013).
Figure 5a, b and c, shows the thermal dependencies of electrical resistivity () measured without and with applied magnetic field (9 T), for CeNiC2, PrNiC2 and NdNiC2 respectively. At high temperatures, all the compounds exhibit typical metallic behavior with resistivity deceasing with temperature lowering. Upon cooling, of both PrNiC2 and NdNiC2 show the anomalies pronounced by a minimum followed by a hump. This metal-metal transition is a typical signature of the charge density wave state with incomplete Fermi surface nesting, characteristic for quasi-2D materials Kolincio et al. (2016b). The temperature of this anomaly corresponds to the Peierls temperature ( = 121 K for NdNiC2 and = 89 K for PrNiC2) established by X-ray diffuse scatteringYamamoto et al. (2013). In contrast to that, no CDW-like anomaly is observed in the third compound, CeNiC2. At the magnetic crossover temperatures, all three curves exhibit a decrease in resistivity, shown closer in the insets of Figure 5. This downturn is visibly sharper for the antiferromagnetic ground states of NdNiC2 and CeNiC2 than in the case of PrNiC2, where instead of a long range of magnetic ordering, one observes a small magnetic anomaly at .
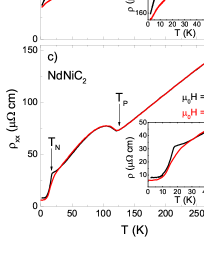
Although the anomalies in the zero field resistivity have been reported beforehandMurase et al. (2004), the influence of magnetic field on transport properties, up to now, has been studied solely for the Nd-bearing compoundYamamoto et al. (2013); Lei et al. (2017). Electrical resistivity measured in the presence of a magnetic field of = 9 T is shown as a red line in Figure 5, a b and c. The influence of magnetic field on in the high temperature metallic state of each compound is negligibly small. In CeNiC2, this behavior is present down to the vicinity of , where the magnetic field weakly modifies the resistivity. This is in contrast to the features seen in the two compounds exhibiting the charge density waves; in NdNiC2 one observes a notable decrease in resistance with magnetic field at . In PrNiC2 the onset of the negative magnetoresistance can be observed at 60 K, much closer to than in NdNiC2. To investigate further the impact of on transport properties of studied compounds we have performed the field sweeps at constant temperatures.
The magnetic field dependence of magnetoresistance (MR = , where is the zero field resistivity) of CeNiC2 is depicted in Figure 6a. At , MR is weak and negative (resistivity decreases by a maximum of 3%). Below this temperature, the magnetoresistance changes its sign and magnitude. This is a typical picture of the modification of the scattering rate in the vicinity of the magnetic ordering temperatureUsami (1978); Mazumdar et al. (1997); YAMADA and TAKADA (1972); above the reduction of resistance can be attributed to the field induced ordering of the local magnetic moments, resulting in the quenching of the spin fluctuations and effectively a decrease of the related scattering mechanism. On the other side of the transition, below , the magnetic field induces a partial reorientation of the local spins and perturbs the antiferromagnetic order, which results in the increase of the scattering rate and, consequently, of the electrical resistance.
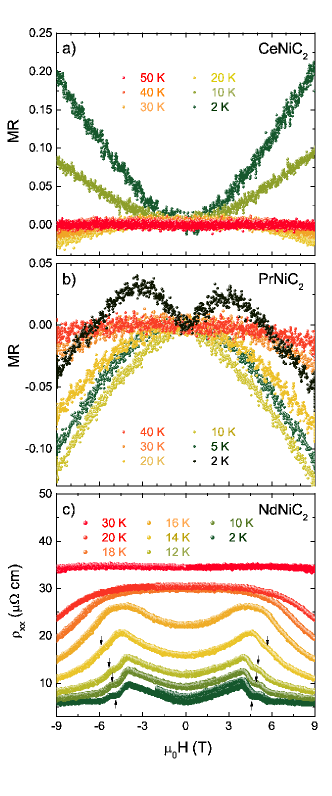
Figure 6b shows the magnetic field dependence of magnetoresistance of PrNiC2. One can notice that, in the charge density wave state, MR is dominated by the negative component which rises as temperature decreases down to . Below this temperature limit, the negative MR decreases and finally at = 2 K a positive term can be observed at low magnetic field. This positive MR component can originate from an onset of another magnetic-like transition at lower temperatures or from the light carriers related to the small Fermi surface pockets that can be opened in the FS due to imperfect nesting. A complementary experiment, such as ARPES spectroscopy, neutron diffraction or magnetotransport measurements performed at temperatures below 1.9 K and higher field would be required to clarify this point. Figure 6c shows the magnetic field dependence of resistivity of NdNiC2. Due to the rich variety of positive and negative MR components seen in this compound, we find it more clear to use the instead of MR(H) for discussion of the magnetotransport properties in NdNiC2. At 30 K, one observes an onset of the negative magnetoresistance term, which becomes stronger as temperature decreases. Below , the resistivity firstly rises with magnetic field and after reaching the maximum, the decreases again. The position of the resistivity maximum at various temperatures below corresponds to the magnetic field induced ferromagnetic transition according to the - phase diagram of NdNiC2 constructed for a single crystal Onodera et al. (1998). Below 14 K, one observes an additional kink (marked in Fig. 6 by arrows) on the decreasing side of resistance. This can be attributed to the intermediate magnetic phase separating the AFM and FM orders at this temperature range. In addition, one can notice that at the lowest temperatures the resistivity saturates at high magnetic fields. The negative magnetoresistance in NdNiC2 has been attributedYamamoto et al. (2013); Lei et al. (2017) both to the suppression of spin disorder scattering and to the destruction of the charge density wave as seen in the isostructural, albeit ferromagnetic compound, SmNiC2 in which the relevance of the CDW suppression has been confirmed by the X-ray diffuse scattering experiment performed in magnetic fieldShimomura et al. (2009); Hanasaki et al. (2012).
An interesting observation is the irreversible behavior of the electrical resistivity at low temperatures. In order to prove that this effect is not an artifact caused by unstable electrical contacts and is intrinsic to the sample, we have repeated the measurement at lower temperatures. Firstly the sample was warmed up to 40 K, far above the magnetic ordering temperature ( 17 K). Next, we have cooled the sample with zero applied field, and stabilized the temperature before activating the magnet. The magnetic field was swept initially to 2 T, to avoid crossing the AFM-FM transition. Then, the magnetic field was swept and reached -9 T (9 T applied in the adverse direction). Afterwards, we performed the final sweep and continuously reversed the direction of the magnetic field to 9 T. The whole procedure was repeated for each scan in order to remove any magnetic memory from the sample. In Figure 7 we show the results of the field sweeps at the selected temperatures.
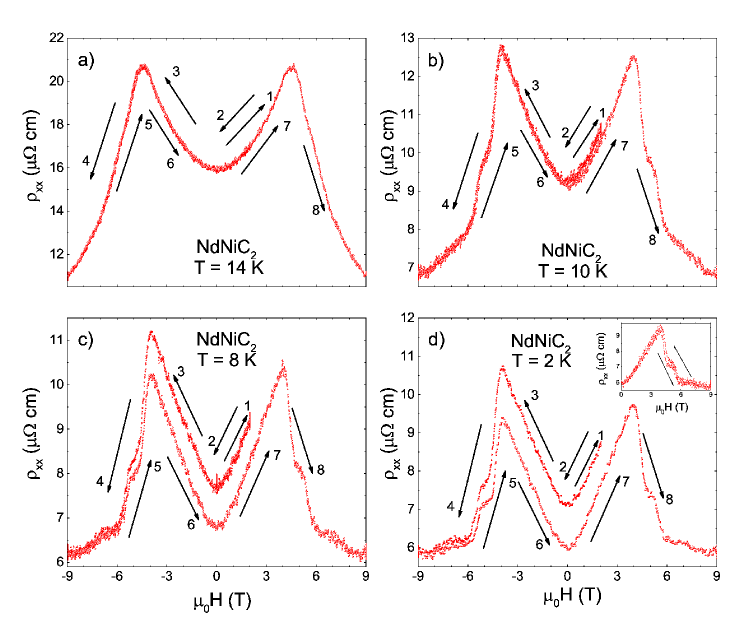
The resistivity measured at = 14 K (Figure 7a) is reversible with . At = 10 K (Figure 7b) one can notice a small irreverisibility of , which becomes more pronounced at = 8 K, as depicted in Figure 7c. When the magnetic field is increased to 2 T and then swept to 0, the resistivity returns to the zero-field cooled value of . In these conditions, the sample remains in the AFM state. However, the application of a magnetic field exceeding the limit of 4 T, at which the FM order is induced in the sample, prevents the resistance from returning to the original . Further magnetic field sweeps do not induce any irreversible transitions and the resistivity returns to the new value of when the field is reduced back to 0. Figure 7d compares the result of a field sweep of the sample cooled to 2 K in ZFC condition and the of the same sample, which previously experienced the transformation to the FM state at = 5 K (inset). The irreversible behavior is clearly visible in the former case, while in the latter one the resistivity returns to the initial value. This shows that the resistance of NdNiC2 depends not only on temperature, applied magnetic field or the type of magnetic ordering present in the sample at these conditions, but also on the magnetic history of the sample and this metastable effect is clearly associated with the AFM-FM transition. Previous reports on the magnetoresistance of NdNiC2 Yamamoto et al. (2013); Lei et al. (2017) have not mentioned the irreversible phase transition, probably because this weak crossover could be easily overlooked, since once the sample experiences the high magnetic field at temperature below 12 K it remains in the metastable state and the irreversibility is no longer observable until the sample is reheated and cooled down again. One plausible scenario to explain this irreversible effect is the magnetoplastic lattice deformation induced by the ferromagnetic transition. Note that even a small lattice transformation and a consequent Fermi surface modification can substantially impact the nesting conditions and this can lead to the quasi-permanent suppression of CDW.
The BCS approach predicts the negative magnetoresistance in CDW systems to originate from the Zeeman splitting of the conduction bandsDieterich and Fulde (1973) which results in reduction of the pairing interactions and degradation of nesting properties. This term has been found to originate both from orbital effects and from local spins producing stronger magnetic moments. For magnetic fields , the Zeeman magnetoresistance term is expressedTiedje et al. (1975) by Equation 3:
| (3) |
The Figure 8a shows the magnetoresistance of NdNiC2 above as a function of . The plots do not converge into a single straight line. This is not surprising, since this temperature interval corresponds to the onset of the field induced magnetic ordering. This can lead either to the previously suggested CDW suppression, stronger than predicted by Equation 3 or to the reduction of the spin scattering, which also results in negative magnetoresistance as in CeNiC2. The comparison of the strength of the negative magnetoresistance in NdNiC2 and CeNiC2 in the vicinity of can also be a useful guide. In the former compound, showing the Peierls instability, MR reaches -40 % which is an order of magnitude larger than in the latter one, in which the CDW is absent. This suggests that, the negative magnetoresistance in NdNiC2 originates, at least partially, from the suppression of the CDW state.
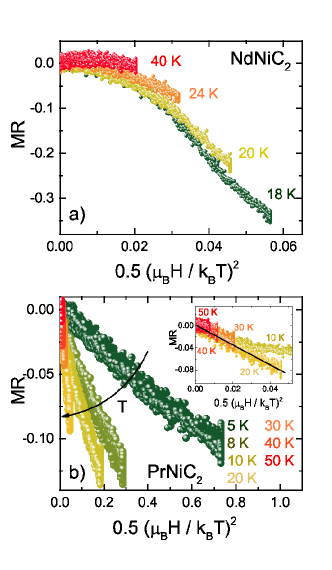
The negative MR in PrNiC2 reaches a maximum of 12%, which although is visibly weaker than in NdNiC2, still exceeds the value found in CeNiC2. This, similar to the case of NdNiC2, suggests that the decrease of resistance in magnetic field originates from the suppression of the CDW. To verify this hypothesis, we have scaled the magnetoresistance in PrNiC2 with Equation 3, as shown in Figure 8 b. At 20 K the PrNiC2 can be qualitatively described by the Zeeman term; the MR plots fall into a single straight line. At lower temperatures, in the vicinity of the negative magnetoresistance is weakened and diverges from this scalling law (as shown in the inset of Figure 8b). The curve obtained for = 10 K is a boundary of the relevance of the Equation 3. At 0.02, which corresponds to = 6 T at this temperature, the magnetoresistance plot diverges from the Zeeman scaling and starts decreasing. We find that, to apply Equation 3 one has to use the prefactor of approximately 1.4. In other CDW materials this coefficient is usually smaller than unity. The key examples are Li0.9Mo6O17 Xu et al. (2009) or organic compounds such as (Per)2Pt(mnt)2 Graf et al. (2004b); Matos et al. (1996); Bonfait et al. (1995, 1991) in which the existence of weakly magnetic chains ramps this magnetoresistance prefactor in comparison with (Per)2Au(mnt)2 Graf et al. (2005); Monchi et al. (1999) showing a non-magnetic character. On the other hand, the value we found is significantly lower than the factor of 30 found in GdNiC2 Kolincio et al. (2016a), where the presence of strong local magnetic moments amplifies the internal magnetic field much more effectively than in PrNiC2, showing no clear long range magnetic ordering.
Due to polycrystalline nature of our samples, we are unable to perform the X-ray diffuse scattering experiment to follow the intensity and position of the satellite reflections at various temperature and magnetic field. Instead, to investigate the suppression of the charge density waves state by magnetic field, we have conducted the Hall effect measurements, which can be used as a direct probe for electronic carrier concentration. Figure 9a shows the thermal dependence of Hall resistivity () in NdNiC2. The sign of the measured Hall resistance is negative, opposite to the results reported recently Lei et al. (2017). To clarify this point, we have repeated the measurement with a reference sample of Cu foil, which shows a negative Hall signal in the same contact geometry. This confirms the relevance of the negative sign of in NdNiC2. At , the Hall signal is almost independent of temperature. At the Peierls temperature one observes a downturn of (and increase of ), which is a typical signature of the opening of the CDW bandgap and condensation of electronic carriers Wang et al. (1989); Schlenker et al. (1985). Upon further cooling, the Hall resistivity decreases until it reaches a minimum followed by a prominent increase of (and decrease of ), which grows even higher than for temperatures above .
This increase of in proximity of the magnetic ordering temperature observed in SmNiC2Kim et al. (2012) and NdNiC2Lei et al. (2017) has been attributed to the destruction of CDW and a concomitant release of previously condensed carriers. Although the CDW suppression by magnetic field appears to be quite a possible scenario, this mechanism itself is not sufficient to explain the features observed as , especially considering that the low temperature is lower than the value found for . This could lead to a misguiding suggestion that the carrier concentration below exceeds the high temperature normal state value. To avoid the oversimplification, in a material exhibiting magnetic ordering, one has to consider two components of the Hall resistanceBerger and Bergmann (1980):
| (4) |
The in Equation 4 is the ordinary Hall coefficient which, in a single band model, is inversely proportional to the carrier concentration. denotes the anomalous Hall coefficient associated with side jump and skew scattering. To obtain the more clear evidence of the partial CDW destruction in NdNiC2, we complement the previous Hall effect studyLei et al. (2017) of this compound in regard to the anomalous component of the Hall signal. We also present the results of the same experiment for CeNiC2 and PrNiC2 which similarly to magnetoresistance in these two compounds have not been reported previously. The separation of normal and anomalous components is not straightforward unless the magnetic moment saturates with magnetic field which then reduces the latter one to a constantHiggins et al. (2004); Xu et al. (2006); Oiwa et al. (1999); Shiomi et al. (2009). Here, no signs of saturation of up to an applied field of 14 T for any of the studied compounds have been foundRogacki , which precludes the possibility of the direct extraction of electronic concentration from . Nevertheless we can propose an alternative road to follow the number of carriers condensed into the charge density wave state. The idea is to compare the field dependencies of and with a special regard for the temperature region, in which magnetization follows the linear field dependency. In this condition the anomalous component contribution is also linear with field and, for a single band metal, any departure from the the linearity of indicates the change of which is a measure of electronic concentration.
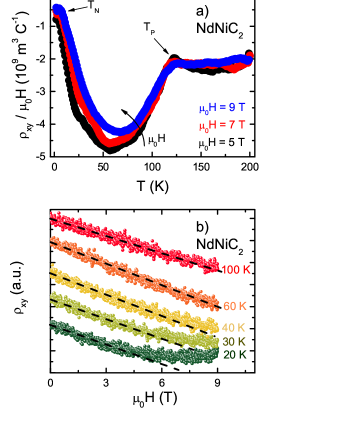
Figure 9b shows the magnetic field dependence of the Hall resisitivity of NdNiC2 measured at various temperatures. At 60 K one cannot find any departure from linearity for the . A small nonlinearity can be seen at 40 K. Upon further cooling, the deviation from linear variation for becomes more pronounced. Comparing this result with magnetization data for NdNiC2 (Fig. 2d), which shows linear dependence at 20 K one can deduce that, in this temperature range, the non-linearity of can be safely attributed to the increase in electronic concentration. This indicates that, the release of previously CDW condensed carriers is, next to the anomalous Hall component, responsible for the increase of as temperature is lowered to the vicinity of . Here we emphasize that, since we were unable to observe the saturation of we are unable to separate the normal and anomalous components of the Hall resistivity for 20 K, where both and are non-linear functions of .
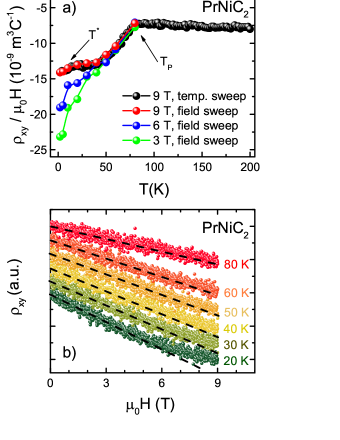
The thermal dependence of Hall resistance of PrNiC2 depicted in Figure 10a exhibits some similarities to the case of NdNiC2. A significant downturn of below concomitant with an increase of resistivity (Figure 5c) due to the condensation of the electronic carriers is observed at . Upon further cooling, the Hall resistivity continues to decrease and does not simply saturate at , where the electronic gap is expected to be fully open. This behavior is consistent with the non-BCS thermal dependence of the satellite reflections intensityYamamoto et al. (2013) suggesting that the nesting vector adjusts to the FS evolution. In contrast to NdNiC2, no significant upturn of is observed as approaches the magnetic ordering temperature. Contrarily, below the Hall resistivity starts to decrease again. This observation is in agreement with the behavior of the intensity of the CDW satellite reflections Yamamoto et al. (2013), which show a sudden increase upon crossing . Below 60 K, corresponding to the onset of negative magnetoresistance, the curves obtained at different magnetic fields do not converge. The application of stronger magnetic field drives the thermal dependence of towards more positive values, in comparison to the data obtained at lower . Similar to NdNiC2, this can be attributed to the positive anomalous Hall component growing as the magnetization increases or to the partial suppression of the CDW and increase of the electronic concentration. It shall be noted that, the strength of the downturn below is sufficient to overcome the anomalous term driving the Hall resistivity towards more positive values. Note that, the strength of the anomalous Hall signal in PrNiC2 is expected to parallel the scale of NdNiC2, since the values of magnetization of both compounds are comparable. To explore this effect further, we have conducted measurements for PrNiC2. As shown in Figure 10b, the non-linearity of the Hall resistivity plotted versus can be observed in this compound as well. The deviation from linearity, initially barely observable for = 50 K becomes stronger at lower temperatures. Here, however, we cannot follow the same analysis as for the case of NdNiC2, due to the fact that for temperatures lower than 60 K the magnetization does not follow a linear relationship with . Therefore, the two normal and anomalous ingredients of the Hall resistivity in PrNiC2 cannot be unambiguously separated. Nevertheless, the downturn of at strongly suggests the enhancement of the CDW state, although the magnetoresistance above shows some signatures of the partial suppression of the Peierls instability. This can be explained in terms of the lattice transformation accompanying the magnetic anomaly modifying the Fermi surface, which triggers the nesting of another FS part when the CDW vector adjusts to band structure evolution. One cannot however exclude an alternative scenario, in which the enhancement of the Fermi surface nesting can be seen as a driving force for the magnetic anomaly. Since the magnetic properties are related to the free electron density via RKKY interactions, it is not unreasonable to expect the condensation of the electronic carriers at to modify of the magnetic character of PrNiC2. The high resolution X-ray and neutron diffraction experiment performed with a single crystal of PrNiC2 will be required to clarify this point.
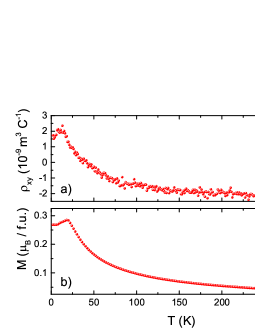
The thermal dependence of Hall resistivity in CeNiC2, shown in Figure 11a shows no signatures of electronic condensation. This is in agreement with transport properties in which no anomalies similar to those found in NdNiC2 and PrNiC2 are observed and confirms the absence of the Peierls instability in CeNiC2. From the clear correlation between the thermal dependence of and magnetization (see Figure 11b), one can conclude, that the anomalous component is the dominant ingredient of the Hall effect in this compound, while the normal Hall coefficient is expected to remain temperature independent. The observation of the increase of as in CeNiC2, where the absence of the CDW has been emphasized, implies that the anomalous Hall component is essential to describe the in NdNiC2 and PrNiC2.
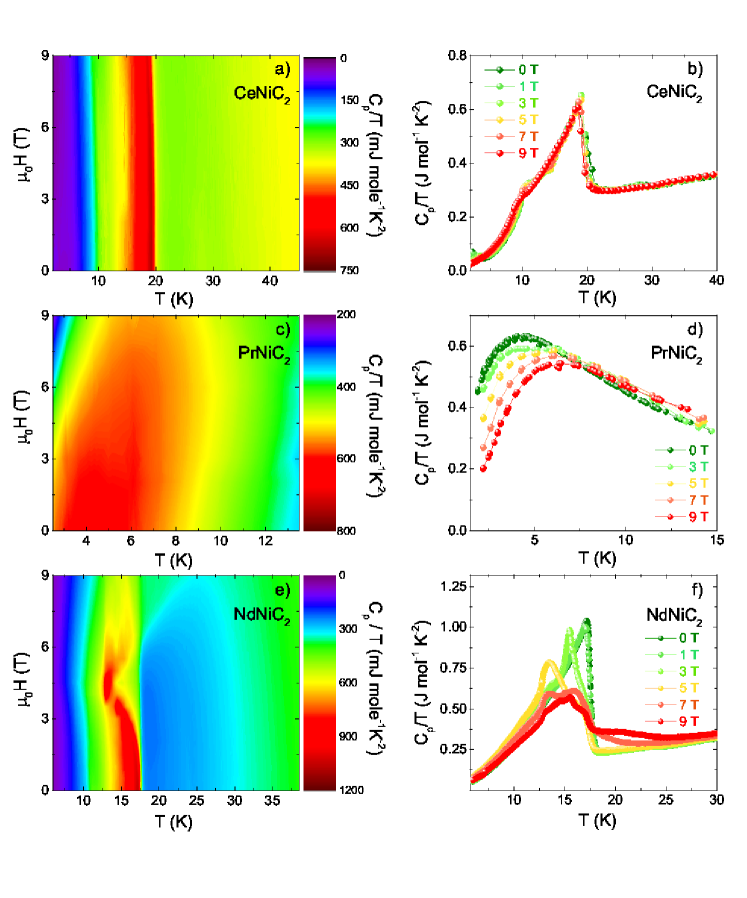
To explore the observed transitions further, we have studied the thermal and magnetic field dependencies of specific heat (). Previously the has been successfully used to construct the phase diagram for GdNiC2Kolincio et al. (2016a). Figure 13 shows a specific heat map (a) and the heat capacity of the polycrystalline CeNiC2 (b) plotted as a function of temperature, under various magnetic fields. In the results we can observe a few anomalies. The largest one is seen at about 19 K and is almost unaffected by the applied magnetic fields up to 9 T. The second anomaly is less pronounced and the temperature of its occurrence varies with the applied magnetic field from 11 K in 0 T to 9.5 K in 9 T. The existence of the features anomalies are in agreement with magnetization and transport results. Another anomaly, previously reported by Motoya et al. Motoya et al. (1997), seen at 2 K is magnetic field dependent. A minor jump around 30 K is likely connected with the CeC2 impurity phase Sakai et al. (1980), as suggested from magnetic susceptibility data.
The broad hump seen in PrNiC2 (Fig. 13 c and d) is a Schottky anomaly originating from multiple energy levels of the Pr3+ ion subject to the CEF splitting. Due to the complicated energy level structure the specific heat data could not be reliably fitted in order to extract the level splitting energies. The anomaly is slightly shifted towards higher temperature by applied magnetic field as seen in Figure 13 c and d, which is caused by the Zeeman effect, as seen in many f-electron systems (see eg. Winiarski and Klimczuk (2017); Tachibana et al. (2007); Mori et al. (2009)). No clear anomaly is seen around corresponding both to the drop in the Hall resistivity and the upturn of susceptibility. This may suggest that the alleged transition involves predominantly the change of electronic structure with little effect on crystal and spin order, which should result in the appearance of an anomaly in specific heat. Note that in the Pb2Sr2PrCu3O8 compound mentioned before the specific heat anomaly at the transition temperature is weak Wu et al. (1998). If such weak anomaly would arise in PrNiC2 at the it could be hard to observe on top of the large Schottky hump.
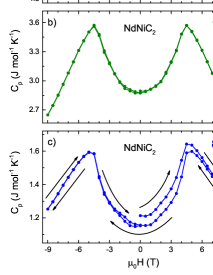
The results of the specific heat measurements for NdNiC2 are shown in Fig. 13 e and f. For this compound the specific heat shows a lambda-like anomaly at , which is weakly affected by the applied magnetic field up to about 3.0-3.5 T above which a metamagnetic transition occurs. Above 7 T we can observe the third anomaly which is probably related to the occurrence of the transitional phase between AFM and FM.
The magnetic field dependence of the specific heat of NdNiC2 measured at 12 K, 10 K and 8 K is presented in Fig. 12. At 8 K the vs. shows an irreversible behavior as seen in Figure 12c. The observation of the irreversibility in both specific heat and electrical resistivity measurements confirms the presence of a magnetic field-induced metastable state, not reported in previous studies. Interestingly, the same transition does not result in the appearance of hysteresis in magnetization, as seen in the inset of Figure 2. This could be explained by the insufficient resolution of magnetization measurements performed with the ACMS option. However it is also possible that the field-induced transition involves a change of electronic and crystal structures without a significant change in magnetic order.
IV conclusions
In order to explore the interaction between charge density waves and magnetism in the RNiC2 family, we have compared the physical properties of three isostructural compounds: NdNiC2, showing both the Peierls instability, PrNiC2 with the CDW and a magnetic anomaly, and CeNiC2, showing antiferromagnetic ordering, and the absence of the CDW transition. The weak magnetoresistance in CeNiC2 is found to originate by the spin fluctuations accompanying the magnetic transition. Neither transport or Hall effect measurements reveal any signatures of the Peierls instability. Study of the magnetoresistance and the galvanomagnetic properties of NdNiC2 confirms the partial suppression of charge density waves by magnetic ordering and a further destruction of the Peierls instability at the crossover from the antiferromagnetic to ferromagnetic order. We have also found that this magnetic transformation drives a metastable lattice transformation that can be observed via the magnetoresistance and the specific heat measurements. The interplay between magnetism and charge density waves in PrNiC2 shows more complex character. Although the magnetoresistance data suggest that, the application of magnetic field partially suppresses CDW by Zeeman splitting of the electronic bands, the expansion of the nested region of the Fermi surface at 8 K can be observed by a significant downturn of the Hall resistivity, strong enough to overcome the positive Hall signal originating from the anomalous component. This effect seems to be related to the magnetic anomalyOnodera et al. (1998) observed at the same temperature, however the underlying mechanism remains unclear. Tentatively, the interaction between the CDW and magnetic properties of this compound can be described either by the lattice transformation due to the magnetic anomaly, and by the modification of the magnetic ordering via the RKKY interactions influenced by change of the electronic concentration. Further analysis of this effect can be realized by high resolution diffraction experiments on a single crystal.
V Acknowledgments
Authors gratefully acknowledge the financial support from National Science Centre (Poland), grant number: UMO-2015/19/B/ST3/03127. We also thank to E. Carnicom, K. Rogacki, Z. Sobczak, K. Górnicka and H. Marciniak for useful advice and fruitful discussions.
References
- Chang et al. (2012) J. Chang, E. Blackburn, A. T. Holmes, N. B. Christensen, J. Larsen, J. Mesot, R. Liang, D. A. Bonn, W. N. Hardy, A. Watenphul, M. v. Zimmermann, E. M. Forgan, and S. M. Hayden, Nature Physics 8, 871 (2012).
- da Silva Neto et al. (2014) E. H. da Silva Neto, P. Aynajian, A. Frano, R. Comin, E. Schierle, E. Weschke, A. Gyenis, J. Wen, J. Schneeloch, Z. Xu, S. Ono, G. Gu, M. Le Tacon, and A. Yazdani, Science 343, 393 (2014).
- Chang et al. (2016) J. Chang, E. Blackburn, O. Ivashko, A. T. Holmes, N. B. Christensen, M. Hücker, R. Liang, D. A. Bonn, W. N. Hardy, U. Rütt, M. v. Zimmermann, E. M. Forgan, and S. M. Hayden, Nature Communications 7, 11494 (2016).
- Fawcett (1988) E. Fawcett, Rev. Mod. Phys. 60, 209 (1988).
- Jacques et al. (2016) V. L. R. Jacques, C. Laulhé, N. Moisan, S. Ravy, and D. Le Bolloc’h, Phys. Rev. Lett. 117, 156401 (2016).
- Young and Sokoloff (1974) C. Y. Young and J. B. Sokoloff, Journal of Physics F: Metal Physics 4, 1304 (1974).
- Balseiro et al. (1980) C. A. Balseiro, P. Schlottmann, and F. Yndurain, Phys. Rev. B 21, 5267 (1980).
- Tiedje et al. (1975) T. Tiedje, J. F. Carolan, A. J. Berlinsky, and L. Weiler, Canadian Journal of Physics 53, 1593 (1975).
- Brooks et al. (2006) J. Brooks, D. Graf, E. Choi, M. Almeida, J. Dias, R. Henriques, and M. Matos, Current Applied Physics 6, 913 (2006).
- Wang et al. (2014) J.-F. Wang, M. Yang, L. Li, M. Sasaki, A. Ohnishi, M. Kitaura, K.-S. Kim, and H.-J. Kim, Phys. Rev. B 89, 035137 (2014).
- Andres et al. (2011) D. Andres, M. V. Kartsovnik, W. Biberacher, K. Neumaier, I. Sheikin, H. Müller, and N. D. Kushch, Low Temperature Physics 37, 762 (2011), http://dx.doi.org/10.1063/1.3670031 .
- Zanchi et al. (1996) D. Zanchi, A. Bjeliš, and G. Montambaux, Phys. Rev. B 53, 1240 (1996).
- Graf et al. (2004a) D. Graf, E. S. Choi, J. S. Brooks, M. Matos, R. T. Henriques, and M. Almeida, Phys. Rev. Lett. 93, 076406 (2004a).
- Winter et al. (2013) L. E. Winter, J. S. Brooks, P. Schlottmann, M. Almeida, S. Benjamin, and C. Bourbonnais, EPL (Europhysics Letters) 103, 37008 (2013).
- Murata et al. (2015) K. Murata, Y. Fukumoto, K. Yokogawa, W. Kang, R. Takaoka, R. Tada, H. Hirayama, J. S. Brooks, D. Graf, H. Yoshino, T. Sasaki, and R. Kato, Physica B: Condensed Matter 460, 241 (2015), special Issue on Electronic Crystals (ECRYS-2014).
- Lalngilneia et al. (2015) P. C. Lalngilneia, A. Thamizhavel, S. Ramakrishnan, and D. Pal, Journal of Physics: Conference Series 592, 012094 (2015).
- van Smaalen et al. (2004) S. van Smaalen, M. Shaz, L. Palatinus, P. Daniels, F. Galli, G. J. Nieuwenhuys, and J. A. Mydosh, Phys. Rev. B 69, 014103 (2004).
- Galli et al. (2000) F. Galli, S. Ramakrishnan, T. Taniguchi, G. J. Nieuwenhuys, J. A. Mydosh, S. Geupel, J. Lüdecke, and S. van Smaalen, Phys. Rev. Lett. 85, 158 (2000).
- Galli et al. (2002) F. Galli, R. Feyerherm, R. W. A. Hendrikx, E. Dudzik, G. J. Nieuwenhuys, S. Ramakrishnan, S. D. Brown, S. van Smaalen, and J. A. Mydosh, Journal of Physics: Condensed Matter 14, 5067 (2002).
- Hossain et al. (2005) Z. Hossain, M. Schmidt, W. Schnelle, H. S. Jeevan, C. Geibel, S. Ramakrishnan, J. A. Mydosh, and Y. Grin, Phys. Rev. B 71, 060406 (2005).
- Leroux et al. (2013) M. Leroux, P. Rodière, and C. Opagiste, Journal of Superconductivity and Novel Magnetism 26, 1669 (2013).
- Singh et al. (2004) Y. Singh, D. Pal, and S. Ramakrishnan, Phys. Rev. B 70, 064403 (2004).
- Sangeetha et al. (2012) N. S. Sangeetha, A. Thamizhavel, C. V. Tomy, S. Basu, A. M. Awasthi, S. Ramakrishnan, and D. Pal, Phys. Rev. B 86, 024524 (2012).
- Kuo et al. (2006) Y. K. Kuo, K. M. Sivakumar, T. H. Su, and C. S. Lue, Phys. Rev. B 74, 045115 (2006).
- Kim et al. (2013) J. N. Kim, C. Lee, and J.-H. Shim, New Journal of Physics 15, 123018 (2013).
- Prathiba et al. (2016) G. Prathiba, I. Kim, S. Shin, J. Strychalska, T. Klimczuk, and T. Park, Scientific Reports 6, 26530 (2016).
- Murase et al. (2004) M. Murase, A. Tobo, H. Onodera, Y. Hirano, T. Hosaka, S. Shimomura, and N. Wakabayashi, Journal of the Physical Society of Japan 73, 2790 (2004).
- Yamamoto et al. (2013) N. Yamamoto, R. Kondo, H. Maeda, and Y. Nogami, Journal of the Physical Society of Japan 82, 123701 (2013).
- Laverock et al. (2009) J. Laverock, T. D. Haynes, C. Utfeld, and S. B. Dugdale, Phys. Rev. B 80, 125111 (2009).
- Ahmad et al. (2015) D. Ahmad, B. H. Min, G. I. Min, S.-I. Kimura, J. Seo, and Y. S. Kwon, Physica Status Solidi (B) 252, 2662 (2015).
- Shimomura et al. (2016) S. Shimomura, C. Hayashi, N. Hanasaki, K. Ohnuma, Y. Kobayashi, H. Nakao, M. Mizumaki, and H. Onodera, Physical Review B 93, 165108 (2016).
- Wölfel et al. (2010) A. Wölfel, L. Li, S. Shimomura, H. Onodera, and S. van Smaalen, Physical Review B 82, 054120 (2010).
- Lee et al. (1996) W. Lee, H. Zeng, Y. Yao, and Y. Chen, Physica C: Superconductivity 266, 138 (1996).
- Pecharsky et al. (1998) V. K. Pecharsky, L. L. Miller, and K. A. Gschneidner, Phys. Rev. B 58, 497 (1998).
- Wiendlocha et al. (2016) B. Wiendlocha, R. Szczȩśniak, A. P. Durajski, and M. Muras, Physical Review B 94, 134517 (2016).
- Schäfer et al. (1997) W. Schäfer, W. Kockelmann, G. Will, J. Yakinthos, and P. Kotsanidis, Journal of Alloys and Compounds 250, 565 (1997).
- Kotsanidis et al. (1989) P. Kotsanidis, J. Yakinthos, and E. Gamari-Seale, Journal of the Less Common Metals 152, 287 (1989).
- Bhattacharyya et al. (2014) A. Bhattacharyya, D. T. Adroja, A. M. Strydom, A. D. Hillier, J. W. Taylor, A. Thamizhavel, S. K. Dhar, W. A. Kockelmann, and B. D. Rainford, Phys. Rev. B 90, 054405 (2014).
- Yakinthos et al. (1990) J. Yakinthos, P. Kotsanidis, W. Schäfer, and G. Will, Journal of Magnetism and Magnetic Materials 89, 299 (1990).
- Hanasaki et al. (2011) N. Hanasaki, K. Mikami, S. Torigoe, Y. Nogami, S. Shimomura, M. Kosaka, and H. Onodera, Journal of Physics: Conference Series 320, 012072 (2011).
- Uchida et al. (1995) N. Uchida, H. Onodera, M. Ohashi, Y. Yamaguchi, N. Sato, and S. Funahashi, Journal of Magnetism and Magnetic Materials 145, L16 (1995).
- Matsuo et al. (1996) S. Matsuo, H. Onodera, M. Kosaka, H. Kobayashi, M. Ohashi, H. Yamauchi, and Y. Yamaguchi, Journal of Magnetism and Magnetic Materials 161, 255 (1996).
- Onodera et al. (1998) H. Onodera, Y. Koshikawa, M. Kosaka, M. Ohashi, H. Yamauchi, and Y. Yamaguchi, Journal of Magnetism and Magnetic Materials 182, 161 (1998).
- Sakai et al. (1980) T. Sakai, G.-y. Adachi, and J. Shiokawa, Materials Research Bulletin 15, 1001 (1980).
- Rodríguez-Carvajal (1993) J. Rodríguez-Carvajal, Physica B: Condensed Matter 192, 55 (1993).
- Motoya et al. (1997) K. Motoya, K. Nakaguchi, N. Kayama, K. Inari, J. Akimitsu, K. Izawa, and T. Fujita, Journal of the Physical Society of Japan 66, 1124 (1997), http://journals.jps.jp/doi/pdf/10.1143/JPSJ.66.1124 .
- Schäfer et al. (1992) W. Schäfer, G. Will, J. Yakinthos, and P. Kotsanidis, Journal of Alloys and Compounds 180, 251 (1992).
- Jensen and Mackintosh (1991) J. Jensen and A. R. Mackintosh, Rare earth magnetism: structures and excitations (Clarendon Press, 1991).
- Kolincio et al. (2016a) K. K. Kolincio, K. Górnicka, M. J. Winiarski, J. Strychalska-Nowak, and T. Klimczuk, Phys. Rev. B 94, 195149 (2016a).
- Hsieh et al. (1994) W. T. Hsieh, W.-H. Li, K. C. Lee, J. W. Lynn, J. H. Shieh, and H. C. Ku, Journal of Applied Physics 76, 7124 (1994).
- Akamaru et al. (2001) S. Akamaru, Y. Isikawa, J. Sakurai, K. Maezawa, and H. Harima, Journal of the Physical Society of Japan 70, 2049 (2001).
- Snyman and Strydom (2013) J. L. Snyman and A. M. Strydom, Journal of Applied Physics 113, 17E135 (2013).
- Gil et al. (1994) A. Gil, A. Szytuła, Z. Tomkowicz, K. Wojciechowski, and A. Zygmunt, Journal of Magnetism and Magnetic Materials 129, 271 (1994).
- Kolincio et al. (2016b) K. Kolincio, O. Pérez, S. Hébert, P. Fertey, and A. Pautrat, Phys. Rev. B 93, 235126 (2016b).
- Lei et al. (2017) H. Lei, K. Wang, and C. Petrovic, Journal of Physics: Condensed Matter 29, 075602 (2017).
- Usami (1978) K. Usami, Journal of the Physical Society of Japan 45, 466 (1978), http://dx.doi.org/10.1143/JPSJ.45.466 .
- Mazumdar et al. (1997) C. Mazumdar, A. K. Nigam, R. Nagarajan, L. C. Gupta, G. Chandra, B. D. Padalia, C. Godart, and R. Vijayaraghaven, Journal of Applied Physics 81, 5781 (1997), http://dx.doi.org/10.1063/1.364666 .
- YAMADA and TAKADA (1972) H. YAMADA and S. TAKADA, Progress of theoretical physics 48, 1828 (1972).
- Shimomura et al. (2009) S. Shimomura, C. Hayashi, G. Asaka, N. Wakabayashi, M. Mizumaki, and H. Onodera, Physical Review Letters 102, 076404 (2009).
- Hanasaki et al. (2012) N. Hanasaki, Y. Nogami, M. Kakinuma, S. Shimomura, M. Kosaka, and H. Onodera, Physical Review B 85, 092402 (2012).
- Dieterich and Fulde (1973) W. Dieterich and P. Fulde, Zeitschrift für Physik A Hadrons and nuclei 265, 239 (1973).
- Xu et al. (2009) X. Xu, A. F. Bangura, J. G. Analytis, J. D. Fletcher, M. M. J. French, N. Shannon, J. He, S. Zhang, D. Mandrus, R. Jin, and N. E. Hussey, Phys. Rev. Lett. 102, 206602 (2009).
- Graf et al. (2004b) D. Graf, J. S. Brooks, E. S. Choi, S. Uji, J. C. Dias, M. Almeida, and M. Matos, Phys. Rev. B 69, 125113 (2004b).
- Matos et al. (1996) M. Matos, G. Bonfait, R. T. Henriques, and M. Almeida, Phys. Rev. B 54, 15307 (1996).
- Bonfait et al. (1995) G. Bonfait, M. J. Matos, R. T. Henriques, and M. Almeida, Physica B: Condensed Matter 211, 297 (1995).
- Bonfait et al. (1991) G. Bonfait, E. B. Lopes, M. J. Matos, R. T. Henriques, and M. Almeida, Solid State Communications 80, 391 (1991).
- Graf et al. (2005) D. Graf, E. Choi, J. Brooks, J. Dias, R. Henriques, M. Almeida, M. Matos, and D. Rickel, Synthetic Metals 153, 361 (2005).
- Monchi et al. (1999) K. Monchi, M. Poirier, C. Bourbonnais, M. Matos, and R. Henriques, Synthetic Metals 103, 2228 (1999).
- Wang et al. (1989) E. Wang, M. Greenblatt, I. E.-I. Rachidi, E. Canadell, M.-H. Whangbo, and S. Vadlamannati, Phys. Rev. B 39, 12969 (1989).
- Schlenker et al. (1985) C. Schlenker, J. Dumas, C. Escribe-filippini, H. Guyot, J. Marcus, and G. Fourcaudot, Philosophical Magazine Part B 52, 643 (1985), http://dx.doi.org/10.1080/13642818508240627 .
- Kim et al. (2012) J. H. Kim, J.-S. Rhyee, and Y. S. Kwon, Phys. Rev. B 86, 235101 (2012).
- Berger and Bergmann (1980) L. Berger and G. Bergmann, “The Hall Effect of Ferromagnets,” in The Hall Effect and Its Applications, edited by C. L. Chien and C. R. Westgate (Springer US, Boston, MA, 1980) pp. 55–76.
- Higgins et al. (2004) J. S. Higgins, S. R. Shinde, S. B. Ogale, T. Venkatesan, and R. L. Greene, Phys. Rev. B 69, 073201 (2004).
- Xu et al. (2006) Q. Xu, L. Hartmann, H. Schmidt, H. Hochmuth, M. Lorenz, R. Schmidt-Grund, C. Sturm, D. Spemann, and M. Grundmann, Phys. Rev. B 73, 205342 (2006).
- Oiwa et al. (1999) A. Oiwa, A. Endo, S. Katsumoto, Y. Iye, H. Ohno, and H. Munekata, Phys. Rev. B 59, 5826 (1999).
- Shiomi et al. (2009) Y. Shiomi, Y. Onose, and Y. Tokura, Phys. Rev. B 79, 100404 (2009).
- (77) K. Rogacki, Private communication.
- Winiarski and Klimczuk (2017) M. J. Winiarski and T. Klimczuk, Journal of Solid State Chemistry 245, 10 (2017).
- Tachibana et al. (2007) M. Tachibana, Y. Kohama, T. Atake, and E. Takayama-Muromachi, Journal of Applied Physics 101, 09D502 (2007), http://dx.doi.org/10.1063/1.2667992 .
- Mori et al. (2009) T. Mori, T. Takimoto, A. Leithe-Jasper, R. Cardoso-Gil, W. Schnelle, G. Auffermann, H. Rosner, and Y. Grin, Physical Review B 79, 104418 (2009).
- Wu et al. (1998) S. Y. Wu, Y. C. Chang, K. C. Lee, and W.-H. Li, Journal of Applied Physics 83, 7318 (1998).