Current-driven instability of quantum anomalous Hall effect
in ferromagnetic topological insulators
Abstract
Instability of quantum anomalous Hall (QAH) effect has been studied as functions of electric current and temperature in ferromagnetic topological insulator thin films. We find that a characteristic current for the breakdown of the QAH effect is roughly proportional to the Hall-bar width, indicating that Hall electric field is relevant to the breakdown. We also find that electron transport is dominated by variable range hopping (VRH) at low temperatures. Combining the current and temperature dependences of the conductivity in the VRH regime, the localization length of the QAH state is evaluated to be about 5 m. The long localization length suggests a marginally insulating nature of the QAH state due to a large number of in-gap states.
Electronic phenomena arising from topological nature of band structures in solids has been gaining great interests in condensed-matter physics, triggered by the recent discoveries of two-dimensionalKane ; Bernevig ; Konig and three-dimensional (3D) topological insulators (TIs)Fu ; Hsieh ; Brune ; Hasan ; Qi . A 3D TI is an insulator with an energy gap in the band structure of its interior, while the gap closes at the surface due to the exotic topology of the band structureFu ; Hsieh ; Brune ; Hasan ; Qi . One of the most decisive examples of the topology-related phenomena in a 3D TI is the quantum anomalous Hall effect (QAHE) found in ferromagnetic thin filmsYu ; Nomura ; Zhang ; Chang1 . In the quantum anomalous Hall (QAH) state, the Hall resistance is quantized to with vanishing longitudinal resistance, similarly to the quantum Hall effect (QHE)Klitzing but without external magnetic field. The QAHE has been observed experimentally in thin films of Cr-dopedChang1 ; Checkelsky ; Kou ; Bestwick ; Mogi or V-doped Chang2 ; Chang3 ; Grauer (Bi, Sb)2Te3 grown by molecular beam epitaxy. The films show robust ferromagnetism with an easy-axis anisotropy perpendicular to the films with typical ferromagnetic transition temperatures at around 10 K. The Hall resistance quantization and the vanishing longitudinal resistance have been confirmed by transport measurements at low temperatures.
The QAHE can be understood as a consequence of an energy gap opening on the topological surface states by the exchange interaction between the surface electrons and the magnetic momentsYu ; Nomura ; Zhang ; Chang1 . In a thin film form of a ferromagnetic 3D TI with perpendicular magnetic anisotropy, the top and bottom surfaces are gapped while the side surfaces parallel to the magnetization remain gap-less. On these gap-less side surfaces, one-dimensional chiral edge channels are formed with a help of quantum confinement effect in a thin-film formPertsova . When the Fermi energy is tuned in the magnetization-induced gap, the electric current is carried by the chiral edge channels, resulting in the Hall resistance quantization. Because the relevant energy gap is induced by the magnetization, the QAHE can survive even in the absence of an external magnetic field. The QAHE is believed to be robust against disorder or any other perturbations unless the magnetization-induced gap of the surface states is closed.
Despite of the different origins for the energy gap formation; Landau level splitting in the QHE and exchange gap of surface states in the QAHE, the QAHE resembles the QHE in many aspectsCheckelsky ; Kou ; Chang2 , including the preciseness of the quantized Hall resistance. The chiral nature of the edge channels, prohibiting back scattering of electrons, ensures the precise quantization of the Hall resistance to . Therefore the use of the QAHE for a resistance standard is one of the promising applications. Because the Hall resistance quantization can be achieved in the absence of an external magnetic field, realization of the QAHE-based resistance standard is appealing from a practical viewpoint.
Recent experimental studies concerning the precision of the quantized resistance report an error of about in the case of QHE in graphene and GaAs-based systems Jeckelmann ; Tzalenchuk ; Lafont , but only in the case of QAHEChang3 ; Bestwick . The precise quantization of the QAHE was achieved only at low temperatures below 100 mK. The low observable temperature of the QAHE has been an issue of discussionsMogi ; Li . In addition, stability of the QAH state against electric current matters for the resistance standard application because a large current in the order of ten A is usually employed for the high-precision measurementsJeckelmann ; Tzalenchuk ; Lafont . Although poor stability against electric current is intuitively expected from the low observable temperature, direct measurement of the current stability and comparison with QHE would provide quantitative understandings of QAHE toward realization of the zero-field resistance standard.
In this Letter, we report instability of the QAHE as functions of electric current and temperature in ferromagnetic 3D TI thin films. The QAHE is broken when the current applied to the QAH conductor exceeds a characteristic value. The characteristic current is roughly proportional to the Hall-bar width, showing relevance of Hall electric field to the breakdown. We also find that variable range hopping (VRH) among localized states contributes to the electron transport at low temperatures. Combining the current and temperature dependences of the longitudinal conductivity in the VRH regime, the localization length of the QAH state is evaluated to be about 5 m. The long localization length as well as the small characteristic current for the QAHE breakdown indicates presence of a large number of in-gap states.
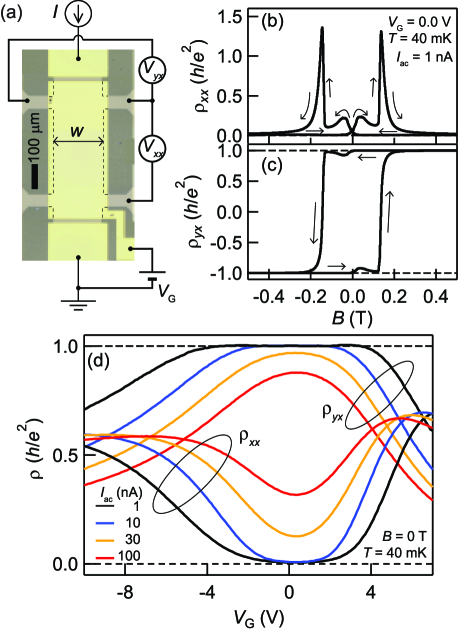
Experiments were conducted using thin films of ferromagnetic TI Crx(Bi1-ySby)2-xTe3 grown on InP (111)A surface by molecular beam epitaxy. The nominal compositions and the film thickness were , , and 9 nm, respectively. The magnetic ions Cr were doped uniformly throughout the film. Details of the growth are described in Ref. Checkelsky . The films were patterned into a Hall-bar shape using photo lithography and chemical wet etching followed by formation of Ti/Au contact electrodes by electron-beam evaporation. Three Hall bars were prepared with different widths = 50, 100, and 200 m [Fig. 1(a)]. To tune the Fermi energy, top gate electrodes (Ti/Au) were formed on the top of the Hall bars after growing aluminum oxide by atomic layer deposition as a gate dielectric. Transport measurements were conducted using standard dc or low-frequency ac lock-in methods in a dilution refrigerator with a base temperature = 40 mK. The longitudinal and the Hall resistivity were calculated by dividing the measured resistances by the aspect ratio of the Hall bars.
The transport properties of the Hall bars clearly exhibit the QAHE as shown in Fig. 1 (b)-(d). When external magnetic field normal to the film was scanned in the positive and negative directions at = 40 mK, - curves make a sharp square hysteresis loop, reflecting changes in the magnetization direction of the film[Fig. 1(c)]. The saturated values of is close to the quantized resistance . The magnetization reversals are accompanied by resistivity peaks in the - curves [Fig. 1(b)]. The values of is close to zero except for the regions of the magnetization reversals (Increase in near zero magnetic fields is attributed to temperature increase upon the magnetic-field polarity reversal during the field scan). Figure 1(d) shows the changes of and when the Fermi energy was tuned by the gate voltage at = 0 T after a magnetic training. A plateau of = appears in the - curve accompanied by nearly vanishing resistivity plateau in the - curve when = 1 nA (black curves). With increasing , the range for the plateau becomes narrower. Above = 30 nA, is largely deviated from and is lifted off from zero even at the plateau center ( = 0 V) which is assigned to the charge neutrality point (CNP).
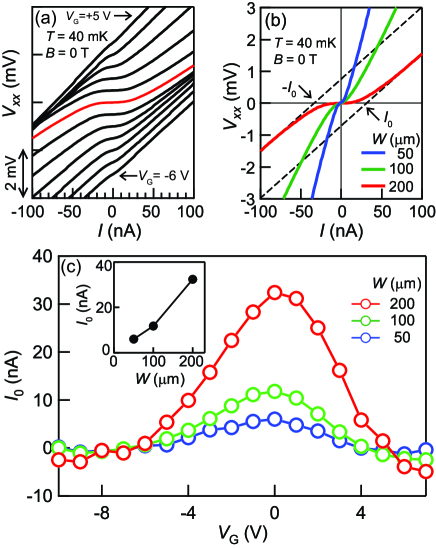
The current-induced breakdown of the QAHE can be seen more clearly in longitudinal voltage-current (-) characteristic curves obtained by the dc measurements. Figure 2(a) shows the - curves for the 200-m-wide Hall bar measured at = 0 T and = 40 mK under various gate voltages. The - curves exhibit non-linear behaviors with suppressed- regions around = 0 nA. As the Fermi energy is detuned from the CNP (a red curve), the range for the suppressed- regime becomes narrower. At the CNP, the value of starts to increase gradually when exceeds about 10 nA. By further increasing above 50 nA, the - curve approaches a straight line with a large slope. Figure 2(b) shows the - curves for the three Hall bars with different widths under tuned to each CNP. The wider range for the suppressed- regime is observed in the wider Hall bars. We define a characteristic current for the crossover from the suppressed- regime to the linear regime by a horizontal intercept of a line fitted to the - curve in the linear regime as shown by dashed lines in Fig. 2(b) (Detailed procedures are described in the Supplemental Materialsuppl ). Figure 2(c) shows variation of as a function of . The value of , which takes a maximum at the CNP, decreases as is detuned from the CNP. As shown in the inset of Fig. 2(c), at the CNP is roughly proportional to the Hall-bar width .
These behaviors of are similar to those of the critical current for the QHE breakdownEbert ; Okuno ; Furlan ; Komiyama , which takes maximum near the center of a QHE plateau and is proportional to the Hall-bar width. The proportionality of to the Hall-bar width indicates that the Hall electric field, which appears between the edge channels across the Hall bar, is relevant to the crossover. In the suppressed- regime around = 0 nA, the back scattering of electrons between the counter-propagating edge channels are suppressed due to the magnetization-induced gap of the top and bottom surfaces. As is increased, the back scattering events start to take place with an assistance of the Hall electric field. The values of are very small compared to a typical critical current for the QHE breakdownEbert ; Okuno ; Furlan . An abrupt jump in , which is usually observed in the case of the QHE breakdown at the critical currentEbert ; Komiyama , was not observed in the present study. The abrupt jump in the QHE breakdown is attributed to thermal instability of the QHE state under a large Hall electric fieldKomiyama . Unlike 2D electron systems in GaAs or graphene, the surface state of the magnetic TI films have short scattering times. We speculate that the short scattering time may prevent the surface electrons from gaining a large kinetic energy to induce the abrupt jump.
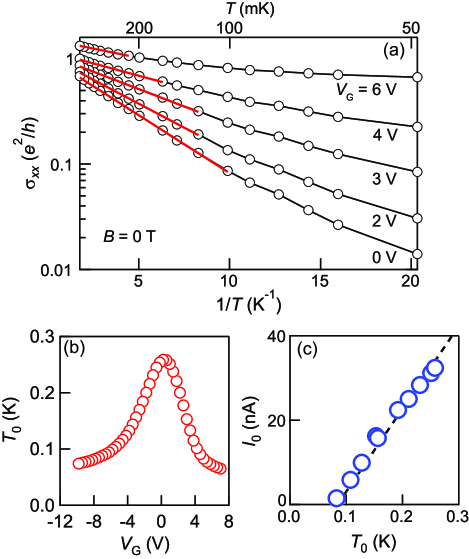
To understand the relation between and the QAHE-observable temperature more quantitatively, we compared to the thermal activation energy evaluated from the temperature dependence of . The values of are calculated from and for each (see Supplemental Materialsuppl for details). Figure 3(a) shows temperature dependence of for the 200-m-wide Hall bar plotted as a function of for several . The thermal activation energy is evaluated by Arrhenius fitting to for each . Figure 3(b) shows the obtained as a function of . The peak value of at the CNP is about 260 mK, which is slightly larger than the value reported in the earlier work on the Cr-doped (Bi, Sb)2Te3 filmsBestwick . Figure 3(c) shows a correlation between and obtained under various . is almost proportional to . The linear relation between and is different from the case of the QHE breakdownOkuno where the critical current increases with the cyclotron energy to the power of 3/2. Although the origin of the different power is not clear for the present, the observed linearity ensures that the stability of the QAHE against current is expected to improve in accordance with the thermal stability.
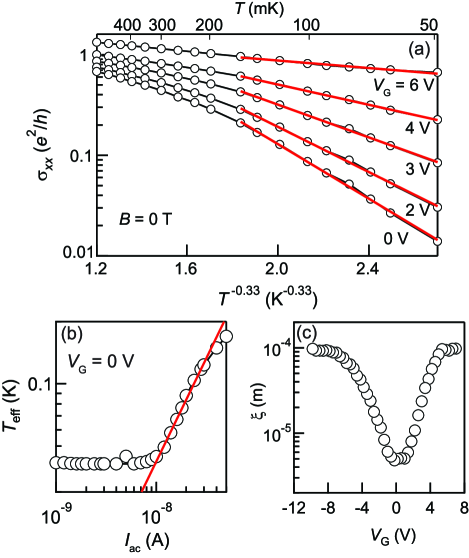
Although follows the thermal activation-type temperature dependence at temperatures above 200 mK, clear deviation from the fitted line can be seen at lower temperatures in Fig. 3(a). The discrepancy suggests involvement of the other transport mechanism, such as variable range hopping (VRH). Given that only the surface states can contribute to the electron transport, the VRH transport would give a temperature dependence in the form of with . By replotting the same data in Fig. 3(a) as a function of , we found that the data points at low temperatures reside on a straight line for each [Fig. 4(a)]. We also analyzed the data using the 3D VRH model and a VRH model with Coulomb interactionsuppl . The experimental data and these models also show good agreements in limited ranges of temperature. Although we cannot distinguish which VRH model is the most preferable, these results indicate that the VRH dominates electron transport at low temperatures. The occurrence of the VRH transport means existence of a large number of in-gap states within the magnetization-induced gap of the surface state.
The VRH behavior allows us to evaluate the localization length by comparing the temperature dependence with the current dependence ), following the earlier work on the localization length analysis in the QHE regimeFurlan . [) is obtained from the similar measurement as in Fig. 1(d). See Supplemental Materialsuppl for the details.] When an electric current is applied to a QAH conductor, a Hall voltage appears between the edge channels. The Hall voltage induces energy difference between the localized states, assisting electron hopping transport among them. Assuming that the energy difference plays the same role as temperature for the electron hopping, the induced energy difference can be regarded as an effective temperature . The effective temperature under application of can be obtained by comparing to point by point. Meanwhile, the averaged energy difference between the localized states can be expressed by , supposing that the each localized state extends spatially over . Thus, using the relation , one can evaluate the localization length from the dependence of on . Note that this localization length analysis does not depend on the details of the VRH modelsuppl .
Figure 4(b) shows the effective temperature as a function of for = 0 V. When is smaller than 10 nA, the VRH transport is dominated by real temperatures so that does not depend on . But when exceeds 10 nA, increases proportionally to . From the coefficient of the linear fitting result, the localization length is evaluated to be 4.8 m. The similar analysis can be performed at each . The obtained localization length is shown in Fig. 4(c) as a function of . The localization length taking a minimum value at around the CNP extends as the Fermi energy is deviated from the CNP. The localization length of the present study is much longer than the typical localization length reported in the QHE (about 100 nm for = 3 Furlan ) even at the CNP. The long localization length indicates that the density of states is still large in the middle of the magnetization-induced gap and that the electrons hop around among these in-gap states.
Possible origins for the formation of the in-gap states include disordered Cr distribution. A spectroscopy-imaging measurementLee revealed that the magnetization-induced gap in Cr-doped (Bi, Sb)2Te3 reaches as large as 30 meV near the region where Cr density is high while it decays as leaving away from the Cr-dense region. Because in the transport measurement reflects the smallest gap region connecting the counter-propagating edge channels, the energy gap of the Cr-sparse region probably contribute to the long . According to a recent theoryYue , the magnetization-induced gap can survive in the presence of such Cr disorder but the gap is largely reduced compared to the case of uniform Cr distribution. We speculate that the observed activation energy may correspond to the reduced magnetization-induced gap. The observation of the VRH transport shows the presence of a number of localized states even in the reduced gap. Other origins of disorder such as Te vacancy or anti-site defect may also contribute to the formation of the in-gap states.
To summarize, we have demonstrated that the QAHE can be broken when the current exceeds a certain value. The characteristic current for the QAHE breakdown is found to be proportional to the Hall-bar width. These features have been discussed in comparison with the QHE breakdown. The small characteristic current is attributed to the small magnetization induced gap containing a large number of in-gap states. Reducing the number of the in-gap states is a key toward a robust QAHE.
Acknowledgements.
We thank T. Morimoto, N. Nagaosa, K. Yasuda, and M. Mogi for fruitful discussions. This research was supported by the Japan Society for the Promotion of Science through the Funding Program for World-Leading Innovative R & D on Science and Technology (FIRST Program) on “Quantum Science on Strong Correlation” initiated by the Council for Science and Technology Policy, JSPS/MEXT Grant-in-Aid for Scientific Research (No. 24224009, 24226002, and 15H05867), and CREST, JST.References
- (1) C. L. Kane and E. J. Mele, Phys. Rev. Lett. 95, 146802 (2005).
- (2) B. A. Bernevig, T. L. Hughes, and S. -C. Zhang, Science 314, 1757 (2006).
- (3) M. Knig et al., Science 318, 766 (2007).
- (4) L. Fu, C. L. Kane and E. J. Mele, Phys. Rev. Lett. 98, 106803 (2007).
- (5) D. Hsieh et al., Nature 460, 1101 (2009).
- (6) C. Brne et al., Phys. Rev. Lett. 106, 126803 (2011).
- (7) M. Z. Hasan and C. L. Kane, Rev. Mod. Phys. 82, 3045 (2010).
- (8) X. -L. Qi and S. -C. Zhang, Rev. Mod. Phys. 83, 1057 (2011).
- (9) R. Yu et al., Science 329, 61 (2010).
- (10) K. Nomura and N. Nagaosa, Phys. Rev. Lett. 106, 166802 (2011).
- (11) Fan Zhang, C. L. Kane, and E. J. Mele, Phys. Rev. Lett. 110, 046040 (2013).
- (12) C. -Z. Chang et al., Science 340, 167 (2013).
- (13) K. v. Klitzing, G. Dorda, and M. Pepper, Phys. Rev. Lett. 45, 494 (1980).
- (14) J. Checkelsky et al., Nature Phys. 10, 731 (2014).
- (15) X. Kou, S. T. Guo, Y Fan, L. Pan, M. Lang, Y. Jiang, Q. Shao, T. Nie, K. Murata, J. Tang, Y. Wang, L. He, T. K. Lee, W. L. Lee, and K. L. Wang, Phys. Rev. Lett. 113, 137201 (2014).
- (16) A. J. Bestwick, E. J. Fox, X. Kou, L Pan, K. L. Wang, D. Goldhaber-Gordon, Phys. Rev. Lett. 114, 187201 (2015).
- (17) M. Mogi et al., Appl. Phys. Lettl 107, 182401 (2015).
- (18) C. -Z Chang, W. Zhao, D. Y. Kim, P. Wei, J. K. Jain, C. Liu, M. H. W. Chan, and J. S. Moodera, Phys. Rev. Lett. 115, 057206 (2015).
- (19) C. -Z. Chang et al., Nature Matter. 14, 473, (2015).
- (20) S. Grauer, S. Schreyeck, M. Winnerlein, K. Brunner, C. Gould, and L. W. Molenkamp, Phys. Rev. B 92, 201304 (2015).
- (21) A. Pertsova, C. M. Canali, and A. H. MacDonald, Phys. Rev. B 94, 121409 (2016).
- (22) W. Li et al., Sci. Rep. 6, 32732 (2016).
- (23) B. Jeckelmann and B. Jeanneret, Rep. Prog. Phys. 64, 1603 (2001).
- (24) A. Tzalenchuk et al., Nature Nanotech. 5, 186 (2010).
- (25) F. Lafont et al., Nature Commun., 6, 6806 (2015).
- (26) See the Supplemental Material at http://link.aps.org/*** for the detailed procedure determining , variable range hopping analysis, and conductivity measurements as functions of and , which includes Ref. Mott .
- (27) N. F. Mott, Metal-insulator transition (Taylor & Francis, London, 1990).
- (28) G. Ebert, K. von Klitzing, K. Ploog, G. Weimann, J. Phys. C 16, 5441 (1983).
- (29) T. Okuno et al., J. Phys. Soc. Jpn. 64, 1881 (1995).
- (30) M. Furlan, Phys. Rev. B 57, 14818 (1998).
- (31) S. Komiyama and Y. Kawaguchi, Phys. Rev. B 61, 2014 (2000).
- (32) I. Lee et al., Proc. Natl. Acad. Sci. U. S. A. 112, 1316 (2015).
- (33) Z. Yue and M. E. Raikh, Phys. Rev. B 94, 155313 (2016).