Extreme Variability in a Broad Absorption Line Quasar
Abstract
CRTS J084133.15+200525.8 is an optically bright quasar at that has shown extreme spectral variability over the past decade. Photometrically, the source had a visual magnitude of between 2002 and 2008. Then, over the following five years, the source slowly brightened by approximately one magnitude, to . Only in 10,000 quasars show such extreme variability, as quantified by the extreme parameters derived for this quasar assuming a damped random walk model. A combination of archival and newly acquired spectra reveal the source to be an iron low-ionization broad absorption line (FeLoBAL) quasar with extreme changes in its absorption spectrum. Some absorption features completely disappear over the 9 years of optical spectra, while other features remain essentially unchanged. We report the first definitive redshift for this source, based on the detection of broad H in a Keck/MOSFIRE spectrum. Absorption systems separated by several 1000 km s-1 in velocity show coordinated weakening in the depths of their troughs as the continuum flux increases. We interpret the broad absorption line variability to be due to changes in photoionization, rather than due to motion of material along our line of sight. This source highlights one sort of rare transition object that astronomy will now be finding through dedicated time-domain surveys.
Subject headings:
galaxies: active — quasars: individual (CRTS J084133.15+200525.8)1. Introduction
For galaxies hosting active galactic nuclei (AGNs), time-domain surveys have long proven to be fertile avenues of research. Indeed, optical continuum variability was recognized as a common feature of quasars shortly after their initial discovery (Matthews & Sandage, 1963), and has since been exploited for purposes ranging from identifying quasars (e.g., van den Bergh et al., 1973), to determining black hole masses through reverberation mapping (e.g., Blandford & McKee, 1982; Bentz et al., 2009), to studying the inner circumnuclear environment (e.g., Risaliti et al., 2002). Recent efforts using wide-area, time-domain surveys have vastly extended this avenue of research by exploring the optical variability of extremely large samples of quasars, numbering in the tens to hundreds of thousands (e.g., Macleod et al., 2012; Graham et al., 2014). Besides determining the light curve properties of typical quasars, such work has identified interesting new phenomenology such as candidate periodic light curves suggestive of sub-parsec binary super-massive black hole systems (e.g., D’Orazio et al., 2015a, b; Graham et al., 2015a, b; Jun et al., 2015b; Liu et al., 2015), AGN undergoing major flaring suggestive of microlensing or explosive activity in the accretion disk such as superluminous supernovae, mergers, or tidal disruption events (e.g., Drake et al., 2011; Lawrence et al., 2016, Graham et al., submitted), and changing look AGN with the abrupt appearance or disappearance of broad emission lines (e.g., LaMassa et al., 2015; Gezari et al., 2017).
One topic where quasar variability has received particular attention has been the temporal characteristics of broad absorption line (BAL) quasars. Specifically, over the past few years, several teams have reported on multi-epoch spectroscopic observations of BAL quasars (e.g., Barlow et al., 1992; Lundgren et al., 2007; Gibson et al., 2008, 2010; Capellupo et al., 2011, 2012, 2013; Filiz Ak et al., 2012, 2013, 2014; Vivek et al., 2012; He et al., 2014, 2015; Joshi et al., 2014; Wildy et al., 2014, 2015; Grier et al., 2015; Zhang et al., 2015). While variability in BAL trough strengths is relatively common, large () changes in the absorption equivalent width is quite rare (e.g., Hall et al., 2011). A primary question in BAL variability studies has been whether observed changes in BAL trough strengths are primarily due to changes in the ionization state of the outflowing wind (e.g., Wang et al., 2015), or whether they are due to high column density BAL clouds moving through our line of sight (e.g., McGraw et al., 2015).
For example, Filiz Ak et al. (2013) present a detailed analysis of BAL troughs identified in 291 quasars observed by the Sloan Digital Sky Survey (SDSS), sampling rest-frame timescales between 1 and 3.7 years. They estimate that the average lifetime of a BAL trough is a few thousand years, and that the emergence/disappearance of BAL features are extremes of general BAL variability. Filiz Ak et al. (2013) also report coordinated BAL variability across multiple troughs at different velocities. They argue that changes in the opacity of the shielding gas producing changes in the ionizing radiation incident on the BAL material are the most probable cause for such coordinated variability.
Grier et al. (2015) and Wildy et al. (2015) reach similar conclusions based on the highly variable BAL lines seen in a spectroscopic monitoring campaigns. With variability seen on time-scales of just a few days, both authors conclude that the most likely cause of such rapid changes is the BAL gas responding to changes in the incident ionizing continuum.
Leading to an alternative explanation of BAL variability, Capellupo et al. (2011, 2012) report on an ongoing monitoring campaign of a sample of 24 BAL quasars at on timescales ranging from months to years. Studying the C IV BAL feature, Capellupo et al. (2011) found variability in 40% of their sample on month-long timescales, and in 65% of their sample on year-long timescales. They find that higher-velocity BALs are more likely to vary than lower-velocity BALs, and that weaker BALs are more likely to vary than stronger BALs. They suggest that the observations are best understood as the movement of clouds within 6 pc of the central engine across the line of sight. In a detailed study of the first observation of P V BAL variability in a quasar, Capellupo et al. (2014) argue that the observations are best described by a BAL cloud at a distance of pc moving across the line sight. The implied kinetic energy of the outflow would be of the quasar bolometric luminosity, which is sufficient to cause substantial feedback.
Also supporting this interpretation that BAL variability is not dominated by photoionization, He et al. (2014) report on 18 epochs of SDSS/BOSS spectroscopy of a BAL quasar at . They find only a weak correlation between the BAL variability and the continuum luminosity, suggesting that continuum changes are not driving changes in the BAL trough amplitudes.
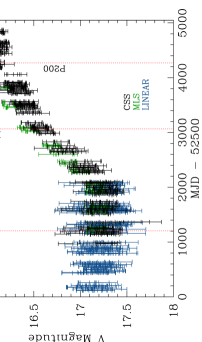
Here, we report on CRTS J084133.15+200525.8 (CRTS J0841+2005), an optically bright quasar that has shown extreme variability over the past decade (Figure 1). The quasar transitioned from having a relatively stable visual magnitude of between 2002 and 2008, to slowly brightening by a factor of over the course of 5 years and then plateauing at . As detailed below, a combination of archival and newly acquired spectroscopy reveal this source to be an iron low-ionization broad absorption line (FeLoBAL) quasar exhibiting extreme spectroscopic changes over the same time period, and the nature of these variations allow us to assess the likely cause of the BAL trough variability.
Independent of our own work on CRTS J0841+2005, Rafiee et al. (2016) recently reported on this same source as part of a sample of three FeLoBAL quasars that have shown significant spectroscopic variability over the past decade. Interestingly, all three show decreasing strength of their low-ionization iron absorption. The current paper has several additions relative to that work. Specifically, we provide new data on CRTS J0841+2005, including a new epoch of optical spectroscopy which demonstrates continued spectral changes, and a near-infrared spectrum which provides the first precise redshift for the quasar as well as an estimate of its black hole mass. Finally, Rafiee et al. (2016) remain agnostic as to whether absorber transverse motion or ionization variability is the more likely cause of the changes in the absorption troughs of this source. In contrast, the additional epoch of Palomar spectroscopy presented here allows us to argue that ionization variability is the more likely cause of the extreme absorption variability seen in CRTS J0841+2005.
Throughout this paper, we use Vega magnitudes unless otherwise indicated and we adopt the concordance cosmology, , and .
2. Data and Results
2.1. Optical Light Curve
The Catalina Real-time Transient Survey111See crts.caltech.edu/. (CRTS; Drake et al., 2009) leverages the Catalina Sky Survey, designed to search for near-Earth objects, as a probe of the time-variable universe. CRTS has used three telescopes for much of the past decade, two in the northern hemisphere and one in Australia, to cover up to per night. The filterless observations are broadly calibrated to Johnson (for details, see Drake et al., 2013) with a nominal depth of . The full CRTS data set contains time series for approximately 500 million sources.222See http://catalinadata.org/.
CRTS represents the best data set currently available with which to systematically study quasar variability with large samples over a decade-length timescale. In an analysis of characteristic timescales of 240,000 known spectroscopically confirmed objects using Slepian wavelet variance, Graham et al. (submitted) originally identified CRTS J0841+2005 as an extreme outlier in the plane defined by a linear trend (the Thiel-Sen statistic) and deviation from the median Slepian wavelet variance fit. In that analysis, CRTS J0841+2005 has a characteristic timescale days, which is significantly larger than expected for a quasar of its magnitude, days.
If we instead characterize quasar light curves with a Gaussian process damped random walk model and only consider the subset of 79,749 quasars with at least 200 CRTS photometric measurements, CRTS J0841+2005 again stands out. The two parameters from this model are the amplitude, , and the characteristic timescale, , of the damped random walk (e.g., Kelly et al., 2009). We use a kernel density estimator to determine the distribution of sources in the plane, and we find that CRTS J0841+2005 resides in an extreme location in this plane (, where is the density of sources in this plane). Only seven quasars stand out at this level or more from the population distribution, implying that only in 10,000 quasars show variability behavior as extreme as CRTS J0841+2005. Further inspection of the CRTS light curve of CRTS J0841+2005 (Figure 1) also indicates that the variable behavior is different from the expected stochastic damped random walk model that describes most quasars, and instead appears more consistent with a state change. Further support for this interpretation comes from earlier photometry of CRTS J0841+2005 reported in Rafiee et al. (2016) from the Palomar Sky Surveys (POSS-I, Palomar Quick V, and POSS-II), reaching back to the mid-1950s. Rafiee et al. (2016) reports no evidence for a significant change in the optical brightness of CRTS J0841+2005 prior to 2000.
SDSS imaged CRTS J0841+2005 on UT 2004 December 12 (MJD = 53351), which is prior to the brightening episode. The source was unresolved, and based on its unusual and red colors, SDSS targeted CRTS J0841+2005 for spectroscopic observations as a high-redshift quasar candidate.
2.2. Optical Spectroscopy
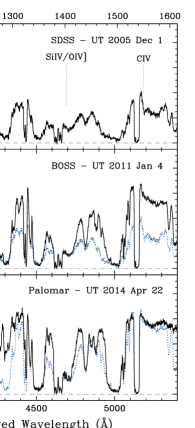
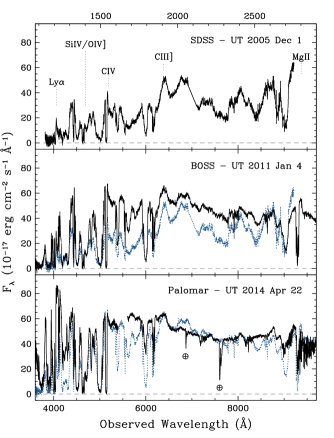
CRTS J0841+2005 was first observed spectroscopically by SDSS on UT 2005 December 1 (MJD = 53705; Blanton et al., 2003) and was then re-observed by SDSS-III BOSS on UT 2011 January 4 (MJD = 55565; Dawson et al., 2013). The spectra, shown in Figure 2, show a source with many absorption features, making redshift identification challenging. Indeed, the SDSS data releases have reported a variety of redshifts for CRTS J0841+2005, always with warning flags, ranging from (DR8; Warning = Many Outliers) to (DR7; zStatus = Failed) to (DR9; Warning = Negative Emission). Our visual inspection of the BOSS spectrum tentatively identified Mg II and Fe II blends in the region around 9400 Å, implying , consistent with both the visual inspection value of in the SDSS DR12 quasar catalog (DR12Q; Pâris et al., 2014) and the results of our Keck infrared spectrum described in §2.4.
We obtained additional optical spectroscopy of CRTS J0841+2005 using the Double Spectrograph on the Hale 200” Telescope at Palomar Observatory on UT 2014 April 22 (MJD = 56769). We obtained two 600 s exposures using the 1.0′′ slit in cloudy conditions. The data were reduced using standard procedures and relative spectrophotometric calibration was achieved using observations of standard stars obtained on the same night. Figure 2 presents the Palomar data, where we have scaled the spectra so that the long wavelength ( Å) part of the spectra is of comparable flux density to the BOSS spectrum at the same wavelengths.
The multi-epoch spectra show the extreme variability exhibited by CRTS J0841+2005, as well as multiple strong absorption features, characteristic of an FeLoBAL quasar. FeLoBALs are notoriously challenging targets for redshift identification (e.g., Becker et al., 1997; Brunner et al., 2003). We see dramatic changes across the full spectrum, particularly in the spectral region between redshifted Ly and C IV. Some features do not change across the near-decade timescale of the spectroscopy, such as the saturated C IV absorption at 5150 Å. Other features completely disappear, such as absorption lines at 5450 and 8500 Å. There is an overall uncovering of blue continuum emission, with the flux around Ly increasing by an order of magnitude over the years spanned by the spectroscopy. In addition, while the continuum between C III] and Mg II is extremely choppy in the 2005 spectrum, by 2014 it is smoother, which is more typical of normal quasar spectra.
2.3. Imaging at Other Wavelengths
CRTS J0841+2005 is a bright near- to mid-infrared source, well detected by both the Two Micron All Sky Survey ( — 2MASS; Skrutskie et al., 2006) and the Wide-field Infrared Survey Explorer ( — WISE; Wright et al., 2010). With , CRTS J0841+2005 is slightly bluer than the mid-infrared AGN selection criteria of Stern et al. (2012), which are and . However, as shown in Assef et al. (2013), the AGN selection color can be relaxed for brighter sources.
There is little variability detected at longer wavelengths in this source. In AB magnitudes, the -band magnitude recorded by SDSS was on MJD 53351, closely matching the -band magnitude of recorded by UKIRT Infrared Deep Sky Survey (UKIDSS; Lawrence et al., 2007) on MJD 55141. In the near-infrared (in Vega magnitudes), 2MASS recorded and on MJD 51105, closely matching the UKIDSS values of on MJD 54061 and on both MJD 54061 and MJD 55238, where we have assumed a 2% floor on the UKIDSS photometric calibration (e.g., Hodgkin et al., 2009). Similarly, the mid-infrared flux measured by WISE and NEOWISE (Mainzer et al., 2014) varies by only mag, comparable to the typical uncertainty.
CRTS J0841+2005 is not detected by ROSAT, nor was it (serendipitously) observed by either the Chandra X-Ray Observatory or XMM-Newton. CRTS J0841+2005 is also not detected by the Faint Images of the Radio Sky at Twenty cm survey (FIRST; Becker et al., 1995), implying mJy (). Finally, as expected, observations by the Galaxy Evolution Explorer (GALEX; Martin et al., 2005), which sample below the Lyman limit for , do not detect CRTS J0841+2005.
2.4. Near-infrared Spectroscopy
We obtained a -band (1.95-2.39 m) spectrum of CRTS J0841+2005 with the Multi-Object Spectrometer for InfraRed Exploration (MOSFIRE; McLean et al., 2012; Steidel et al., 2014) on UT 2014 May 5 (MJD=56782) in longslit mode. We obtained three dithered exposures of 180 s each through a 07 entrance slit under clear conditions with good seeing. The spectrum was reduced using a combination of the MOSFIRE data reduction pipeline (DRP) and custom routines (for details, see Steidel et al., 2014). Wavelength calibration was based on a combination of OH emission lines in the night sky and an internal Ne arc lamp. Flux calibration and telluric absorption removal was accomplished using spectra of an A0V star (Vega analog) observed at similar airmass. The final extracted spectrum (Figure 3) shows strong continuum and a single broad emission line with a peak at 2.1956 m, which we identify as H at . The apparent asymmetry in the continuum straddling the line is well modeled by the Boroson & Green (1992) Fe II template on the blue side of the line.
We use the broad H emission line to estimate the mass of the black hole in CRTS J0841+2005. First, we apply a multiplicative correction to the -band spectrum to match the -band photometry from the UKIDSS observations. We then approximate the uncertainties in the spectrum by considering the standard deviation of the spectrum outside the strong emission line. We model the H spectral region as the sum of two broad Gaussian lines, a single narrow Gaussian, an iron template (which elevates the continuum on the blue side of the emission line), and a power-law continuum. The full-width at half-maximum (FWHM) of the broad H emission is , and the combined luminosity of the broad H components is . Modeling the broad-band (3000Å to 7m) spectral energy distribution of the quasar as a sum of a power-law continuum, two blackbody thermal components (500 and 1250 K, to model the rest-frame IR emission), and line emission from H and Fe II as determined from the Keck spectrum, we derive . Following Jun et al. (2015a), we derive using the estimator and using the estimator. We note that these statistical error bars underestimate the true uncertainty, both due to the non-simultaneity of the imaging and near-infrared spectroscopy and, more importantly, the systematic uncertainty in the virial scale factor, , which is the typically the dominant source of uncertainty in black hole mass measurements; in this case, we adopt from Woo et al. (2013), as per Jun et al. (2015a).
For comparison, without access to any well-detected emission features, Rafiee et al. (2016) simply adopted a black hole mass of as a typical value. Adopting their value for the bolometric luminosity of CRTS J0841+2005, (based on the observed rest-frame 2900 Å flux density and a bolometric correction of from Richards et al., 2006), we determine an Eddington ratio of (in comparison to their value of 0.45).

3. Discussion
Figure 4 shows a comparison between the long wavelength portion of the three epochs of optical spectroscopy. In the spectral region beyond Å there is much less blending of troughs from different ions, making the variability changes simpler to interpret. We identify two primary absorption systems. The first system, A, shows several troughs of Fe II UV absorption between 7500 and 8900 Å, as well as Mg II absorption at 9050 Å. The other system, B, shows Mg II absorption at 9300 Å. The two absorption systems are separated by 9000 km s-1, yet show coordinated reductions in the depth of their troughs as the quasar brightens. This is the expected behavior if the BAL spectral variability is driven by changes in the photoionization: as the ionizing continuum flux increases, the column densities of Fe II and Mg II decrease for all clouds along the line of sight. (Note that this expectation assumes that the ionizing continuum changes are correlated with the flux changes around 2500 Å). The scenario of clouds moving across our line of sight is hard pressed to explain both the coordinated changes of the trough depths as well as the observed trough weakening with increasing UV flux. A priori, there is no reason that troughs as widely separated in velocity as A and B would be correlated since they are different parcels of gas. Even more so, there is no reason in this scenario for changes in the trough depths to be correlated with flux changes. Therefore, we interpret the variability in the absorption troughs to be due to changes in photoionization, rather than motion of material into our line of sight. A follow-up paper will more carefully model the full multi-epoch spectroscopic data set, including additional spectroscopy from our continuing monitoring, with the goal of understanding the location and energetics of the outflow, and its impact on the host galaxy (Chamberlain et al., in preparation).
CRTS J0841+2005 appears to be an FeLoBAL quasar in the process of transitioning to a more common low-ionization BAL (LoBAL) quasar, similar to FBQS J1408+3054 reported by Hall et al. (2011). We note, however, that Hall et al. (2011) interpreted the variability in that source as being related to structure in the BAL outflow moving out of our line of sight rather than being related to photoionzation changes.
CRTS J0841+2005 highlights the sort of rare, extremely variable quasars that can be used to probe the physics of quasar outflows. We expect to find many more such examples with the new generation of wide-area, sensitive, high-cadence synoptic surveys. We were fortuitous in this case that multi-epoch archival spectroscopy was available for this source. In the future, it will be exciting to find similar major events in real time, allowing real-time multi-wavelength follow-up in order to more fully dissect the internal workings of AGN engines.
References
- Assef et al. (2013) Assef, R. J., Stern, D., Kochanek, C. S., et al. 2013, ApJ, 772, 26
- Barlow et al. (1992) Barlow, T. A., Junkkarinen, V. T., Burbidge, E. M., Weymann, R. J., Morris, S. L., & Korista, K. T. 1992, ApJ, 397, 81
- Becker et al. (1997) Becker, R. H., Gregg, M. D., Hook, I. M., McMahon, R. G., White, R. L., & Helfand, D. J. 1997, ApJ, 479, 93
- Becker et al. (1995) Becker, R. H., White, R. L., & Helfand, D. J. 1995, ApJ, 450, 559
- Bentz et al. (2009) Bentz, M. C., Walsh, J. L., Barth, A. J., et al. 2009, ApJ, 705, 199
- Blandford & McKee (1982) Blandford, R. D. & McKee, C. F. 1982, ApJ, 255, 419
- Blanton et al. (2003) Blanton, M. R., Lin, H., Lupton, R. H., et al. 2003, AJ, 125, 2276
- Boroson & Green (1992) Boroson, T. A. & Green, R. F. 1992, ApJS, 80, 109
- Brunner et al. (2003) Brunner, R. J., Hall, P. B., Djorgovski, S. G., et al. 2003, AJ, 126, 53
- Capellupo et al. (2014) Capellupo, D. M., Hamann, F., & Barlow, T. A. 2014, MNRAS, 444, 1893
- Capellupo et al. (2013) Capellupo, D. M., Hamann, F., Shields, J. C., Halpern, J. P., & Barlow, T. A. 2013, MNRAS, 429, 1872
- Capellupo et al. (2011) Capellupo, D. M., Hamann, F., Shields, J. C., Rodríguez Hidalgo, P., & Barlow, T. A. 2011, MNRAS, 413, 908
- Capellupo et al. (2012) —. 2012, MNRAS, 422, 3249
- Dawson et al. (2013) Dawson, K. S., Schlegel, D. J., Ahn, C. P., et al. 2013, AJ, 145, 10
- D’Orazio et al. (2015a) D’Orazio, D. J., Haiman, Z., Duffell, P., Farris, B. D., & MacFadyen, A. I. 2015a, MNRAS, 452, 2540
- D’Orazio et al. (2015b) D’Orazio, D. J., Haiman, Z., & Schiminovich, D. 2015b, Nature, 525, 351
- Drake et al. (2013) Drake, A. J., Catelan, M., Djorgovski, S. G., et al. 2013, ApJ, 763, 32
- Drake et al. (2009) Drake, A. J., Djorgovski, S. G., Mahabal, A., et al. 2009, ApJ, 696, 870
- Drake et al. (2011) Drake, A. J., Graham, M. J., Djorgovski, S. G., et al. 2011, ApJS, 213, 9
- Filiz Ak et al. (2012) Filiz Ak, N., Brandt, W. N., Hall, P. B., et al. 2012, ApJ, 757, 114
- Filiz Ak et al. (2013) —. 2013, ApJ, 777, 168
- Filiz Ak et al. (2014) —. 2014, ApJ, 791, 88
- Gezari et al. (2017) Gezari, S., Hung, T., Cenko, S. B., et al. 2017, ApJ, 835, 144
- Gibson et al. (2010) Gibson, R. R., Brandt, W. N., Gallagher, S. C., Hewett, P. C., & Schneider, D. P. 2010, ApJ, 713, 220
- Gibson et al. (2008) Gibson, R. R., Brandt, W. N., Schneider, D. P., & Gallagher, S. C. 2008, ApJ, 675, 985
- Graham et al. (2014) Graham, M. J., Djorgovski, S. G., Drake, A. J., et al. 2014, MNRAS, 439, 703
- Graham et al. (2015a) Graham, M. J., Djorgovski, S. G., Stern, D., et al. 2015a, Nature, 518, 74
- Graham et al. (2015b) —. 2015b, MNRAS, 453, 1562
- Grier et al. (2015) Grier, C. J., Hall, P. B., Brandt, W. N., et al. 2015, ApJ, 806, 111
- Hall et al. (2011) Hall, P. B., Anosov, K., White, R. L., et al. 2011, MNRAS, 411, 2653
- He et al. (2014) He, Z., Bian, W., Ge, X., & Jiang, X. 2014, MNRAS, 443, 2532
- He et al. (2015) —. 2015, MNRAS, 454, 3962
- Hodgkin et al. (2009) Hodgkin, S. T., Irwin, M. J., Hewett, P. C., & Warren, S. J. 2009, MNRAS, 394, 675
- Joshi et al. (2014) Joshi, R., Chand, H., Srianand, R., & Majumdar, J. 2014, MNRAS, 442, 862
- Jun et al. (2015a) Jun, H. D., Im, M., Lee, H. M., et al. 2015a, ApJ, 806, 109
- Jun et al. (2015b) Jun, H. D., Stern, D., Graham, M. J., et al. 2015b, ApJ, 814, L12
- Kelly et al. (2009) Kelly, B. C., Bechtold, J., & Siemiginowska, A. 2009, ApJ, 698, 895
- LaMassa et al. (2015) LaMassa, S. M., Cales, S., Moran, E. C., et al. 2015, ApJ, 800, 144
- Lawrence et al. (2016) Lawrence, A., Bruce, A. G., MacLeod, C., et al. 2016, MNRAS, 463, 296
- Lawrence et al. (2007) Lawrence, A., Warren, S. J., Almaini, O., et al. 2007, MNRAS, 379, 1599
- Liu et al. (2015) Liu, T., Gezari, S., Heinis, S., et al. 2015, ApJ, 803, 16
- Lundgren et al. (2007) Lundgren, B. F., Wilhite, B. C., Brunner, R. J., et al. 2007, ApJ, 656, 73
- Macleod et al. (2012) Macleod, C. L., Ž. Ivezić, Sesar, B., et al. 2012, ApJ, 753, 106
- Mainzer et al. (2014) Mainzer, A., Bauer, J., Grav, T., et al. 2014, ApJ, 784, 110
- Martin et al. (2005) Martin, D. C., Schiminovick, D., Barlow, T. A., et al. 2005, ApJ, 619, L1
- Matthews & Sandage (1963) Matthews, T. A. & Sandage, A. R. 1963, ApJ, 138, 30
- McGraw et al. (2015) McGraw, S. M., Shields, J. C., Hamann, F. W., Capellupo, D. M., Gallagher, S. C., & Brandt, W. N. 2015, MNRAS, 453, 1379
- McLean et al. (2012) McLean, I. S., Steidel, C. C., Epps, H., et al. 2012, SPIE, 8446, 17
- Pâris et al. (2014) Pâris, I., Petitjean, P., Aubourg, E., et al. 2014, A&A, 563, 54
- Rafiee et al. (2016) Rafiee, A., Pirkola, P., Hall, P. B., Galati, N., Rogerson, J., & Ameri, A. 2016, MNRAS, 459, 2472
- Richards et al. (2006) Richards, G. T., Lacy, M., Storrie-Lombardi, L. J., et al. 2006, ApJS, 166, 470
- Risaliti et al. (2002) Risaliti, G., Elvis, M., & Nicastro, F. 2002, ApJ, 571, 234
- Sesar et al. (2011) Sesar, B., Scott, S. J., Zeljko, I., Morgan, D. P., Becker, A. C., & Woźniak, P. 2011, AJ, 142, 190
- Skrutskie et al. (2006) Skrutskie, M. F., Cutri, R. M., Stiening, R., et al. 2006, AJ, 131, 1400
- Steidel et al. (2014) Steidel, C. C., Rudie, G. C., Strom, A. L., et al. 2014, ApJ, 795, 165
- Stern et al. (2012) Stern, D., Assef, R. J., Benford, D. J., et al. 2012, ApJ, 753, 30
- van den Bergh et al. (1973) van den Bergh, S., Herbst, E., & Pritchet, C. 1973, AJ, 78, 375
- Vivek et al. (2012) Vivek, M., Srianand, R., Petitjean, P., Noterdaeme, P., Mohan, V., Mahabal, A., & Kuriakose, V. C. 2012, MNRAS, 423, 2879
- Wang et al. (2015) Wang, T., Yang, C., Wang, H., & Ferland, G. 2015, ApJ, 814, 150
- Wildy et al. (2014) Wildy, C., Goad, M. R., & Allen, J. T. 2014, MNRAS, 437, 1976
- Wildy et al. (2015) —. 2015, MNRAS, 448, 2397
- Woo et al. (2013) Woo, J., Schulze, A., Park, D., Kang, W., Kim, S. C., & Riechers, D. A. 2013, ApJ, 772, 49
- Wright et al. (2010) Wright, E. L., Eisenhardt, P. R. M., Mainzer, A. K., et al. 2010, AJ, 140, 1868
- Zhang et al. (2015) Zhang, S., Zhou, H., Wang, T., et al. 2015, ApJ, 803, 58