Diversity of dwarf galaxy IR-submm emission patterns: CLUES from hydrodynamical simulations
Abstract
Context. The spectral energy distributions (SEDs) of low-mass low-metallicity (dwarf) galaxies are a challenging piece of the puzzle of galaxy formation in the near Universe. These SEDs show some particular features in the submillimeter to far-infrared wavelength range compared to normal larger galaxies that cannot be explained by the current models.
Aims. We aim to explain the particular emission features of low-mass low-metallicity galaxies in the IR-submm range, which are: a broadening of the IR peak, which implies a warmer dust component; an excess of emission in the submm (500 m), that causes a flattening of the submm/far-IR slope; and a very low intensity of polycyclic aromatic hydrocarbon emission features.
Methods. The SEDs of a sample of 27 simulated dwarf galaxies were calculated using the GRASIL-3D radiative transfer code. This code has the particularity that it separately treats the radiative transfer through dust grains within molecular clouds and within the cirrus, the dense and diffuse components of the gas phase, respectively. The simulated galaxies have stellar masses ranging from - M⊙, and were obtained from a single simulation run within a Local Group environment with initial conditions from the CLUES project.
Results. We report a study of the IRAS, Spitzer, and Herschel bands luminosities, and of the star formation rates, dust, and gas (HI and H2) mass contents. We find a satisfactory agreement with observational data, with GRASIL-3D naturally reproducing the specific spectral features mentioned above.
Conclusions. We conclude that the GRASIL-3D two-component dust model gives a physical interpretation of the emission of dwarf galaxies: molecular clouds and cirrus represent the warm and cold dust components, respectively, needed to reproduce observational data.
Key Words.:
Methods: numerical - Galaxies: dwarf - Infrared: galaxies - Submillimeter: galaxies - Radiative transfer - dust, extinction1 Introduction
Dwarf galaxies are currently among the less evolved galactic environments: they are places where active star formation is most likely to be found, and where metallicity is low, and even very low. Dwarfs are therefore systems of low stellar mass and low metallicity. These characteristics have recently deepened the interest in studying star-forming dwarfs as ideal laboratories to possibly anticipate some details of star formation at high redshift. Metallicity (the mass fraction of heavy elements in the interstellar medium; ISM) is a key parameter when studying galaxy evolution, and it determines the dust mass fraction in the gas. Dust forms from the available heavy elements from supernova core-collapse and the outflows from low-mass stars (see for example Todini & Ferrara 2001; Gomez et al. 2012a, b; Indebetouw et al. 2014; Rowlands et al. 2014; Matsuura et al. 2015).
The dust cycle in the ISM is a crucial piece in the process of star formation. Star-forming regions are embedded in the densest pieces of the ISM, the so-called molecular clouds (MCs). Dust grains therein are heated by energetic UV photons that are emitted by young stars (Kennicutt 1998; Kennicutt et al. 2009a), which are particularly susceptible to be absorbed and reemitted in the IR spectral range. Dust absorption of UV photons in MCs retards molecule dissociation. In this way, it is an essential piece in the process of ISM cooling, thus facilitating star formation. Dust in the diffuse gas (cirrus) absorbs light from older stars. It is a matter of debate whether MCs are also UV photon emitters, or if no UV radiation can escape from them (see for example Boquien et al. 2011a; Bendo et al. 2012a).
Dust emission from dwarf galaxies differs considerably from that of more metal-rich galaxies. They harbor warmer dust, have lower dust-to-gas ratios, present lower polycyclic aromatic hydrocarbon (PAH) band emission, have broader IR spectral energy distribution (SED) peaks, and show a flattening of the far-IR/submm slope (the so-called submm excess). The all-sky IRAS infrared telescope, which revolutionized our idea of the infrared Universe, was the first to detect warmer dust in galaxies (e.g., Helou 1986; Melisse & Israel 1994; Galliano et al. 2003). It was followed up by the Spitzer mission 20 years later, which enabled a deeper study of the precise sources found previously by IRAS, and it ratified its warm dust findings (e.g., Galliano et al. 2005; Rosenberg et al. 2006; Cannon et al. 2006; Galametz et al. 2009). More recent investigations have reported broad and flat IR SEDs in dwarf galaxies, further showing that all the peculiarities described previously are more dramatic in the most actively star-forming dwarfs (e.g., Boselli et al. 2010, 2012b; Smith et al. 2012; Ciesla et al. 2014). However, no very low-metallicity () galaxies were the subjects of these studies.
An important step forward has been made thanks to the Herschel guaranteed time key program on dwarf galaxies, the so-called Dwarf Galaxy Survey (DGS, Madden et al. 2013), which includes the galaxies with the lowest metallicity in the local Universe. Subsequent systematic studies (Rémy-Ruyer et al. 2013, 2014, 2015) essentially confirmed previous results. In addition, the Herschel Astrophysical Terahertz Large Area Survey (-ATLAS, Eales et al. 2010) provided an unbiased view of the dusty Universe. In particular, a dust-selected sample of local galaxies was made available for the first time, analyzed at high resolution with the sensitivity of Herschel. This is the Herschel-ATLAS Phase-1 Limited-Extent Spatial Survey, (HAPLESS Clark et al. 2015),which spans a range of in stellar masses, therefore containing dwarf galaxies. The analysis of this survey revealed the diverse IR properties of local dust-selected galaxies, including again SED IR peak broadening and slope flattening.
In these pioneering analyses of dwarf galaxies it is generally assumed that these characteristics may be evidence of either an additional warm dust component or a lower-than-Galactic dust emissivity index taking values, or both. Specifically, flux densities are modeled as modified black bodies following
| (1) |
where is the effective slope in the FIR-submm region, m is the reference wavelength, and is the Planck function. In order to fit the data, observers therefore change their modeling in the FIR-submm range relative to the standard fixed , which is appropriate for normal galaxies (e.g., Boselli et al. 2012a; Rémy-Ruyer et al. 2013) and/or add new ad hoc additional dust components to it (double black bodies at different temperatures, see e.g., Galametz et al. 2012; Rémy-Ruyer et al. 2014, 2015; Clark et al. 2015). In particular, this latter method is needed to fit the IR peak broadening that is observed at wavelengths lower than m. This excess of mid-IR (MIR) emission cannot be accounted for through a unique modified black body fitting. For example, HAPLESS analyses find that the flux density modeling through Eq. 1 with fixed underestimates fluxes at 100 and 500 m, while overestimating them at 160 m. Therefore these analyses use a two-temperature component with fixed . On the other hand, Rémy-Ruyer et al. (2015) use a second warmer dust component to cure their FIR-submm dust modeling of a lack of photons in the MIR range of some DGS galaxies, when necessary.
These empirical modelings have provided very valuable estimates of dust masses, temperatures, and emissivity indices of their analyzed galaxies. A step further to solve the problem of dwarf galaxy SED peculiarities can be gained by analyzing dwarf emission in a controlled scheme, that is to say, when some information is available about the nature and intrisic SEDs of the dust heating sources and on the dust components’ (cirrus + molecular clouds) properties and space configurations. This is the case of hydrodynamical simulations.
Two different approaches, both requiring completion with a radiative transfer code to calculate dust effects on the SEDs, can be followed in this regard. A first procedure is through simulations that include dust formation and evolution in a self-consistent manner (improving one and two-zone models, e.g., Dwek 1998; Lisenfeld & Ferrara 1998; Hirashita & Ferrara 2002; Calura et al. 2008; Asano et al. 2013, in that they provide spatial structure). These models (e.g., Bekki 2013, 2015a, 2015b; McKinnon et al. 2016; Aoyama et al. 2017) include dust formation from stellar evolution and supernova (SN) explosions, dust evolution processes such as grain growth and destruction in the ISM, and dust effects on galaxy evolution, such as radiation fields effects, star formation, and dust-enhanced H2 formation. The effects of dust in galaxy evolution could be important, and studying them self-consistently through hydrodynamical simulations is a very good approach. This emerging method is still in its infancy, and considerable work remains to be done. Ultimately it will provide a refined estimate of dust properties (e.g., composition, size distribution, and dust-to-gas mass ratio) in terms of evolutionary paths, and also in terms of redshift. At the moment, this method gives different possible solutions that need to be tuned against observational data.
A second possibility is to study dust effects on the SEDs of simulated galaxies from the outputs of standard hydrodynamical simulations that do not include dust formation and evolution, but nevertheless produce realistic galaxies at given redshifts. In order to study the SEDs of local (i.e., at redshift =0) dwarf galaxies, their dust properties at =0 are needed. These can be well approximated by methods other than using simulations where dust formation and evolution is self-consistently implemented, for example, following the extensively used models by Weingartner & Draine (2001); Draine (2003); Draine & Li (2007) or Zubko et al. (2004), among others, which have been thoroughly examined to reproduce observational data.
A few codes exist that interface with the outputs of hydrodynamical simulations to solve the radiative transfer through dust and predict a multiwavelength SED for simulated galaxies. For example, SKIRT and its updated version (Baes & Dejonghe 2002; Baes et al. 2005, 2011; Steinacker et al. 2013), SUNRISE (Jonsson 2004, 2006; Jonsson et al. 2009), RADISHE (Chakrabarti et al. 2008; Chakrabarti & Whitney 2009), and Art2 (Li et al. 2007, 2008; Yajima et al. 2012) all use Monte Carlo techniques to follow the radiation of photons through the ISM and calculate a global radiation field and hence the dust reemission. In addition, SUNRISE includes the treatment of star-forming regions using the dust and photoionization code MAPPINGSIII (Groves et al. 2008).
In a somewhat different context, the dust radiative-transfer code GRASIL (Silva et al. 1998; Silva 1999, hereafter S98 and S99, respectively) has been used highly successfully for many years, in particular in combination with semianalytical models of galaxy formation such as GALFORM (Cole et al. 2000; Granato et al. 2000; Baugh et al. 2005; Lacey et al. 2008), MORGANA (Monaco et al. 2007; Fontanot et al. 2008, 2009), and ABC (Granato et al. 2004; Silva et al. 2005; Lapi et al. 2006; Cook et al. 2009). The 3D version of GRASIL, GRASIL-3D (see Domínguez-Tenreiro et al. 2014, hereafter DT14), can be interfaced with the outputs of hydrodynamical codes of galaxy formation, producing observation-like multiwavelength SEDs of simulated galaxies while inheriting GRASIL code strengths.
Following GRASIL, some GRASIL-3D particular strengths relative to the codes quoted above can be summarized as follows. i) The radiative transfer is not solved through Monte Carlo methods, but in a grid. ii) The code separately treats the radiative transfer in molecular clouds (MCs) and in the diffuse cirrus component, whose dust compositions are different. We note that MCs are not resolved in simulations, and therefore a subresolution modeling is introduced. iii) It takes into account the fact that younger stars are associated with denser ISM environments by means of an age-dependent dust reprocessing of stellar populations (note that GRASIL has been the first model to do so), mimicking through the parameter the time young stars are enshrouded within MCs before their destruction. iv) It includes a detailed non-equilibrium calculation for dust grains with diameter smaller than Å, allowing for a proper treatment of PAH features, which dominate the MIR in some cases.
The aim of this work is to provide a physically based explanation to the particular emission patterns dwarf galaxies show in the IR-submm range111We do not intend to provide fittings to observed individual dwarf galaxy IR SEDs, since the precise baryon 3D distributions and star formation histories of simulated galaxies do not have free parameters. . As described above, these can be summarized as (Rémy-Ruyer et al. 2013) (1) a broadening of the IR peak of the SED, which implies a warmer dust component; (2) an excess of emission in the submm (500 m) that causes a flattening of the submm/FIR slope; and (3) a very low intensity of PAH emission features. This is done by studying the IR SEDs of a sample of 27 star-forming dwarf galaxies that are identified in a hydrodynamical simulation of the local Universe. This simulation does not include dust evolution self-consistently, but as we show, it produces realistic dwarf galaxies. The SEDs have been obtained with GRASIL-3D.
The paper is organized as follows: Section 2 describes the simulation and the important characteristics of the GRASIL-3D radiative transfer code. Sections 3 and 4 present the sample of simulated star-forming dwarf galaxies and the observational galaxies with which the results are compared. Sections 5 and 6 show the general properties and the IR and submm emission of the sample of simulated galaxies. In Sect. 7 we discuss the results with regard to the physics that drives the existence of an additional warm dust component and the effects of varying the free parameters of GRASIL-3D. Finally, our study is summarized in Sect. 8.
2 Method
2.1 Simulation
2.1.1 Initial conditions and run: the CLUES project
The sample of simulated dwarf galaxies is taken from a single simulation with initial conditions from the Constrained Local UniversE Simulations (CLUES) project222http://clues-project.org/ (Gottloeber et al. 2010; Yepes et al. 2014), where peculiar velocities obtained from catalogs are imposed as constraints on the initial conditions in order to simulate a cosmological volume that is representative of our local Universe. In these simulations structures like the Virgo cluster are always reproduced and the Local Group forms in the correct environment. On smaller scales, the distribution of structure is essentially random.
Several dark matter-only realizations are run until a Local Group analog (a Milky Way-M31 binary group, hereafter LG) is found. Then the zoom-in technique is applied, which means that the LG region is resimulated with baryons and at a higher resolution. The resimulation includes 40963 effective particles in a sphere with radius Mpc around the LG. The mass resolution of particles is mstar=1.3104M⊙, mgas=1.8104M⊙, and mdm=2.9105M⊙, and the gravitational softening lengths are =223pc between baryons and =486pc between dark matter particles. The cosmology used is CDM with WMAP3 parameters, that is, km s-1 Mpc-1, , , , and .
2.1.2 GASOLINE
This CLUES simulation has been evolved using the parallel N-body+SPH tree-code GASOLINE (Wadsley et al. 2004), which includes gas hydrodynamics and cooling, star formation, energy feedback, and metal enrichment to model structure formation.
We briefly describe here the most important implementations of this well-tested code (for details see Stinson et al. 2006 and Governato et al. 2010).
The simulation follows the physics used in Governato et al. (2010) and Guedes et al. (2011). Feedback recipes are tuned to match the stellar-to-halo mass relation at one stellar mass. When gas becomes cold and dense, stars are formed according to a Schmidt law with a star formation rate . When these stars die, they release energy and metals into the surrounding ISM. The total mass and number of stars that explode as SNe is calculated using stellar lifetime calculations from Raiteri et al. (1996). It is assumed that only stars between 8 and 40 M⊙ explode as SNII, and the mass of a binary system that can eventually explode as SNIa is between 3-16 M⊙. Stars more massive than 40 M⊙ are assumed to either collapse into black holes or explode as SNIb. Regardless of this, only few stars form with masses greater than 40 M⊙, thus the impact on the feedback is minimal. The energy feedback by SNII is implemented by means of the blastwave formalism (Stinson et al. 2006), where a fixed fraction of the canonical erg per SN explosion is released to the ISM. The metals produced in these stars are released as the main-sequence progenitors die, and the metals are distributed to the gas within the blast radius. Iron and oxygen are produced in SNII according to the analytic fits used in Raiteri et al. (1996) using the yields from Woosley & Weaver (1995): MFe =2.802 10-4M and MO =4.586 10-4M.
Feedback from SNIa also follows the Raiteri et al. (1996) model. Each SNIa produces 0.63 M⊙ iron and
0.13 M⊙ oxygen (Thielemann et al. 1986) and the
metals are ejected into the nearest gas particle.
Furthermore, the significant feedback contribution of stellar winds is also taken into account.
Stars with masses of between 1 and 8
M⊙ return a fraction of their initial mass,
which is determined
using the function derived by Weidemann (1987). The returned gas
has the same metallicity as the star particle. Metal diffusion between gas particles is implemented as described in Shen et al. (2010).
Finally, GASOLINE also accounts for the effect of a uniform background radiation field on the ionization and excitation state of the gas.
The formation and evolution of dwarfs in the LG neighborhood has been analyzed in zoomed simulations that are based on the same initial conditions as used in our paper, but performed with the GADGET code (Benítez-Llambay et al. 2013, 2015, 2016). This particular CLUES simulation has been studied in Santos-Santos et al. (2016), where it was shown that its intermediate- to high-mass disk-like galaxies have a correct mass distribution and angular momentum content.
2.2 GRASIL-3D
To develop the GRASIL-3D radiative-transfer code, DT14 have followed the main characteristics and scheme of GRASIL. We briefly recall the main features here. For a full description we refer to DT14, S98, and S99.
To solve the radiative transfer, GRASIL-3D uses a Cartesian grid whose cell size is set by the smoothing length used in the simulation code. The gas is subdivided into a dense phase (fraction of the total mass of gas) associated with young stars (star-forming molecular clouds, MCs) and a diffuse phase (cirrus) where more evolved (free) stars and MCs are placed. Young stars leave their parent clouds on a timescale . The MCs are represented as spherical clouds with a certain optical depth containing an inner stellar source of radiation, whose radiative transfer through the MC is calculated following Granato & Danese (1994). The radiative transfer of the radiation emerging from MCs and from free stars is then computed through the cirrus dust.
2.2.1 Gas fractions in MCs and cirrus
The fraction of gas in MCs, , is calculated locally by implementing a subresolution model based on the assumption that MCs are defined by a density threshold (e.g., Elmegreen 2002; Hennebelle & Falgarone 2012), and using a theoretical log-normal probability distribution function (PDF) for the gas densities. The PDF is characterized by a density parameter and a dispersion . They define the PDF volume-averaged density as , which we in turn identify with the SPH density of the i-th gas particle (simulation output), . In this way, can be calculated for each gas particle, leaving only two parameters to control the calculation of : the gas density threshold , and the PDF dispersion . The diffuse gas fraction of a given particle is then . This PDF approach is suggested by small-scale ( 1 kpc) simulations (see, for example, Wada & Norman 2007a; Federrath et al. 2008; Brunt et al. 2009; Hennebelle & Falgarone 2012) and is supported by recent high-resolution Herschel observations of nearby MCs (e.g., Schneider et al. 2012).
Values for vary in the literature. For example, = 100 H nuclei cm 3.3 M⊙ pc-3 in Tasker & Tan (2009), and H nuclei cm M⊙ pc-3 in Ballesteros-Paredes et al. (1999a, b). Values for have been calculated to range from 2.36 to 3.012 in Wada & Norman (2007b), while Tasker & Tan (2009) give = 2.0. In DT14 the range for the density threshold is taken to be = 10 - 100 H nuclei cmM⊙ kpc-3, while the PDF dispersion takes either 2.0 or 3.0. These are the values used here. A useful check for the choice of these parameters can be made by comparing the final calculated average HI and H2 contents of the galaxy or sample of galaxies, with observations.
2.2.2 Stellar emission
The luminosity of the young stellar populations placed inside each active MC is modeled in GRASIL by linearly decreasing the fraction of the stellar populations’ energy radiated inside the cloud with its age :
| (2) |
Here is a free parameter representing the time taken for stars to escape the MCs where they were born, and it mimics MC destruction by young stars. The same approach is adopted in GRASIL-3D. In this way, only stars with ages¡2 are eligible to form part of the MC heating engine, with probability . Observationally, takes values on the order of the lifetime of the most massive stars, from 3 to 100 Myr, and it varies with the density of the surrounding ISM, being higher in the densest environments. Typical values were found by comparison to local observations in S98, yielding 2.5 to 8 Myr for normal spiral galaxies, and between 18 and 50 Myr for starburst galaxies. The contributions to the heating of cirrus dust come from free stellar particles with ages , as well as from stars with supplying of their radiation.
2.2.3 Dust-to-gas mass ratio
The dust content in MCs and in the cirrus is computed from a dust-to-gas mass ratio . In this work, has been set to vary with gas metallicity Zgas following the broken power-law in terms of oxygen abundances proposed in Table 1 of Rémy-Ruyer et al. (2014). This approach is needed to fit the very low dust masses observed in low-metallicity (12+log(O/H)8.0) environments or galaxies (Lisenfeld & Ferrara 1998; Galliano et al. 2005; Hunt et al. 2005; Galliano et al. 2008a; Engelbracht et al. 2008; Galametz et al. 2011; Galliano et al. 2011; Izotov et al. 2014), and it is consistent with dust and PAH evolution models (e.g., Hirashita et al. 2002; Calura et al. 2008; Galliano et al. 2008b; Asano et al. 2013; Seok et al. 2014). Since in GRASIL-3D each particle has a different gas mass and metallicity, the dust-to-gas mass ratio is a local quantity that varies from cell to cell. Adopting 12+log(O/H)⊙ = 8.69 (i.e. Z⊙ =0.014, Asplund et al. 2009) solar values, we obtain
| (3) | |||
where =1.0, =2.21, =3.0, =0.77, and is the mass fraction of gas metals at the -th grid cell. The break in the metallicity dependence occurs at Zt=0.0026 (i.e., 12+log(O/H)=7.96), and the result is given in solar units, where =D/G⊙=1/162 according to Zubko et al. (2004) for a dust composition like ours (see next subsection). We adopt a slope of 1 at high metallicities (), which has been shown in many studies to adequately represent this regime (James et al. 2002; Draine & Li 2007; Galliano et al. 2008a; Leroy et al. 2011), and a slope of at low metallicities (we do not use exactly the same value as that given in Rémy-Ruyer et al. (2014) but a simpler value that is inside their errors). This broken power-law scaling of with metallicity gives satisfactory final dust masses compared to observational estimates, as we show in Sect. 5.4, while using a linear scaling () at any metallicity does not work so well. However, we note that the problem of the D/G vs Z assignation at low metallicity is still not solved because of the uncertainties in determining both the dust and H2 masses of observed very low-metallicity galaxies.
The dust-to-gas mass ratio is also relevant for calculating the radiation transfer through MCs since it determines the optical depth of the cloud:
| (4) |
where and are the mass and radius of individual MCs, respectively, both free parameters in GRASIL-3D. The proportionality constant depends on the dust model. Since both and the luminosity from the central source can vary in each grid cell, the radiative transfer is calculated separately for each of them even if is taken to be constant.
2.2.4 Dust model
The dust in GRASIL-3D is assumed to consist of a mixture of different grain types: carbonaceous and silicate spherical grains, where graphite grains smaller than 250 are considered as PAHs. These in turn consist of a mixture of neutral and ionized particles. This simple composition has been shown to appropriately reproduce observational constraints coming from the average interstellar extinction, thermal IR emission, and interstellar abundances in the Galaxy, LMC and SMC (Weingartner & Draine 2001; Zubko et al. 2004). A different size distribution is adopted for each grain type, following the functional form given in Weingartner & Draine (2001), and updated in Draine & Li (2007). The optical properties come from Laor & Draine (1993) and Li & Draine (2001).
A different dust composition is assumed in the diffuse ISM and in MCs. The difference resides in the PAH abundance or index , defined as the percentage of dust mass contributed by PAHs containing less than C atoms. Previous studies have discretized this index into seven values (see Weingartner & Draine 2001; Draine et al. 2007; Draine & Li 2007), each characterizing a specific dust model, where the highest value (4.58%) matches the Galactic dust. Here, we use a low value of = 1.12% for the cirrus dust (as in model MW3.1_10 from Draine & Li 2007; Draine et al. 2007), as suggested by observations of low-metallicity galaxies that show very low PAH band emission (Engelbracht et al. 2005; O’Halloran et al. 2006; Draine et al. 2007; Smith et al. 2007; Gordon et al. 2008; Rosenberg et al. 2008; Hunt et al. 2010; Wu et al. 2011; Ciesla et al. 2014) and by PAH evolution models (Seok et al. 2014; Bekki 2013). This has been implemented globally for all grid cells, and we consider it a suitable approximation since the use of one value for or another only affects the intensity of the particular mid-infrared PAH emission features, and not the far-infrared luminosity. In MCs however, the PAH abundance is decreased 1000 times relative to the diffuse component, as tuned by Vega et al. (2005) to fit MIR properties of local actively star-forming galaxies. The differences between using this low cirrus value or the standard Galactic value are discussed in Sect. 7.4.
The temperature distribution is defined for each grain type (silicate, graphite, or PAH) by its particular size distribution. In the case of grains with sizes , each interval in grain size corresponds to emission from a modified black body of a given temperature , with an emissivity index of =2 defining its FIR/submm slope. For PAH grains, in contrast, no unique temperature is defined. PAHs of a given size are not able to reach temperature equilibrium due to stochastic heating, and span instead a wide distribution of temperatures (Guhathakurta & Draine 1989; Siebenmorgen & Kruegel 1992). The final emission of the MC and cirrus dust components in a given grid cell is the sum of all the temperature contributions coming from each grain size interval corresponding to each grain type.
Throughout the paper we use the respective maxima location of the MC and cirrus dust components as an estimate of their effective global temperatures. However, it is worth noting that the typically used ‘cold’ or ‘warm’ terms for dust emission do not strictly apply for GRASIL-3D SEDs (nor for real galaxies) as they represent a very simplified description of a more complex situation.
2.2.5 Choice of GRASIL-3D free parameter values
According to the previous subsections, the free parameters in GRASIL-3D are i) the escape timescale from MCs, ; ii) the threshold density for MCs, ; iii) the log-normal PDF dispersion parameter, ; and iv) the combination, determining the optical depth of individual MCs. It is worthwhile to recall that the simulation provides the geometry of each galaxy, the star formation history (SFH), metal enrichment history, and stellar and gas fractions, in such a way that no further parameters are needed to describe them.
The following set of parameter values have been used and considered as of reference in this study: =40 Myr, M⊙kpc-3, =2., =106 M⊙, and =14 pc.
The choice of a high value comes from following the results of S98 for star-bursting galaxies, which seems a good approximation since as we show below, our simulated dwarfs are particularly picked according to their recent star formation. The PDF parameters chosen provide the best match to observational data of H2 molecular gas masses of nearby low-mass galaxies when using a metallicity-dependent CO-to-H2 conversion factor (see Sects. 4.1 and 5.2). Finally, the mass and radii of single molecular clouds are set to the values that best match observed SEDs of local galaxies in S98. These numbers are within the observational estimates from MCs in our Galaxy. In Sect. 7.4 we discuss the effects of parameter variation on the resulting SEDs in detail.
GRASIL-3D has a general applicability to the outputs of simulated galaxies, and it has been used in a variety of contexts to analyze their SEDs. For example, DT14 have analyzed normal spiral galaxies and compared the resulting SEDs to different observational surveys. Obreja et al. (2014) have tested star formation rate tracers used by observers against mass-weighted quantities, obtaining a satisfactory agreement. Granato et al. (2015) have analyzed the early phases of galaxy cluster formation in hydrodynamical simulations, comparing their IR emission to observations. Buck et al. (2016) have studied the nature of clumps in simulated massive disk galaxies. Goz et al. (2016) have evaluated the possible correlation of IR luminosity in Spitzer and Herschel bands with several galaxy properties.
3 Sample of simulated star-forming dwarf galaxies
The galaxies from the CLUES simulation were identified with the Amiga Halo Finder (AHF; Knollmann & Knebe 2009), where halo masses are defined as the mass inside a sphere containing 350 times the cosmic background matter density. This search has produced 139 highly resolved dark matter halos, 120 of which host bound stellar mass objects ranging 10109M⊙, to which we asign the label ”dwarf”. These may or may not have gas particles, and can be either isolated or satellites.
In this work we are interested in the IR-submm emission of dwarf galaxies. As is well known, dust grains absorb the ultraviolet light emitted by very young stars and reemit it at longer wavelengths. We therefore focus on those dwarfs that have recent star formation; in particular, dwarfs that contain stellar particles (stellar populations) with ages lower than 80 Myr (this is twice the value we chose). This leaves a final sample of 27 dwarf galaxies, all of which contain gas. Their general properties are given in Table 1.
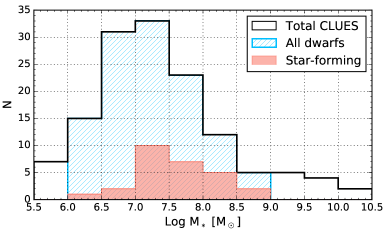
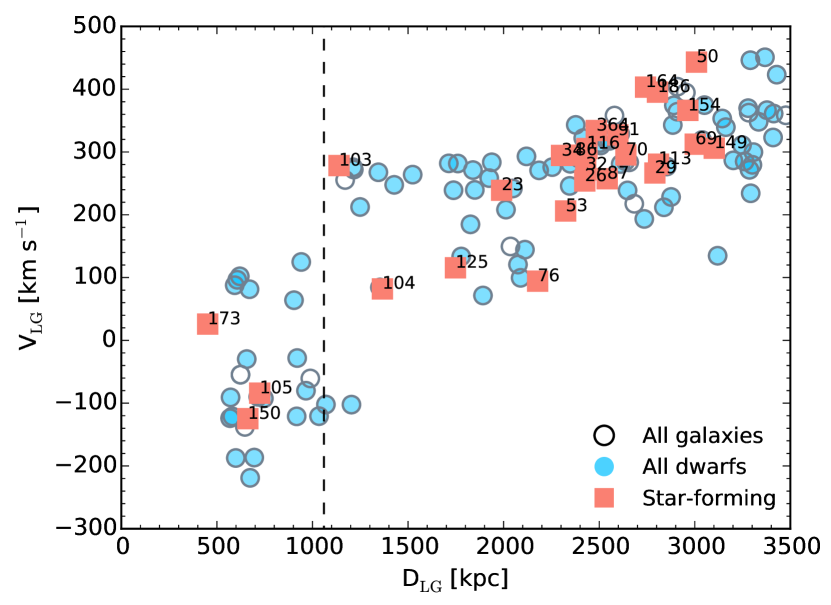
The mass distributions of the CLUES total, dwarf, and star-forming dwarf galaxy samples are given in Fig. 1. We note that the fraction of galaxies in the LG with recent star formation is consistent with observations (Mateo 1998; Tolstoy et al. 2009; Dolphin et al. 2005). In Fig. 2 we plot the velocity of each galaxy relative to the center of mass of the simulated LG, that is, the barycenter of the Milky Way-M31 pair, versus their distance to this barycenter. A vertical dashed line indicates the zero-velocity surface of the LG (RLG = 1060 70 kpc) as derived in McConnachie (2012). Galaxies are labeled with their ID number (column 1, Table 1) to allow following them in all figures throughout the paper. When compared to real data (McConnachie 2012, see Fig. 5), this plot gives us a first satisfactory insight into the simulated LG structure, and in particular, into the galaxy distribution. Considering the local volume to have a radial extent of 3 Mpc, we find galaxies that are true LG members, galaxies that are close but not yet bounded, and galaxies that are outer nearby neighbors, rising in velocity with distance as expected due to the Hubble flow. The total number of simulated LG members is comparable to the observed number.
The galaxies of this sample present differences in their SFHs, gas masses, sizes, and morphologies, the latter being either irregular, spheroidal, or disky. Furthermore, the majority of the local star-forming dwarfs we studied are isolated, except for three (numbers 86, 104, and 150) that are satellites of other more massive galaxies. Some of the general properties of the sample, listed in Table 1, are studied in Sect. 5.
4 Observational samples to compare our results with
We report on two types of comparisons with observational data. First, we examine whether the simulated dwarfs have global properties that agree with observational samples, for which we focus on the SFHs, HI and H2 gas contents, dust masses, and metallicities because these properties have the strongest influence on the resulting SEDs. Second, we compare the IR-submm emission of our simulated sample with observed galaxies that span the same stellar mass and metallicity ranges. This second comparison is the core of this paper, and it is made possible by the recent Herschel observations mentioned in Sect. 1.
4.1 HI and H2 gas content, star-formation rate, and gas metallicity
We compare the HI and H2 masses of the simulated dwarf galaxies to data from the observational studies described below.
For all of these galaxy samples
the H2 content or molecular gas masses are calculated by assuming a constant CO-to-H2
conversion factor with
the Galactic value: X cm-2 (K km s-1)-1.
However,
we note that it has long been argued
that CO may not trace the molecular gas in dwarf galaxies: the conversion factor may be metallicity dependent
(see e.g., Taylor et al. 1998; Wilson 1995; Boselli et al. 2002; Hunt et al. 2005; Leroy et al. 2011; Schruba et al. 2012; Bolatto et al. 2013),
and the use of the standard Galactic value could understimate the molecular gas fraction in low-metallicity galaxies.
Some of the following samples also provide the H2 masses obtained using a conversion factor of this type.
We therefore use these samples
in Sect. 5.2
to study the
different GRASIL-3D parametrizations needed to match the molecular gas masses obtained
using a constant and a metallicity-dependent conversion factor.
The Dwarf Galaxy Survey (DGS, Madden et al. 2013).
DGS is a sample of star-forming dwarf galaxies with metallicities ranging from to and stellar masses covering to M⊙ (Madden et al. 2014). HI and H2 masses are given in Rémy-Ruyer et al. (2014), where they compiled data from Madden et al. (2013). HI masses were corrected to account for the aperture size used to obtain the dust SED. Rémy-Ruyer et al. (2014) also provide the H2 masses of the DGS galaxies obtained using a metallicity-dependent conversion factor of the form , following Schruba et al. (2012). Dust masses for DGS are given in Rémy-Ruyer et al. (2015), where they represent the best fit to data following the dust SED model from Galliano et al. (2011).
The Key Insights on Nearby Galaxies: a Far-Infrared Survey with Herschel (KINGFISH, Kennicutt et al. 2011).
This sample consists of 61 galaxies, most of them spirals with some early-type and dwarf galaxies. Their stellar mass range is peaking at , and metallicities reach up to Z 1.20 Z⊙. No particular dust emission features have been found in this sample (Rémy-Ruyer et al. 2015). We therefore use it as a reference with which to compare the specifities of dust emission in lower mass galaxies. HI and H2 masses of KINGFISH galaxies are also given in Rémy-Ruyer et al. (2014), where they compiled data from Draine et al. (2007). Rémy-Ruyer et al. (2014) additionally provide the H2 masses obtained using a metallicity-dependent conversion factor of the form . Dust masses for KINGFISH are estimated in Rémy-Ruyer et al. (2015).
The Herschel-ATLAS Phase-1 Limited-Extent Spatial Survey (HAPLESS, Clark et al. 2015).
This is the first 250 m blind survey selected from the Herschel Astrophysical Terahertz Large Area Survey (H-ATLAS, Eales et al. 2010) on the basis of their (higher) dust mass content. It consists of 42 nearby galaxies, spanning a range in stellar mass from to M⊙ with a peak at M M⊙. They are the most actively star-forming galaxies in H-ATLAS, with sSFR yr-1, and seem to be in an early stage of converting their gas into stars. HI masses are calculated from the highest-resolution 21 cm observations available for each galaxy, coming either from the HI Parkes All Sky Survey (HIPASS, Meyer et al. 2004), the Arecibo Legacy Fast ALFA Survey (ALFALFA, Haynes et al. 2011), or from other published literature sources.
Leroy et al. 2008.
These authors compiled the available data for 23 nearby star-forming galaxies to study star formation rates (SFRs) and efficiencies. Half of them are HI-dominated low-mass () galaxies and the other half are large spirals. The HI and H2 masses are calculated from integrating the atomic (THINGS, Walter et al. 2008) and molecular (HERACLES, Leroy et al. 2009 or BIMA SONG, Helfer et al. 2003) hydrogen surface densities within 1.5 r25.
Groves et al. 2015.
The correlation between the total gas mass and the IR luminosity is studied for a sample of 36 nearby (D10 Mpc) galaxies observed with the KINGFISH, THINGS, and HERACLES surveys. These galaxies range from 106.5 to 1010.5 M⊙ in stellar mass and have disk-like morphologies. Molecular gas masses are calculated using HERACLES data by assuming a fixed-to-Galactic-value CO-to-H2 conversion factor and a fixed line ratio of CO(2-1) to CO(1-0) of R21 = 0.8 .
APEX Low-redshift Legacy Survey for MOlecular Gas (ALLSMOG, Bothwell et al. 2014).
ALLSMOG is designed to observe the CO(2-1) emission line with the APEX telescope in a sample of local galaxies (0.01 0.03). These galaxies are from the SDSS data release 7, and their stellar masses are in the 10 M⊙ range. HI masses are taken from either HIPASS, ALFALFA, or from the large collection of HI observations assembled by Springob et al. (2005). Bothwell et al. (2014) also provide for this sample the results of the H2 masses calculated using the metallicity-dependent CO-to-H2 conversion factor of Wolfire et al. (2010).
The Faint Irregular Galaxies GMRT Survey (FIGGS, Begum et al. 2008).
This is a HI imaging survey of 65 extremely
faint nearby dwarf irregular galaxies observed with the Giant Meterwave Radio Telescope. It is a subsample of the Karachentsev et al. (2004) catalog of galaxies within a distance of 10 Mpc.
HI masses were derived from global HI profiles.
We note that
several galaxies are in common in these samples,
and the atomic and molecular hydrogen masses each reference gives can be different for a same object. We kept all values in our analysis to account for the scatter coming from the discrepancy in these mass determinations.
The SFRs and metallicities of the CLUES star-forming dwarfs were compared to those of galaxies from DGS and KINGFISH. For these two surveys, SFRs were estimated considering two of the most widely used SFR tracers, the far-ultraviolet (FUV) and the H luminosities, corrected for dust attenuation, using either total-infrared (TIR) or 24 m luminosities (Kennicutt et al. 2009b; Calzetti et al. 2010; Hao et al. 2011; Kennicutt & Evans 2012). We refer to Section 2.6.1 in Rémy-Ruyer et al. (2015) for details of the estimations. The metallicities in both samples have been determined in Madden et al. (2013) and Kennicutt et al. (2011) using the calibration from Pilyugin & Thuan (2005).
4.2 IR-submm emission
We compare our IR-submm emission results to data from DGS, KINGFISH, and HAPLESS. All three galaxy samples have been observed with Herschel in the 70, 100, and 160 m PACS and 250, 350 and 500 m SPIRE bands (see Rémy-Ruyer et al. 2015; Clark et al. 2015; Dale et al. 2012, respectively). Mid-infrared data from IRAC 8m and MIPS 24m Spitzer bands for DGS and KINGFISH (see Rémy-Ruyer et al. 2015; Dale et al. 2005, respectively), are also studied. We highlight that GRASIL-3D allows the precise calculation of the luminosities of the simulated galaxies as seen through a very wide range of telescopic filters (with their particular transmission and calibration), allowing for an accurate comparison with the above observational data.
5 Results: General properties of the sample
We briefly present here the general properties of the CLUES star-forming dwarf galaxy sample, namely, their SFHs, neutral hydrogen mass content, and metallicities, to demonstrate that they constitute a realistic dwarf galaxy sample with properties comparable to observed properties. The molecular H2 gas masses as calculated by GRASIL-3D are also compared to observational data to justify the choice of made.
5.1 Star formation rate history
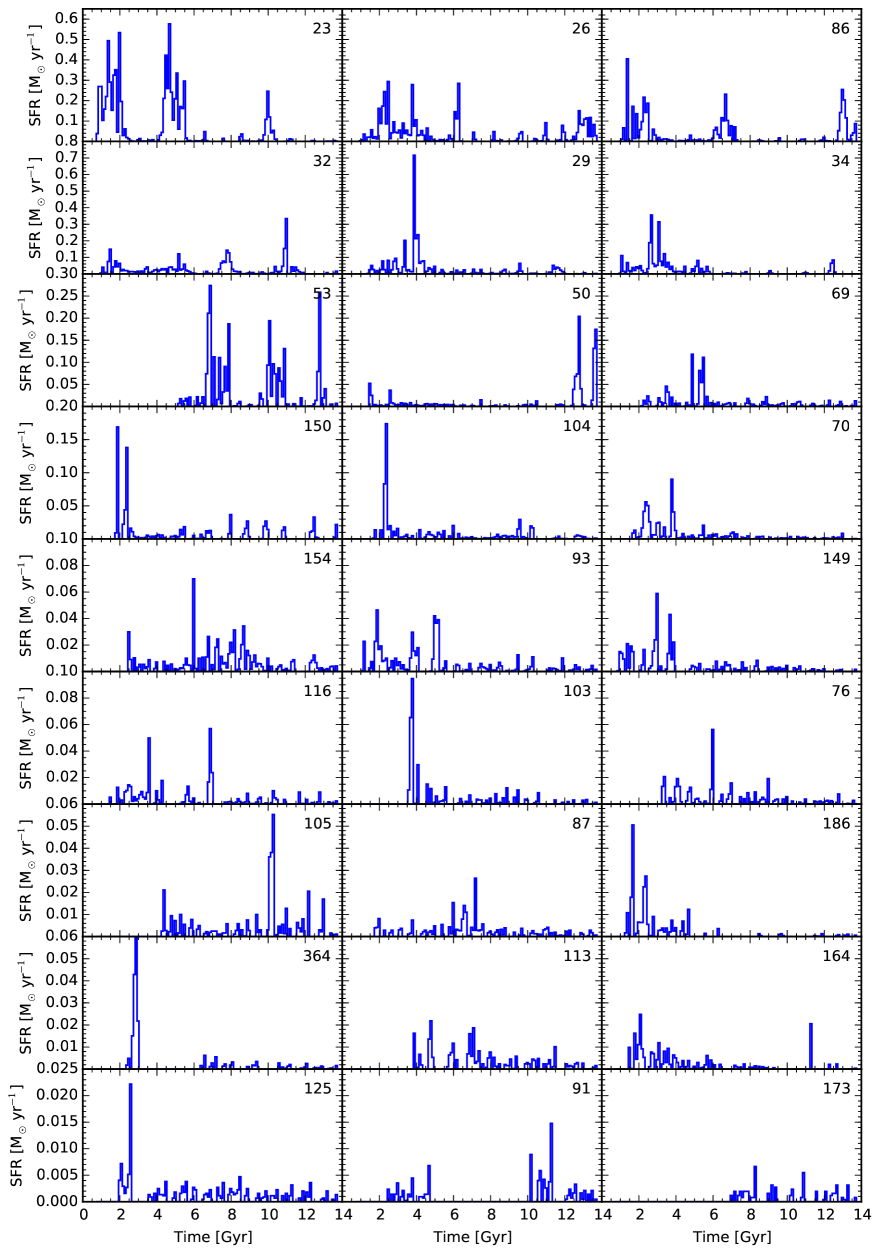
The SFRs at of the CLUES dwarfs were calculated using the mass of stars born in the past 100 Myr, a time interval that is consistent with SFR tracers such as FUV and TIR luminosities, used by the observational samples we compare our results to. Their star formation rate histories (SFHs) are depicted in Fig. 15 as histograms where each bin represents 100 Myr. They show significant diversity, some of them having formed many stars recently, while others have not. In general, all the simulated dwarf galaxies present a bursty SFH, with an average of 2.5 important bursty episodes per galaxy, which are generally short lived (200 Myr).
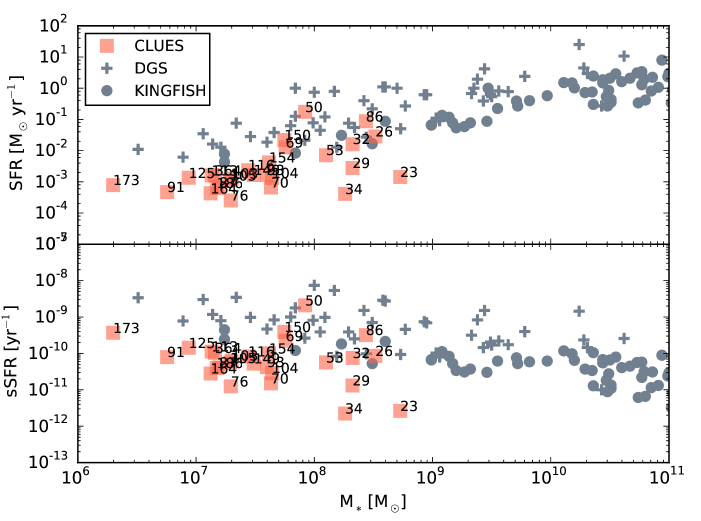
In Fig. 3 we show the SFR and specific SFR (sSFR) at versus stellar mass, compared to observational data from DGS and KINGFISH. Simulated galaxies follow the observed trend with stellar mass in both cases. We note that a few CLUES galaxies fall slightly below their observational counterparts at M2-5108M⊙, indicating that they host fewer young stars. This may be due to environmental effects.
5.2 HI and H2 gas contents
To ignore the spurious effects of hot ionized (HII) gas, we only provide GRASIL-3D with gas particles with temperatures lower than 2104K. For the simulated dwarfs that contain hot gas (50% of the star-forming sample), this temperature cut cleanly separates the cold and hot gas phases in a temperature histogram. Therefore we can safely assert that Mcoldgas=MHI+MH2+MHe+MZ, where MHe and MZ are the mass fractions in helium and in metals, respectively.
Concerning atomic and molecular gas fractions, as explained previously, in GRASIL-3D the fraction of gas in the form of molecular clouds is derived under the assumption that MCs are defined by a density threshold, , and by a probability distribution function (PDF) for the gas distribution at subresolution scales with dispersion . When the MC mass is known, HI and H2 masses are derived by correcting for the fraction of mass in helium and ignoring the fraction of mass in metals.
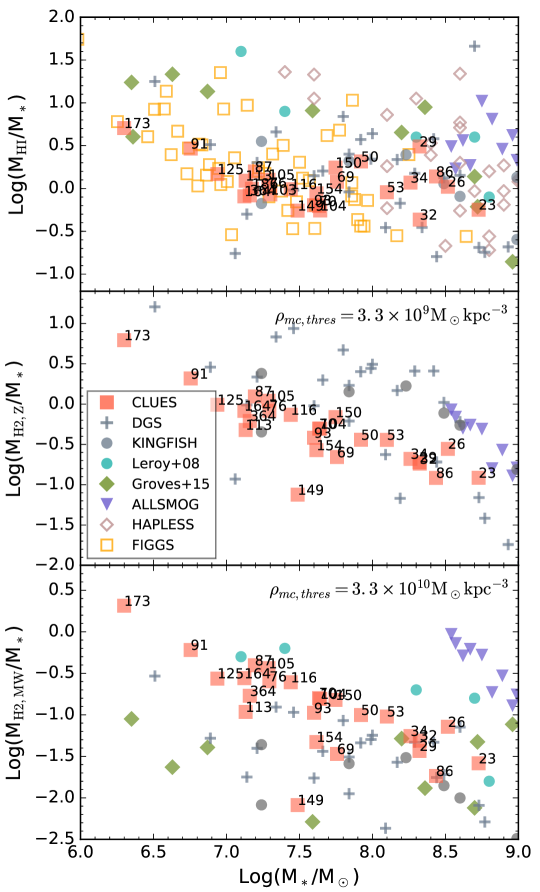
We show in Fig. 4 the HI and H2 gas contents of the simulated galaxies compared to observational data inside the dwarf stellar mass range. The upper panel proves that the fraction of HI gas mass per total stellar mass in simulated galaxies agrees with observational data. Regarding the fraction of molecular gas H2, the middle and lower panels show observational data assuming a metallicity-dependent and a constant-Galactic CO-to-H2 conversion factor, respectively. The gas density threshold of reference used in this work (=3.3109 M⊙ kpc-3) provides an acceptable match to the observational MH2 data resulting from assuming a metallicity-dependent conversion factor (middle panel); however, a value one order of magnitude higher is required to fit observed data that assume a constant conversion factor (lower panel). This translates into a decrease of MH2 in CLUES galaxies of an average factor of , as can be observed by comparing the middle and lower panels of Fig. 4.
In the following sections, the infrared luminosity results are shown for these two different gas density threshold values. As we show, qualitatively the final conclusions of this study are unchanged when using either of these two parametrizations. We therefore do not attempt to complicate the picture by considering different methods for estimating the molecular gas fraction or taking physical processes into account that may affect the formation of H2 on dust grains (such as interstellar radiation fields or dust density).
5.3 Gas metallicity
Among other metals, GASOLINE traces the evolution of oxygen in gas and stellar particles, which is produced as a yield of SNII and SNIa explosions (see Sect. 2.1.2). The 12+log(O/H) metallicity for each object was computed by averaging the oxygen mass fraction from cold gas particles inside 2Rhalf, where Rhalf is the median radial distance of gas particles from the center of the galaxy.
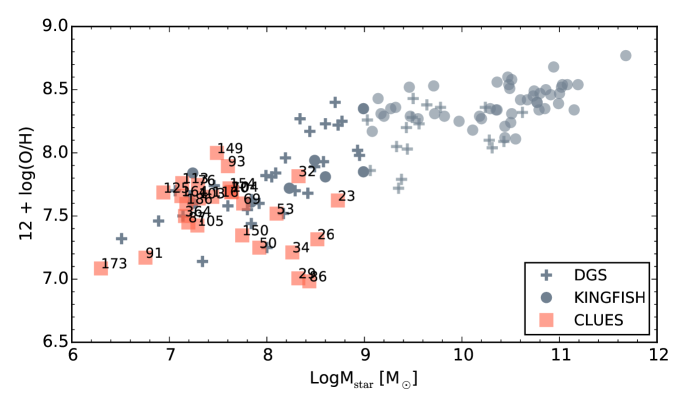
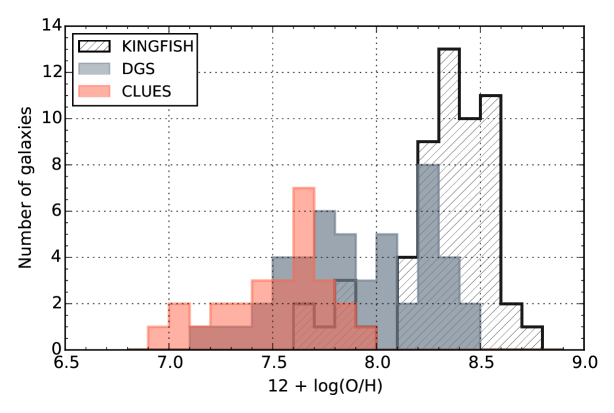
We show the mass-metallicity relation of CLUES galaxies in Fig. 5. In general, they follow the observational relation, although a few of them with LogM8.4 have lower metallicities than the data. Furthermore, Fig. 6 displays the metallicity distribution. CLUES dwarfs are certainly low-metallicity galaxies: their 12+log(O/H) values range between 7.0 and 8.0 dex, with a low-metallicity tail showing a very similar number distribution to that of DGS.
5.4 Dust-to-gas mass ratio
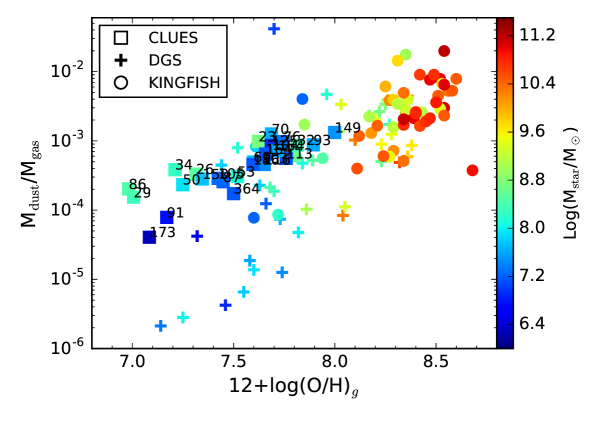
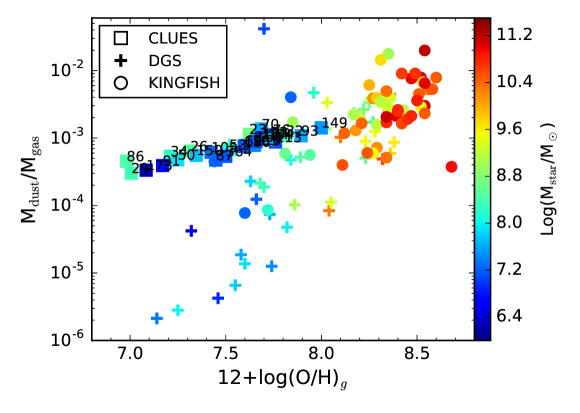
Figure 7 presents the total (i.e., in a given galaxy) D/G ratio versus 12+log(O/H) gas metallicity colored by stellar mass.
CLUES galaxies at very low metallicities show dispersion in their dust masses, as is observed.
We note, however, that all observed galaxies with metallicities below 12+log(O/H) (and many other at higher metallicities) have both uncertain
i) H2 masses (the absence of data has been replaced by an MH2 correction Rémy-Ruyer et al. 2014)
and
ii) dust masses, (due to non-detections of the galaxy at wavelengths larger than 160 m Rémy-Ruyer et al. 2015).
More observational work is needed to surpass these uncertainties.
We recall that we have assumed a broken power-law dependence of D/G on Z metallicity (see Eq. 2.2.3) to calculate the CLUES dwarf dust masses.
The dust masses and the consequences on the final SEDs that result by assuming a linear dependence of D/G on Z instead are shown in Sect. 7.2.
Based on this analysis, we can conclude that the properties of the sample of CLUES simulated star-forming dwarfs are consistent with observations, and we proceed to the SED analysis.
6 Results: The diversity of emission in the IR-submm range
6.1 SEDs
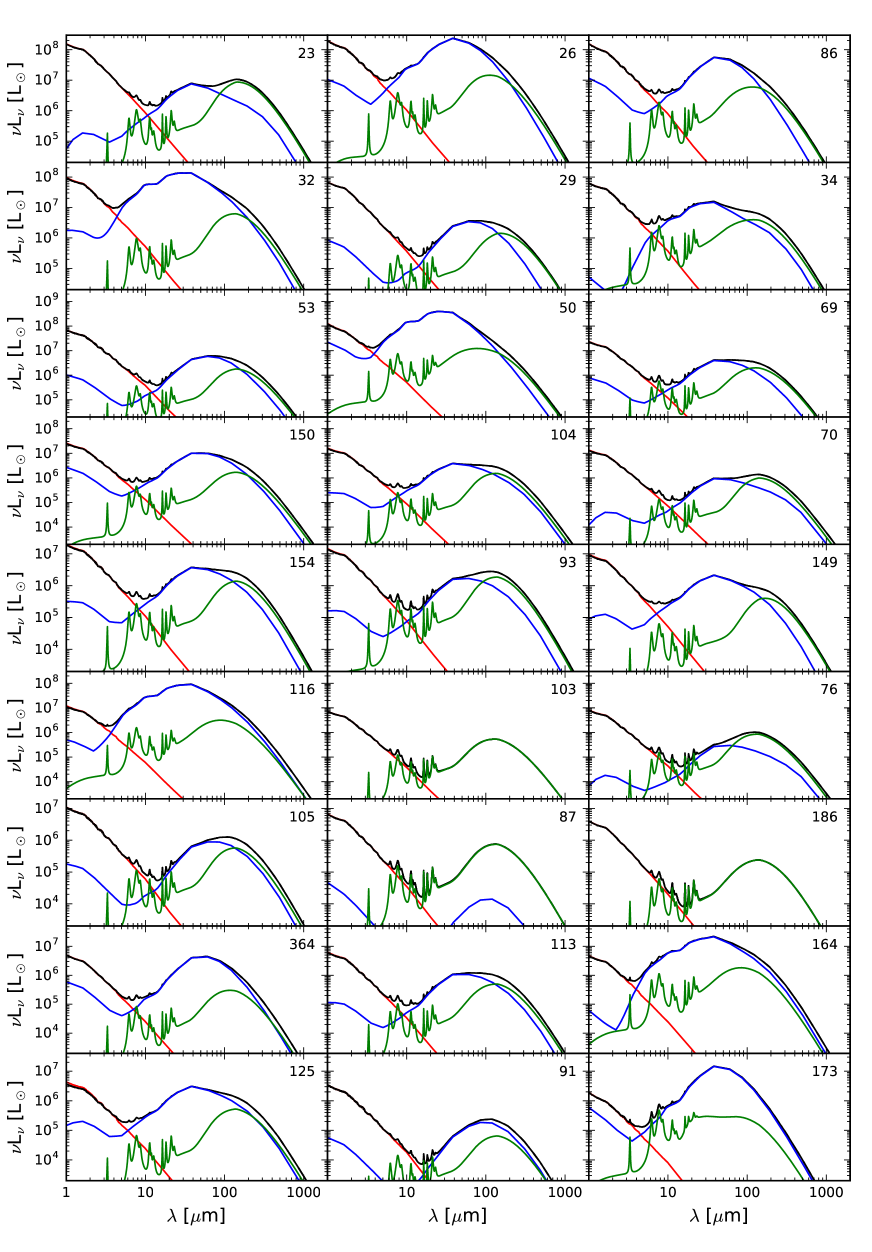
To explore how CLUES star-forming dwarfs behave regarding their IR-submm emission, we show in Fig. 16 their SEDs as calculated with GRASIL-3D. The intrinsic stellar emission is shown in red, the MC emission in blue, the emission from cirrus in green, and the black curve gives the angle-averaged total emission. The SEDs show a surprising variety, mimicking the different characteristics shown in DGS and HAPLESS SEDs as described by Rémy-Ruyer et al. (2015) and Clark et al. (2015), respectively.
Specific examples of SEDs with clearly defined patterns are i) IR peak broadening in numbers 34, 104, 149, and 164; ii) submm excess and slope flattening in numbers 26, 32, 50, and 86; and iii) low PAH emission in numbers 26, 32, 53, 116, and 125. Other galaxies show less clear patterns and/or mixed properties, for example, numbers 23, 34, 154, and 93. Finally, in three cases none of these features are apparent: numbers 103, 87, and 186.
Contrary to observational data, where no SED decomposition into different dust components is directly available, GRASIL-3D provides the MC and cirrus emissions. Fig. 16 shows that two distinct dust components can be distinguished in the simulated galaxies: a colder (cirrus, green) and a warmer component (MCs, blue).333 We recall that the terms ‘cold’ and ‘warm’ refer to the location of the respective emission maxima (sum of the emissions of grains of different types, sizes and temperatures), therefore they refer to a temperature that is only effective (see Sect. 2.2.4). In this way, a first answer to the question of the double dust component SED in dwarf galaxies suggested in numerous studies (e.g., Bendo et al. 2010, 2012b, 2012c; Boquien et al. 2011b; Rémy-Ruyer et al. 2013) is naturally given by our modeling: the two components are the emission from PAH-depleted dust in MCs that is heated by young stars, and from dust in the cirrus that is heated by more evolved stars.
Each of these two SED components is shaped by their respective dust grain total effective temperatures (determined by the location of the emission maxima) and the flux intensities at their respective maxima. The final IR-submm SED is the addition of these two (MC and cirrus) contributions. According to the relative positions of the two maxima and the respective flux values there, a continuum of possibilities emerges from this combination, with extremal behaviors occuring when one component dominates over the other. In the next subsections the implications of these edge situations and those of the intermediate possibilities are described and discussed in detail. To better quantify the comparisons with observations, this is done through color-color analyses.
6.2 IR peak broadening
While the SEDs of larger and metal-richer galaxies peak at around 100-160 m (as most KINGFISH SEDs show, see Fig. 13, Rémy-Ruyer et al. 2015), dwarf galaxies in general present a broad IR SED with a wide maximum. This behavior is reproduced in the GRASIL-3D SEDs of the CLUES dwarf galaxies. In particular, two different broadening features are visible in Fig. 16, having an equivalent in the SEDs of DGS galaxies (see Fig. 12, Rémy-Ruyer et al. 2015).
-
1.
In some cases, the MC emission is much stronger (and effectively hotter) than that of the cirrus in such a way that it hides PAH emission and produces a broad maximum that typically peaks in the 20 - 40 m range. This is the case for numbers 26, 32, 50, 116, and 164, and to a lesser extent for numbers 86, 150, and 364. A typical observational counterpart is DGS galaxy HS0017+1055.
-
2.
A different characteristic situation arises when both the MC and cirrus emissions have similar intensities at their (separated) maxima, typically at and m, respectively. In this case, the combined emission is rather flat between the two maxima, or with a slight slope if the maxima heights are somewhat dissimilar. Typical examples of this situation are numbers 29, 53, 69, 104, 154, 93, 105, 113, and 125. On the observational side, DGS galaxy Pox186 is an example, and most SEDs of the HAPLESS galaxies (Fig. A2 of Clark et al. 2015) could reflect this situation.
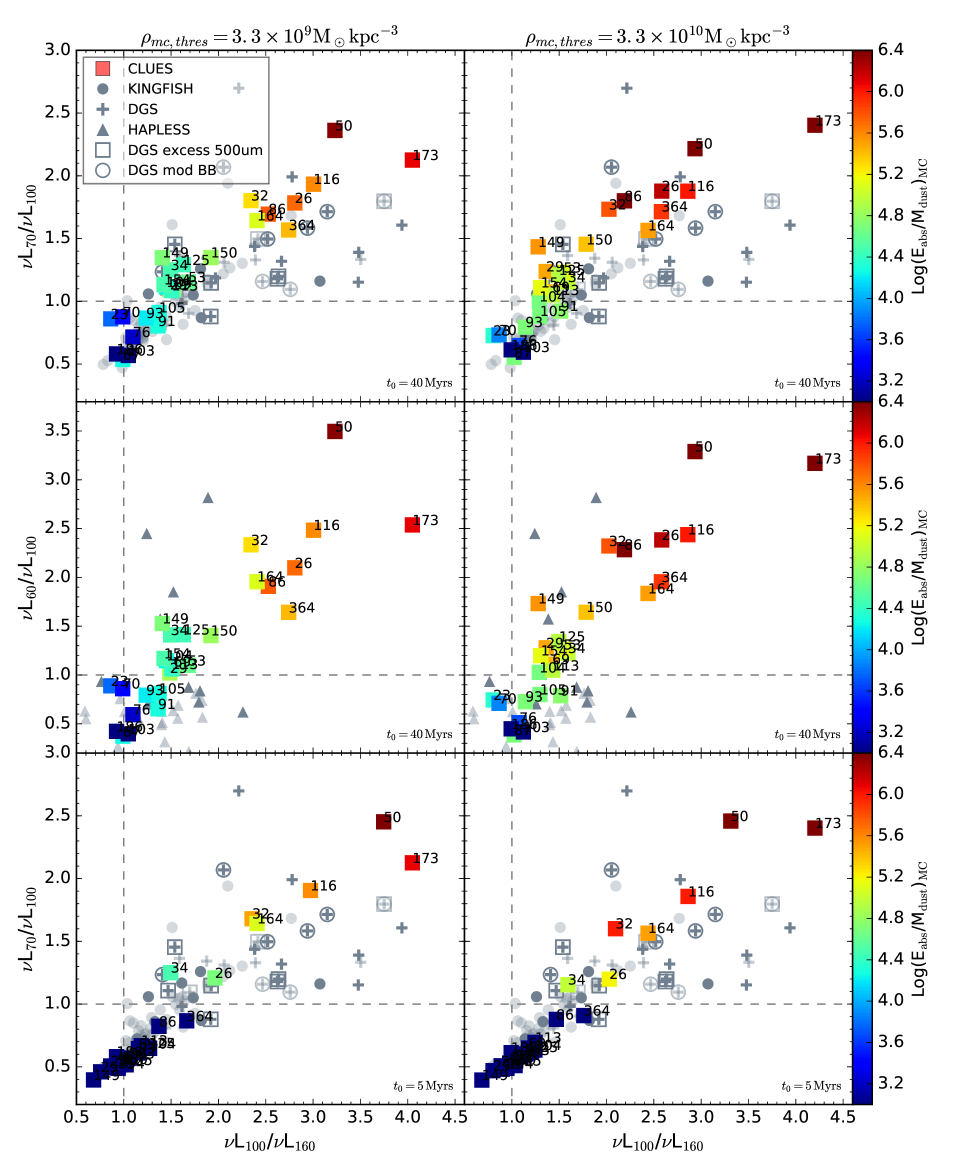
To quantify these behaviors, we show in Fig. 17 the PACS/PACS L70/L100 vs L100/L160 color-color diagram, which traces the peak of the SED (Rémy-Ruyer et al. 2013). CLUES star-forming dwarfs (filled squares) are colored according to the amount of energy absorbed by their MCs per unit dust mass in MCs, (Eabs/Mdust)MC (see colorbar). We assume that the energy absorbed by MCs is equal to their infrared luminosity (i.e., energy emitted), which we compute by integrating the MC curve between 4 and 2000 m. In the upper and lower panels we compare CLUES dwarf galaxies to the DGS (crosses) and KINGFISH (circles) samples, and in the middle panel we compare to HAPLESS galaxies (triangles). We show the HAPLESS sample separately from DGS and KINGFISH because as explained before, these galaxies were selected for their high dust content and are therefore a biased sample. The upper and lower panels differ in the value used. Contrasting symbols represent galaxies within the stellar mass range, while faint symbols stand for more massive galaxies. The two columns in the figure show results using different values for the gas density threshold that determines the molecular gas mass , 3.3109 or 3.31010 M⊙ kpc-3. As explained in Sect. 5.2, the first matches observational data assuming a metallicity-dependent CO-to-H2 conversion factor, while the higher parameter is required for fitting H2 masses calculated assuming the constant Galactic value.
The upper panels show most KINGFISH high-mass galaxies gathered in the lower left corner of the figure where L70/L1 and L100/L1, because they peak at high wavelengths. A few CLUES dwarfs whose MCs are poorly heated by young stars (blue squares, numbers 70, 76, 87, 103, and 186) have SEDs that also peak at around 100-160 m and thus appear in the same location.
However, most of the simulated, DGS and KINGFISH galaxies inside the ”dwarf” stellar mass range, show a different behavior. On one hand, those that show a maximum emission in the 20 - 40 m range (simulated dwarfs with dominant MC emission) consequently have L70/L1 and L100/L1, which places them in the upper right part of the diagram. We note that DGS galaxies whose SED data have been fit in Rémy-Ruyer et al. (2015) with an additional emission component as a MIR modified black body (marked with open circles) appear in this same area. On the other hand, galaxies showing an almost flat behavior in the m range of their SEDs are clustered closer to the L70/LL100/L position of the diagram.
To reinforce our interpretation that the warmer effective temperatures of MC dust grains in CLUES star-forming dwarfs are due to the higher energy absorption of this dust (per unit mass), we decreased the energy input from young stars to Myr, and repeated the SED calculation. The results are shown in the lower panels of Fig. 17. As expected, energy absorption by MCs decreased for most simulated galaxies, in some cases to the extent that their MC emission faded away to reveal the cirrus component (dark blue squares). As a result, they gather where the massive KINGFISH galaxies lie.
We therefore postulate that IR peak broadening in DGS galaxies, regardless of the peak position, has the same origin: the multi-temperature warm dust emission in MCs, heated by young stars. The two broadening types come from the relative intensity of the MCs and the cirrus maxima. The stronger the MC emission (we recall that the maxima appears in the 20 - 40 m range), the more displaced toward the right upper corner in the L70/L100 vs L100/L160 color-color diagram, tracing the peak of the SED.
In the middle panels of Fig. 17 we compare our results to HAPLESS444Note that here the available data are L60 instead of L70. dwarf galaxies, which are biased against low dust mass content. These galaxies therefore tend to have low values of the energy absorbed by MCs per unit dust mass, . Their SEDs are not expected to show MC emission dominance, but rather broad maxima typically in the range between and m, as is the case.
Finally, we compare the CLUES results shown in the left and right columns of Fig. 17 for different values of . The only difference is observed in the color of the representative points, which take higher values of (Eabs/Mdust)MC in the case of an approximately four times lower MH2 (=3.31010, right column), as expected: a lower molecular gas mass (which implies a lower amount of dust) absorbs the same energy coming from young stars. Nonetheless, the general arrangement of the points across the diagram does not vary, and therefore our conclusions remain valid.
6.3 Submillimeter excess and slope flattening
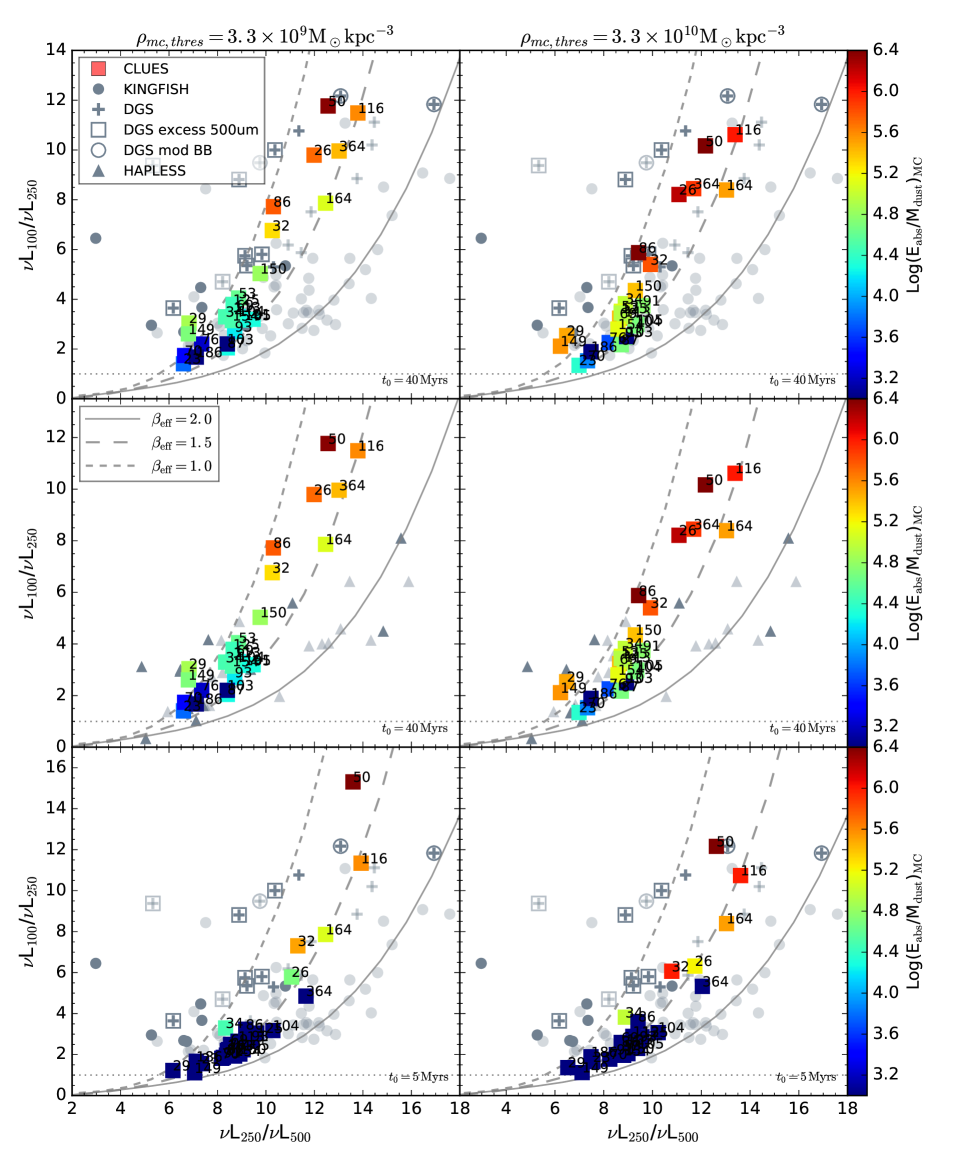
Figure 18 shows the PACS/SPIRE L100/L250 vs L250/L500 color-color diagram. The symbol and color-coding are the same as in Fig. 17.
This diagram reflects the variation in emissivity index , which is understood as a measure of the final FIR/submm slope of the SED (see Eq. 1). Physically, it is an intrinsic optical property of grains: a typical value of =2.0 is found for Galactic grains and is commonly used to model the SEDs of high-mass galaxies, showing a good agreement with data. In contrast, dwarf galaxies have been reported to present flatter slopes, reflecting an excess of emission at submm wavelengths.
In this study, both the MC and cirrus components were modeled assuming =2.0, but their combination yields a final effective slope –or – that in general departs from this value. Figure 18 shows three curves depicting the theoretical Herschel luminosity ratios obtained assuming modified black bodies of different fixed emissivity indices, which we accordingly also call , drawn from Fig. 10 in Rémy-Ruyer et al. (2013).
While the bulk of high-mass galaxies follow the higher (i.e., with no submm excess found), the observed dwarf galaxies present lower L250/L500 ratios, occupying the region. We note in particular the presence of the DGS galaxies marked in Rémy-Ruyer et al. (2013) as having an excess of emission at 500 m with respect to modified black body fits to the data (open squares). This indicates a general flattening of the submm SED slopes of these galaxies as compared to the SEDs of more massive and metal-rich galaxies. This same behavior is also observed in the SEDs of the CLUES star-forming dwarf galaxies.
When we analyze the figure in more detail, we see that CLUES dwarfs with an IR slope flattening caused by a dominant MC emission (i.e., numbers 26, 32, 50, 116, 164, 86, 150, and 364) appear between the and lines and toward the upper right corner, where the inequalities LL250 and LL500 clearly hold. On the other hand, when IR peak broadening is instead caused by a similar MC and cirrus peak intensity, the L100 luminosity is similar to, and in most cases only slightly higher than, L250, placing these cases close to the dotted line that represents the L100= L250 equality. Finally, CLUES galaxies with (almost) bare cirrus emission (dark blue squares, numbers 103, 76, 87, and 186) are the closest to the dotted line and also have the lowest L250/L500 ratios.
As in Fig. 17, the upper and lower panels of Fig. 18 differ in the MC escape timescale used in the GRASIL-3D run: Myr in the upper panels; Myr in the lower panels. When we use this lower value, far fewer CLUES galaxies have stars young enough to live in MCs, and thus the energy absorbed is very low (dark blue, see color bar). Their SEDs change to roughly present only the cirrus dust component, steepening their submm slopes and bringing their representative points between the lines corresponding to the 1.5 and 2.0 fits, where massive galaxies lie. We conclude that the heating of MCs by young stars drives the SED flattening around the 500 m SPIRE band.
HAPLESS galaxies (middle panels of Fig. 18) show the same general behaviour as DGS or KINGFISH, but we note that they tend to take lower L100/L250 values than DGS and KINGFISH because they mostly present two different emission components (see Fig. A2 of Clark et al. 2015), and it is rare for one of them to dominate over the other.
Comparing the two columns of Fig. 18, we again observe the subtle increase in the parameter (according to the color bar) when using =3.31010 M⊙ kpc-3, as a result of the lower MC dust mass. Since a lower amount of MC dust grains absorbs the same energy coming from young stars, MCs acquire a higher global effective temperature. On the other hand, the cirrus phase has gained the difference in dust mass, consequently decreasing its global temperature. These two temperature variations render a greater separation between both SED components. As a result, with a higher value of , the emergence of an excess of submm emission thanks to the combined contribution of the emission of the two dust components is more likely. This accounts for the slight displacement of points toward higher L250/L500 values, which is noticeable (barely) only in the case of simulated dwarf galaxies with similar MC and cirrus emission intensities. The global differences in the PACS/SPIRE diagram are nonetheless insignificant, therefore we can conclude that the interpretation of our results is independent of the gas density threshold value used, which translates in that it is independent of an average factor of 4 higher or lower MH2 in the galaxy. The effects of varying as well as the PDF dispersion are explored in detail in Sect. 7.4.
6.4 PAH emission
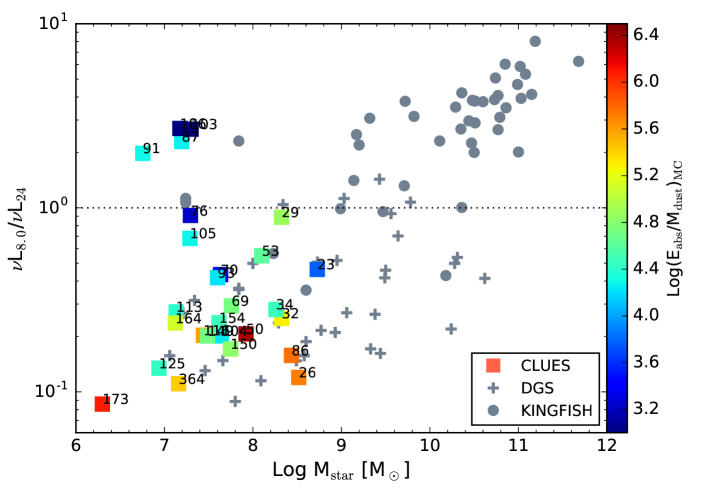
The PAH band emission in dwarf galaxy SEDs appears to be very weak, which has suggested the use of dust models with a low PAH abundance in order to explain the data. Here we use one such model, characterized by 1.12%, a suitable value for low-metallicity galaxies according to Draine et al. (2007) (see Sect. 2.2.4).
The L8.0/L24 ratio is a good estimator of the PAH peak intensities because it compares the strength of one of the most prominent peaks of the aromatic features (at m) and the luminosity immediately outside the PAH emission domain. Figure 8 shows this IRAC 8m/MIPS 24m Spitzer luminosity ratio compared to stellar mass. The majority of the CLUES star-forming dwarfs show very low PAH emission, the same as has been reported for DGS (Rémy-Ruyer et al. 2015). As we noted in Sect. 6.2, MC emission can i) completely hide PAH bands when the maximum of the MC emission is higher than the maximum of the cirrus component, or ii) partially hide PAH bands when both MC and cirrus maxima tend to have comparable strengths. Only dwarfs number 91, 87, 186, 103, and 76 in Fig. 8 show a mid-infrared emission where LL24. These are precisely the cases in which MC emission is poorer as a result of a low energy absorption from young stars (dark blue squares in the upper panels of Figs. 17 and Fig. 18). This situation prevents the concealment of PAH cirrus emission.
We propose that the weakness or lack of PAH emission in DGS galaxies could be caused by the combined contribution of i) a low PAH abundance and ii) warm dust emission from PAH-devoid MCs that partially or completely hides the cirrus PAH features.
We note that DGS galaxies show IRAS 22 m data instead of MIPS 24 m. CLUES luminosities at 22 m are similar to those at 24 m, only differing for the few galaxies mentioned above, where LL24. We therefore expect the few DGS galaxies with L8.0/L to slightly shift upward if the L24 data were available. This does not affect our results since these points would still be consistent with the rest of data inside the same stellar mass range. The rest of DGS galaxies would remain unaltered or even shift downward.
7 Discussion
7.1 Nature of the heating engine
According to Fig. 16, the cirrus components of the simulated dwarf galaxies peak between m, wavelengths at which usually the total SEDs of more massive and metal-rich galaxies peak. Figure 16 also shows that the emission from MCs is effectively hotter than usual, showing in addition a wider diversity of shapes among the different galaxies. In GRASIL-3D modeling, radiation from evolved stars heats the diffuse cirrus component where the bulk of dust resides. In contrast, MCs are heated by low emissions from young stars embedded in MCs. Therefore the amount of energy young stars inject into MCs, , is expected to be a key parameter to understand the particularities in the IR-submm region of dwarf galaxy SEDs. However, the MC grain temperature is most likely correlated to per unit dust mass, , as we show below. For this reason, simulated results are color-coded by this quantity in Figs. 17, 18, and 8.
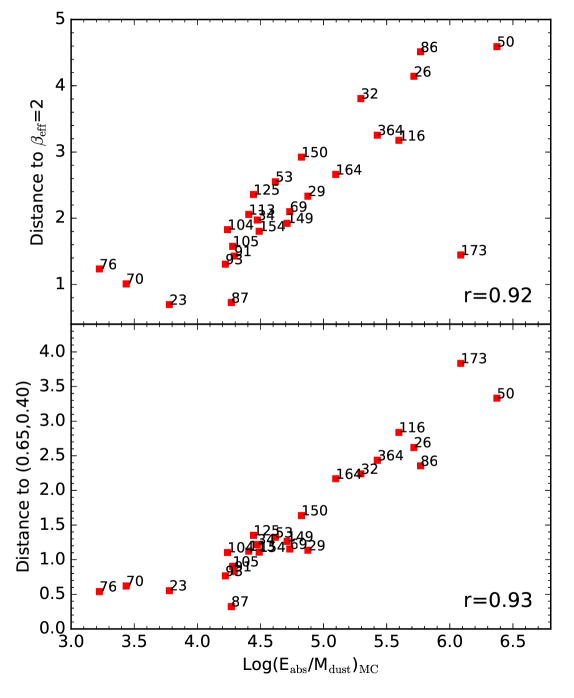
In Fig. 9 we show a measure of the energy injection effects by representing the correlation between the parameter and the distance to points of zero injection in Figs. 17 and 18. These points are the particular locations in each color-color diagram where galaxies lie when they are scarcely heated by young stars (appearing in dark blue color): the lower left corner of Fig. 17 and the =2 curve in Fig. 18.
The upper panel of Fig. 9 shows the distance from each CLUES dwarf in Fig. 18 to the =2 curve. Simulated dwarfs with the maximum ratio are farther away from this line than those with lower ratio values, the correlation having a Pearson coefficient of r=0.92. When we only use , that is, when we do not divide by the total MC dust mass, the correlation decreases to r=0.83. The lower panel of Fig. 9 shows the distance from the position of each simulated dwarf in Fig. 17 to the lower left corner of this diagram (approximately (0.65,0.40)), and again a clear correlation is visible, with r=0.93. When only is used, the scattering increases and yields r=0.79. We finally note that although not depicted, concerning PAH emission, low ratio values are correlated to high PAH emission, as can be deduced from Fig. 8. CLUES dwarf galaxies with low or very low PAH emissions correspond to high ratios.
Our findings are independent of the value: with the high-density threshold value ( M⊙kpc-3) the same clear correlations appear, improving when is taken by unit dust mass.
These results corroborate that the simulated galaxies’ global MC effective temperature, which defines the maxima location and drives the variability in the final IR-submm SED shapes, is adequately captured by the ratio.
7.2 Dependence of the results on the dust-to-gas mass assignation versus Z
As described in Sect. 2.2.3, for this particular study on dwarf galaxies we have assumed in GRASIL-3D a local dependence of the dust-to-gas mass ratio on metallicity following the broken power-law proposed in Table 1 of Rémy-Ruyer et al. (2014). This scaling consists of two power-laws, the low-metallicity end having a steeper slope that provides a lower total dust mass to such environments, as suggested observationally and by dust evolution models. For metal-richer galactic regions, in particular with metallicities 12+log(O/H), the standard convention of scaling the D/G ratio linearly with metallicity (”reference scaling” in Rémy-Ruyer et al. 2014) has been adopted, which is long known to satisfactorily fit data of normal metal-richer galaxies.
We computed the dust masses, SEDs, and IR-submm luminosities that result from assuming this reference scaling at all metallicities. Figure 10 shows the dust-to-gas mass ratios obtained in this case. Galaxies with 12+log(O/H) show no dispersion and end up with an excessive amount of dust as compared to data. However, the SEDs obtained with this dependence show that eventually this does not translate in a great difference in the final luminosities. In fact, only a few galaxies that have particularly very low global metallicities show perceptible changes in their SEDs (presenting a slightly stronger MC emission due to the now higher dust content), while the rest stay nearly the same. The reason for this low variation of the final SED is that the grid cells that contribute the most to the emission of a given galaxy are those with a higher dust content and thus a higher metallicity.
7.3 Dependence of the results on the dust model for cirrus
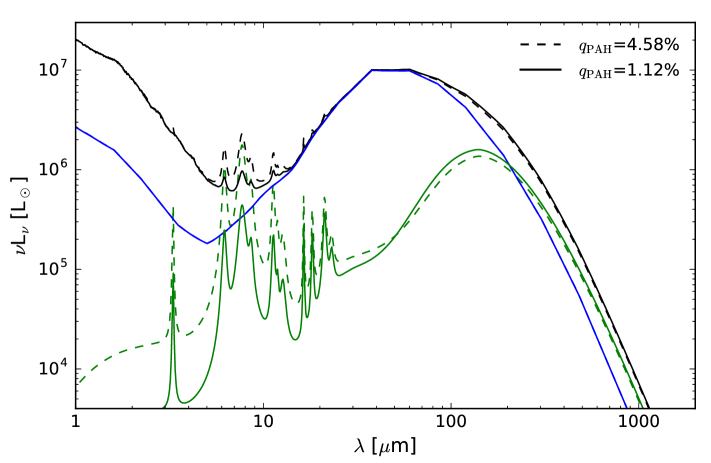
Spectra of low-metallicity galaxies show extremely low PAH band emission as compared to more metal-rich galaxies. The fact that the most prominent peaks in the mid-infrared region are due to single-photon heating of the smallest PAH grains has led modelers to consider the use of different dust models containing fewer very small PAH grains in order to match the data. In particular, Draine et al. (2007) proposed seven different models that are characterized by a different PAH index each, ranging from 0.47% to 4.58%, where lower values are more appropriate for low-metallicity galaxies, and the highest value corresponds to a Galactic abundance. In Fig. 11 we show the differences in the SED of galaxy number 150 (and specifically in its cirrus emission) between adopting the standard Galactic value of 4.58% and the value of reference used in this work, 1.12%. PAH bands in the latter case are indeed mitigated, while with a high they gain clear visibility. We note that the effect would be much weaker in the case of dwarfs with dominating MC emission in the MIR region.
7.4 Dependence of the results on parameter choices
Table 2 of DT14 shows the combinations of GRASIL-3D parameters used for their study of normal disk-like galaxies. All values proposed are within observationally measured ranges. Here we discuss the variation of
-
•
, the escape timescale from MCs;
-
•
and , the gas density threshold and the parameter that governs the log-normal PDF function to calculate the gas fraction in MCs; and
-
•
, the optical depth of MCs, which is dependent on the values of the mass and radii of single molecular clouds ( and ).
7.4.1 Escape timescale from molecular clouds
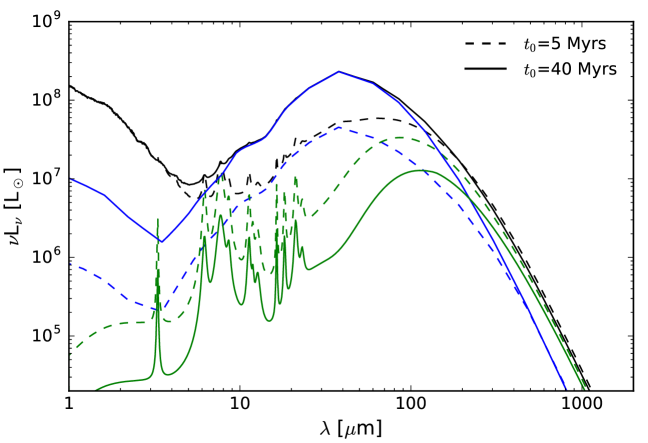
To vary means to vary the amount and spectral distribution of the stellar energy that heats the MCs. We show in Fig. 12 the SEDs obtained for galaxy number 26 with =5 Myr and =40 Myr. The higher the value, the higher the fraction of the total available stellar energy that heats the MCs. Since the mass of MCs remains the same but now it absorbs more energy, the global effective MC grain temperature increases. As a result, the peak of the MC component broadens in the mid-infrared region, covering the possible PAH cirrus emission. With a low value of , the percentage of galaxies in our sample with SEDs presenting the characteristic features observed in DGS, HAPLESS, and dwarf KINGFISH galaxies (i.e., IR peak broadening, submm slope flattening, and low PAH emission) decreases drastically, as has been shown before in the lower panels of Figs. 17 and 18. Within GRASIL-3D modeling, high values are therefore needed to account for dwarf SED properties. This is consistent with results of S98 and S99, who showed that a high value is necessary to reproduce the SEDs of star-bursting galaxies.
7.4.2 MC density threshold and PDF dispersion
This pair of parameters control the cirrus (HI) and MC (H2) masses, regardless of the value of the MC escape timescale . We have shown the subtle consequences of increasing in Figs. 17 and 18, which can be summarized in a slight additional warming of the MC component (per unit MC dust mass) as a result of a lower MC dust mass. In this section we show specific examples of the different SEDs obtained with different parametrizations.
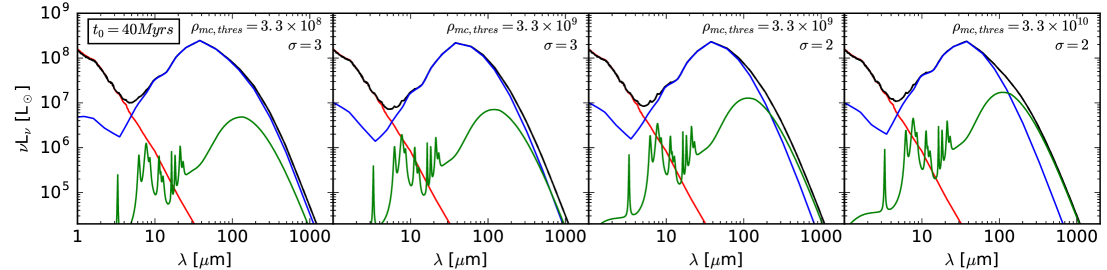
Maintaining a constant energy injection, Myr, we compare in Fig. 13 four combinations of these parameters ( [M⊙ kpc-3], ), in particular, the evolution in the SED of galaxy number 26 when using the following pairs of values: (3.3108, 3), (3.3109, 3), (3.3109, 2), and (3.31010, 2). This evolution from left to right corresponds to a progressive MC (cirrus) mass decrement (increment) inducing a global increment (decrement) of MC (cirrus) dust temperature. Both effects produce a gradual separation of the two dust components, which gives rise to a broader total IR peak and to a flatter submm slope.
In particular, for a fixed value of =3, the MC mass of galaxy number 26 is reduced by a factor of 1.4 from =3.3108 M⊙ kpc-3 to 3.3109 M⊙ kpc-3, while with =2, the MC mass is reduced by a factor of 3.8 from =3.3109 M⊙ kpc-3 to 3.31010 M⊙ kpc-3. We found similar results for all the simulated dwarfs in the sample. Furthermore, the central panels of Fig. 13 show that the effects of reducing the PDF dispersion from 3 to 2 are qualitatively the same (and quantitavely similar) to increasing the density threshold one order of magnitude: MC mass and emission decreases (by a factor of 2.8 for galaxy number 26) while the cirrus mass and emission increases. We note that although the SED of galaxy number 26 with =3.3108 M⊙ kpc-3 seems to satisfy all observed dwarf SED characteristics, the eventual H2 mass is at the limit of agreeing with observational data using a metallicity-dependent CO-to-H2 conversion factor, and it does not agree with data using a constant factor (see the middle and lower panels of Fig. 5.2). If the remaining galaxies in our sample change by a factor similar to galaxy number 26, not only would it lead to an excess of molecular gas, but to a great shortage of HI neutral gas. Therefore we do not consider this low =3.3108 M⊙ kpc-3 value in our study.
7.4.3 Masses and radii of molecular clouds
The values of and are constrained observationally to range typically between 105-106 M⊙ and 10-50 pc for normal spiral galaxies, as discussed in S98, S99, and DT14. We have studied the impact on the SED of varying the mass of single MCs within its allowed range, while fixing the radius at 14 pc. This approximation is consistent since it its their combined response () what matters, affecting the total emission through the optical depth of MCs .
We calculated the SEDs of galaxy number 26 taking =106, 3105 and 105 M⊙, and the rest of the parameters as usual. Figure 14 shows that as decreases, decreases (which means MCs absorb less energy per unit length). With extremely low a situation can be reached where UV photons escape from the MCs to the ISM, heating the cirrus. This would occur at the expense of the MIR emission of MCs, which gradually become unable to hide the already low PAH emission from the cirrus. In addition, in this case, the emission and temperature of the cirrus would increase, favoring PAH band detectability. We therefore used 106 M⊙ here to account for dwarfs with a very broad IR peak in the 20 - 40 m range and no detected PAH emission features.
8 Summary and conclusions
The IR-submm emission of low-metallicity dwarf galaxies considerably differs from that of more metal-rich dwarf galaxies. Signatures of warmer dust in dwarf galaxies were first found with IRAS and were later on confirmed with Spitzer. More recently, an important step forward in the analysis of their IR-submm emission was made thanks to the Herschel guaranteed time key program The Dwarf Galaxy Survey (DGS, Rémy-Ruyer et al. 2013). The surprising variety of SED shapes found therein (see also HAPLESS results, Clark et al. 2015) can be summarized as (1) a broadening of the IR peak of the SED, implying an additional warmer dust component; (2) an excess of emission in the submm (500 m) that causes a flattening of the submm/FIR slope; and (3) a very low intensity of PAH emission features.
To fit these particular SED patterns, observers change their modeling relative to the standard fixed in the FIR-submm range (see Eq. 1 and Rémy-Ruyer et al. 2013) and/or add new ad hoc additional dust components to it (Rémy-Ruyer et al. 2014, 2015; Clark et al. 2015). With the aim of going a step further and providing a physical explanation to these particular emission features, the SEDs of a sample of 27 simulated star-forming dwarf galaxies were analyzed in detail and compared to DGS, HAPLESS, and dwarf KINGFISH galaxies. The sample of simulated dwarf galaxies comes from a single simulation run with the GASOLINE code (Wadsley et al. 2004), out of initial conditions provided by the CLUES project (Constrained Local UniversE Simulations, Gottloeber et al. 2010; Yepes et al. 2014). These simulated dwarfs have stellar masses, star formation rates at , HI and H2 contents, and metallicities that satisfactorily reproduce observational dwarf galaxy data.
The IR-submm properties of the simulated sample were obtained from their SEDs, calculated using the GRASIL-3D radiation transfer code (Domínguez-Tenreiro et al. 2014). The particular strengths of GRASIL-3D compared to other codes can be summarized as follows: i) the radiative transfer is solved in a grid; ii) it is designed to separately treat the radiative transfer in molecular clouds (MCs) and in the diffuse cirrus component, whose dust compositions are different; iii) it takes into account that younger stars are associated with denser ISM environments by means of an age-dependent dust-reprocessing of stellar populations; iv) it includes a detailed non-equilibrium calculation for dust grains with diameter smaller than Å, as required. In GRASIL-3D modeling, by MCs we mean the densest subvolumes of the gas density distribution that surround young stars and absorb their high-energy photons. These emissions are reemitted in the IR-submm spectral range, with the radiative transfer equation solved with techniques appropriate for thick media (Granato & Danese 1994).
Thanks to the separate treatment of the radiative transfer in MCs and in the cirrus, the IR-submm SEDs of the simulated CLUES dwarfs can be directly decomposed into their MC and cirrus contributions. It has been found that these two components have clearly separated emission maxima, with that of the cirrus spanning some 50 m around m, a range where the maxima of normal galaxies often lie, while that of MCs appears at lower values and with a variety of shapes. The respective maxima imply that dust grains in MCs reach higher global effective temperatures than their counterparts in the cirrus. A second important element causing the diversity of emission features is the relative intensities of the MC and the cirrus emission at their maxima.
Two particular situations arise when i) one component (generally MC emission) clearly dominates or when ii) both components have similar heights at their respective maxima. Of course a continuum of possibilities exists in between these two, describing SEDs in Fig. 16. When MC emission dominates, a broad maximum typically appears in the 20 - 40 m range, providing MIR photons, and (partially) hiding PAH emissions in some cases. This can explain features 1 and 3 described above. Although less common, there are also some examples where cirrus emission dominates the SED and the characteristics of more massive metal-rich galaxies are recovered. A different situation arises when both the MC and cirrus emissions have similar intensities at their (separated) maxima, typically at and m, respectively. In this case, their combined emission is rather flat between the two maxima, and PAH emission hiding is less likely.
To quantify these behaviors, an analysis of the PACS/PACS L70/L100 vs L100/L160 color-color diagram, which traces the peak of the SED, was performed. Simulated galaxies with SEDs belonging to the previous situations appear segregated in this plot, with intermediate situations at intermediate plot locations. In addition, we found that the driving parameter that causes the segregation is the amount of energy young stars inject into MCs per unit dust mass , which takes higher values in the case of dominant MC emission (i.e., a broader IR peak).
Some simulated dwarfs show a flattening of the slope of their SED at submm wavelengths, as compared to that of more massive and metal-rich galaxies. These simulated dwarfs are precisely those whose MC and cirrus contributions are more separated from each other, their combination giving an effective excess of emission in the submm region (point 2 above). It is important to remark that although we used a fixed value of to model the individual MC and cirrus emissions, a lower final effective slope, , appears when they blend.
To further explore this effect, we used the PACS/SPIRE L100/L250 vs L250/L500 color-color diagram, which best reflects the variations of . By comparing our results to the theoretical luminosity ratios that would be obtained assuming a modified black body of different fixed (Fig. 10, Rémy-Ruyer et al. 2013), we found that CLUES dwarfs lie in between the = 1.5 and 1.0 lines, and off the = 2 line. A clear trend with the ratio is visible, with higher ratio dwarfs lying farther away from the = 2 line (i.e., representing no submm excess) than those with lower ratio. This is a strong suggestion that the parameter adequately describes and drives the submm excess shown by some CLUES dwarfs and, presumably, that of DGS, HAPLESS, and dwarf KINGFISH galaxies. This suggestion is corroborated by Fig. 9.
As said above, a high ratio implies MC emission in the MIR range, potentially hiding PAH band emissions. To be quantitative, we plotted the L8.0/L24 ratios versus the corresponding stellar masses and ratios. The result is that despite the low PAH abundance of the dust model adopted in this study (characterized by a PAH index of =1.12%), the lower the value, the more prominent the PAH band emission appears in the SED. This result strongly supports the idea that within our modeling, MC dust grains heated by young star light emit in the MIR range and hide the possible residual cirrus PAH band emission.
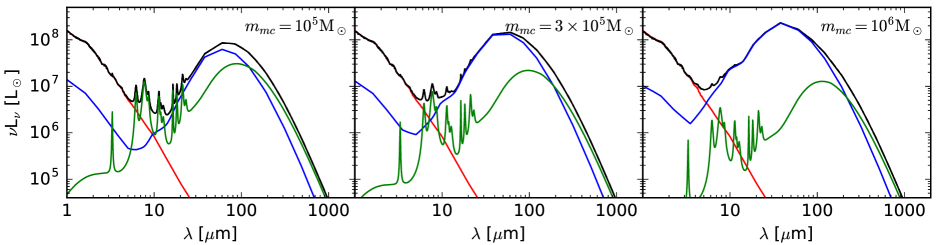
GRASIL-3D results depend upon i) the implementation of the dust-to-gas mass ratio dependence on metallicity, ii) the dust model, and iii) internal modeling parameters. Concerning i), a broken power-law dependence of the dust-to-gas mass ratio on metallicity has been set as suggested by dust evolution models in order to better match observed low-metallicity dwarf galaxy dust masses. This implementation does not produce an important effect on the final SEDs with respect to a linear scaling because of the higher influence of high-metallicity grid cells on the final total luminosities. Regarding ii), a simple dust model consisting of silicates, graphites, and carbonaceous PAH grains was assumed in both MCs and the cirrus, with the size distributions for each grain type following Weingartner & Draine (2001) and Draine & Li (2007). The very low PAH band emission observed in dwarf galaxies has compelled modelers to adopt dust models with low PAH abundances. In this study we also assumed such a model, characterized by a PAH index of 1.12%. We showed that although MC dominant emission in dwarf galaxies with very recent star formation can hide the possible PAH emission, which minimizes the ultimate relevance of this parameter, the use of a standard-Galactic value for this index (=4.58%) would lead to an overly easy visibility of PAH bands in the SEDs of a substantial fraction of the galaxies of our sample, which does not agree with DGS or dwarf KINGFISH statistics. We also note the importance of the prescription used in this work with respect to the PAH abundance in MCs, where it has been drastically lowered with respect to the cirrus (following Vega et al. 2005) in order to show no PAH band emission.
iii) Finally, in order for the SEDs of the simulated dwarf galaxies to recover the particular features of DGS, HAPLESS, and dwarf KINGFISH galaxies, the GRASIL-3D parameter space had to be somewhat limited. In particular, the lack of PAH emission detections demands high values for , (the time young stars are enshrouded within MCs) and excludes low values of the masses of individual MCs. The effects on the SED of varying the parameters determining the total MC mass in a given galaxy ( and ) are not that remarkable, but their values are limited by the final HI and H2 masses obtained. Different values for the gas density threshold are required in order to better match observational molecular gas mass data obtained by means of a metallicity-dependent or a constant-Galactic CO-to-H2 conversion factor. In particular, a value one order of magnitude higher is required for the latter case.
To summarize, the analysis of the SEDs of simulated star-forming dwarf galaxies, calculated with GRASIL-3D, and their comparison to real data from DGS, HAPLESS, and KINGFISH dwarfs, allows us to conclude the following.
-
•
The SEDs of simulated dwarf galaxies naturally reproduce the particular spectral features that observed dwarf galaxies show in the IR-submm region.
-
•
In this spectral range, the SEDs receive two contributions: one from dust in the diffuse gas component (cirrus), and a second contribution from dust in the densest component (MCs).
-
•
The emission maxima of the MC and cirrus components are clearly separated, with the former typically at m and the latter at m. The intensities of MCs and cirrus at their maxima can also differ.
-
•
These two variables (maxima separation and relative intensity of the two dust components at their maxima) are responsible for shaping the diversity of IR-submm SEDs of dwarf galaxies.
-
•
More specifically, broad peaks in the MIR region appear when MCs dominate the total emission, while SEDs with flat configurations between m result when the MC and cirrus emission components have similar peak intensities.
-
•
The submm excess can be explained as a result of the combination of the separated MC and cirrus contributions, with no need of imposing a value.
-
•
The lack of detected PAH emission is the result of i) a low proportion of PAHs in the total dust in the cirrus, plus ii) a wealth of MIR emission by hot dust grains within PAH-devoid MCs, hiding the possible residual cirrus PAH emission.
-
•
The driving parameter adequately describing these particular features is the amount of energy injected per unit dust mass in MCs. The energy comes from young star emissions.
-
•
The lower this parameter, the less apparent the particular features. In the limit of very low parameter values, the higher-mass higher-metallicity galaxy behavior is recovered.
Our conclusions are expected to remain valid when numerical models of dust formation and evolution are used, for example, if dust formation and evolution had been self-consistently implemented in the simulation. The reason is that the relevant regions of the parameter space consistent with observational data were explored with enough detail so as to cover the possible results of numerical models at .
Therefore, the GRASIL-3D two-component dust model gives a sound physical interpretation of the emission of low-mass low-metallicity (dwarf) galaxies, with dust grains within MCs potentially providing a wealth of MIR photons (i.e., the warm dust component). Combined with the emissions from colder grains within the cirrus, SEDs in the IR-submm range are obtained that satisfactorily agree with the particular patterns observed at these wavelengths.
Acknowledgements.
We would like to thank the referee, whose insightful comments have helped to improve the quality of this paper. We thank S. Gottloeber and G. Yepes for a careful reading of the manuscript and their comments. We thank the CLUES collaboration for providing the initial conditions for the simulation analyzed in this work. This work was partially supported through MINECO/FEDER (Spain) grants AYA2012-31101 and AYA2015-63810-P. ISS thanks financial support through the first grant. CB also thanks the Ramon y Cajal program. We acknowledge the Centro de Computación Científica (Universidad Autónoma de Madrid, Red Española de Supercomputación) for computational support. The CLUES simulations were performed and analyzed at the High Performance Computing Center Stuttgart (HLRS). We thank DEISA for access to computing resources through DECI projects SIMU-LU and SIMUGAL-LU and the generous allocation of resources from STFC’s DiRAC Facility (COSMOS: Galactic Archaeology), the DEISA consortium, co-funded through EU FP6 project RI-031513 and the FP7 project RI-222919 (through the DEISA Extreme Computing Initiative), the PRACE-2IP Project (FP7 RI-283493).References
- Aoyama et al. (2017) Aoyama, S., Hou, K.-C., Shimizu, I., et al. 2017, MNRAS, 466, 105
- Asano et al. (2013) Asano, R. S., Takeuchi, T. T., Hirashita, H., & Inoue, A. K. 2013, Earth, Planets, and Space, 65, 213
- Asplund et al. (2009) Asplund, M., Grevesse, N., Sauval, A. J., & Scott, P. 2009, ARA&A, 47, 481
- Baes & Dejonghe (2002) Baes, M. & Dejonghe, H. 2002, MNRAS, 335, 441
- Baes et al. (2005) Baes, M., Stamatellos, D., Davies, J. I., et al. 2005, New A, 10, 523
- Baes et al. (2011) Baes, M., Verstappen, J., De Looze, I., et al. 2011, ApJS, 196, 22
- Ballesteros-Paredes et al. (1999a) Ballesteros-Paredes, J., Hartmann, L., & Vázquez-Semadeni, E. 1999a, ApJ, 527, 285
- Ballesteros-Paredes et al. (1999b) Ballesteros-Paredes, J., Vázquez-Semadeni, E., & Scalo, J. 1999b, ApJ, 515, 286
- Baugh et al. (2005) Baugh, C. M., Lacey, C. G., Frenk, C. S., et al. 2005, MNRAS, 356, 1191
- Begum et al. (2008) Begum, A., Chengalur, J. N., Karachentsev, I. D., Sharina, M. E., & Kaisin, S. S. 2008, MNRAS, 386, 1667
- Bekki (2013) Bekki, K. 2013, MNRAS, 436, 2254
- Bekki (2015a) Bekki, K. 2015a, ApJ, 799, 166
- Bekki (2015b) Bekki, K. 2015b, MNRAS, 449, 1625
- Bendo et al. (2012a) Bendo, G. J., Boselli, A., Dariush, A., & et al. 2012a, MNRAS, 419, 1833
- Bendo et al. (2012b) Bendo, G. J., Boselli, A., Dariush, A., et al. 2012b, MNRAS, 419, 1833
- Bendo et al. (2012c) Bendo, G. J., Galliano, F., & Madden, S. C. 2012c, MNRAS, 423, 197
- Bendo et al. (2010) Bendo, G. J., Wilson, C. D., Pohlen, M., et al. 2010, A&A, 518, L65
- Benítez-Llambay et al. (2013) Benítez-Llambay, A., Navarro, J. F., Abadi, M. G., et al. 2013, ApJ, 763, L41
- Benítez-Llambay et al. (2015) Benítez-Llambay, A., Navarro, J. F., Abadi, M. G., et al. 2015, MNRAS, 450, 4207
- Benítez-Llambay et al. (2016) Benítez-Llambay, A., Navarro, J. F., Abadi, M. G., et al. 2016, MNRAS, 456, 1185
- Bolatto et al. (2013) Bolatto, A. D., Wolfire, M., & Leroy, A. K. 2013, ARA&A, 51, 207
- Boquien et al. (2011a) Boquien, M., Calzetti, D., Combes, F., & et al. 2011a, AJ, 142, 111
- Boquien et al. (2011b) Boquien, M., Calzetti, D., Combes, F., et al. 2011b, AJ, 142, 111
- Boselli et al. (2010) Boselli, A., Ciesla, L., Buat, V., & et al. 2010, A&A, 518, L61
- Boselli et al. (2012a) Boselli, A., Ciesla, L., Cortese, L., et al. 2012a, A&A, 540, A54
- Boselli et al. (2012b) Boselli, A., Ciesla, L., Cortese, L., & et al. 2012b, A&A, 540, A54
- Boselli et al. (2002) Boselli, A., Lequeux, J., & Gavazzi, G. 2002, A&A, 384, 33
- Bothwell et al. (2014) Bothwell, M. S., Wagg, J., Cicone, C., et al. 2014, MNRAS, 445, 2599
- Brunt et al. (2009) Brunt, C. M., Heyer, M. H., & Mac Low, M.-M. 2009, A&A, 504, 883
- Buck et al. (2016) Buck, T., Macciò, A. V., Obreja, A., et al. 2016, ArXiv e-prints [arXiv:1612.05277]
- Calura et al. (2008) Calura, F., Pipino, A., & Matteucci, F. 2008, A&A, 479, 669
- Calzetti et al. (2010) Calzetti, D., Wu, S.-Y., Hong, S., et al. 2010, ApJ, 714, 1256
- Cannon et al. (2006) Cannon, J. M., Walter, F., Armus, L., & et al. 2006, ApJ, 652, 1170
- Chakrabarti et al. (2008) Chakrabarti, S., Fenner, Y., Cox, T. J., Hernquist, L., & Whitney, B. A. 2008, ApJ, 688, 972
- Chakrabarti & Whitney (2009) Chakrabarti, S. & Whitney, B. A. 2009, ApJ, 690, 1432
- Ciesla et al. (2014) Ciesla, L., Boquien, M., Boselli, A., & et al. 2014, A&A, 565, A128
- Clark et al. (2015) Clark, C. J. R., Dunne, L., Gomez, H. L., & et al. 2015, MNRAS, 452, 397
- Cole et al. (2000) Cole, S., Lacey, C. G., Baugh, C. M., & Frenk, C. S. 2000, MNRAS, 319, 168
- Cook et al. (2009) Cook, M., Lapi, A., & Granato, G. L. 2009, MNRAS, 397, 534
- Dale et al. (2012) Dale, D. A., Aniano, G., Engelbracht, C. W., & et al. 2012, ApJ, 745, 95
- Dale et al. (2005) Dale, D. A., Bendo, G. J., Engelbracht, C. W., & et al. 2005, ApJ, 633, 857
- Dolphin et al. (2005) Dolphin, A. E., Weisz, D. R., Skillman, E. D., & Holtzman, J. A. 2005, ArXiv Astrophysics e-prints [astro-ph/0506430]
- Domínguez-Tenreiro et al. (2014) Domínguez-Tenreiro, R., Obreja, A., Granato, G. L., & et al. 2014, MNRAS, 439, 3868
- Draine (2003) Draine, B. T. 2003, ARA&A, 41, 241
- Draine et al. (2007) Draine, B. T., Dale, D. A., Bendo, G., et al. 2007, ApJ, 663, 866
- Draine & Li (2007) Draine, B. T. & Li, A. 2007, ApJ, 657, 810
- Dwek (1998) Dwek, E. 1998, ApJ, 501, 643
- Eales et al. (2010) Eales, S., Dunne, L., Clements, D., , & et al. 2010, PASP, 122, 499
- Elmegreen (2002) Elmegreen, B. G. 2002, ApJ, 577, 206
- Engelbracht et al. (2005) Engelbracht, C. W., Gordon, K. D., Rieke, G. H., et al. 2005, ApJ, 628, L29
- Engelbracht et al. (2008) Engelbracht, C. W., Rieke, G. H., Gordon, K. D., et al. 2008, ApJ, 678, 804
- Federrath et al. (2008) Federrath, C., Klessen, R. S., & Schmidt, W. 2008, ApJ, 688, L79
- Fontanot et al. (2009) Fontanot, F., De Lucia, G., Monaco, P., Somerville, R. S., & Santini, P. 2009, MNRAS, 397, 1776
- Fontanot et al. (2008) Fontanot, F., Monaco, P., Cristiani, S., & Tozzi, P. 2008, in 8th National Conference on AGN, ed. L. Lanteri, C. M. Raiteri, A. Capetti, & P. Rossi
- Galametz et al. (2012) Galametz, M., Kennicutt, R. C., Albrecht, M., et al. 2012, MNRAS, 425, 763
- Galametz et al. (2009) Galametz, M., Madden, S., Galliano, F., & et al. 2009, A&A, 508, 645
- Galametz et al. (2011) Galametz, M., Madden, S. C., Galliano, F., et al. 2011, A&A, 532, A56
- Galliano et al. (2008a) Galliano, F., Dwek, E., & Chanial, P. 2008a, ApJ, 672, 214
- Galliano et al. (2008b) Galliano, F., Dwek, E., & Chanial, P. 2008b, ApJ, 672, 214
- Galliano et al. (2011) Galliano, F., Hony, S., Bernard, J.-P., et al. 2011, A&A, 536, A88
- Galliano et al. (2003) Galliano, F., Madden, S. C., Jones, A. P., & et al. 2003, A&A, 407, 159
- Galliano et al. (2005) Galliano, F., Madden, S. C., Jones, A. P., Wilson, C. D., & Bernard, J.-P. 2005, A&A, 434, 867
- Gomez et al. (2012a) Gomez, H. L., Clark, C. J. R., & Nozawa, T. e. 2012a, MNRAS, 420, 3557
- Gomez et al. (2012b) Gomez, H. L., Krause, O., Barlow, M. J., & et al. 2012b, ApJ, 760, 96
- Gordon et al. (2008) Gordon, K. D., Engelbracht, C. W., Rieke, G. H., et al. 2008, ApJ, 682, 336
- Gottloeber et al. (2010) Gottloeber, S., Hoffman, Y., & Yepes, G. 2010, arXiv.1005.2687 [arXiv:1005.2687]
- Governato et al. (2010) Governato, F., Brook, C., Mayer, L., et al. 2010, Nature, 463, 203
- Goz et al. (2016) Goz, D., Monaco, P., Granato, G. L., et al. 2016, ArXiv e-prints [arXiv:1610.09843]
- Granato & Danese (1994) Granato, G. L. & Danese, L. 1994, MNRAS, 268, 235
- Granato et al. (2004) Granato, G. L., De Zotti, G., Silva, L., Bressan, A., & Danese, L. 2004, ApJ, 600, 580
- Granato et al. (2000) Granato, G. L., Lacey, C. G., Silva, L., et al. 2000, ApJ, 542, 710
- Granato et al. (2015) Granato, G. L., Ragone-Figueroa, C., Domínguez-Tenreiro, R., et al. 2015, MNRAS, 450, 1320
- Groves et al. (2008) Groves, B., Dopita, M. A., Sutherland, R. S., et al. 2008, ApJS, 176, 438
- Groves et al. (2015) Groves, B. A., Schinnerer, E., Leroy, A., & et al. 2015, ApJ, 799, 96
- Guedes et al. (2011) Guedes, J., Callegari, S., Madau, P., & Mayer, L. 2011, ApJ, 742, 76
- Guhathakurta & Draine (1989) Guhathakurta, P. & Draine, B. T. 1989, ApJ, 345, 230
- Hao et al. (2011) Hao, C.-N., Kennicutt, R. C., Johnson, B. D., et al. 2011, ApJ, 741, 124
- Haynes et al. (2011) Haynes, M. P., Giovanelli, R., Martin, A. M., et al. 2011, AJ, 142, 170
- Helfer et al. (2003) Helfer, T. T., Thornley, M. D., Regan, M. W., et al. 2003, ApJS, 145, 259
- Helou (1986) Helou, G. 1986, ApJ, 311, L33
- Hennebelle & Falgarone (2012) Hennebelle, P. & Falgarone, E. 2012, A&A Rev., 20, 55
- Hirashita & Ferrara (2002) Hirashita, H. & Ferrara, A. 2002, MNRAS, 337, 921
- Hirashita et al. (2002) Hirashita, H., Tajiri, Y. Y., & Kamaya, H. 2002, A&A, 388, 439
- Hunt et al. (2005) Hunt, L., Bianchi, S., & Maiolino, R. 2005, A&A, 434, 849
- Hunt et al. (2010) Hunt, L. K., Thuan, T. X., Izotov, Y. I., & Sauvage, M. 2010, ApJ, 712, 164
- Indebetouw et al. (2014) Indebetouw, R., Matsuura, M., Dwek, E., & et al. 2014, ApJ, 782, L2
- Izotov et al. (2014) Izotov, Y. I., Guseva, N. G., Fricke, K. J., Krügel, E., & Henkel, C. 2014, A&A, 570, A97
- James et al. (2002) James, A., Dunne, L., Eales, S., & Edmunds, M. G. 2002, MNRAS, 335, 753
- Jonsson (2004) Jonsson, P. 2004, PhD thesis, University of California, nta Cruz, California, USA
- Jonsson (2006) Jonsson, P. 2006, MNRAS, 372, 2
- Jonsson et al. (2009) Jonsson, P., Groves, B., & Cox, T. J. 2009, ArXiv e-prints [arXiv:0906.2156]
- Karachentsev et al. (2004) Karachentsev, I. D., Karachentseva, V. E., Huchtmeier, W. K., & Makarov, D. I. 2004, AJ, 127, 2031
- Kennicutt et al. (2011) Kennicutt, R. C., Calzetti, D., Aniano, G., & et al. 2011, PASP, 123, 1347
- Kennicutt & Evans (2012) Kennicutt, R. C. & Evans, N. J. 2012, ARA&A, 50, 531
- Kennicutt (1998) Kennicutt, Jr., R. C. 1998, ApJ, 498, 541
- Kennicutt et al. (2009a) Kennicutt, Jr., R. C., Hao, C.-N., Calzetti, D., & et al. 2009a, ApJ, 703, 1672
- Kennicutt et al. (2009b) Kennicutt, Jr., R. C., Hao, C.-N., Calzetti, D., et al. 2009b, ApJ, 703, 1672
- Knollmann & Knebe (2009) Knollmann, S. R. & Knebe, A. 2009, ApJS, 182, 608
- Lacey et al. (2008) Lacey, C. G., Baugh, C. M., Frenk, C. S., et al. 2008, MNRAS, 385, 1155
- Laor & Draine (1993) Laor, A. & Draine, B. T. 1993, ApJ, 402, 441
- Lapi et al. (2006) Lapi, A., Shankar, F., Mao, J., et al. 2006, ApJ, 650, 42
- Leroy et al. (2011) Leroy, A. K., Bolatto, A., Gordon, K., & et al. 2011, ApJ, 737, 12
- Leroy et al. (2009) Leroy, A. K., Walter, F., Bigiel, F., & et al. 2009, AJ, 137, 4670
- Leroy et al. (2008) Leroy, A. K., Walter, F., Brinks, E., & et al. 2008, AJ, 136, 2782
- Li & Draine (2001) Li, A. & Draine, B. T. 2001, ApJ, 554, 778
- Li et al. (2007) Li, Y., Hernquist, L., Robertson, B., et al. 2007, ApJ, 665, 187
- Li et al. (2008) Li, Y., Hopkins, P. F., Hernquist, L., et al. 2008, ApJ, 678, 41
- Lisenfeld & Ferrara (1998) Lisenfeld, U. & Ferrara, A. 1998, ApJ, 496, 145
- Madden et al. (2013) Madden, S. C., Rémy-Ruyer, A., Galametz, M., & et al. 2013, PASP, 125, 600
- Madden et al. (2014) Madden, S. C., Rémy-Ruyer, A., Galametz, M., & et al. 2014, PASP, 126, 1079
- Mateo (1998) Mateo, M. L. 1998, ARA&A, 36, 435
- Matsuura et al. (2015) Matsuura, M., Dwek, E., Barlow, M. J., & et al. 2015, ApJ, 800, 50
- McConnachie (2012) McConnachie, A. W. 2012, AJ, 144, 4
- McKinnon et al. (2016) McKinnon, R., Torrey, P., Vogelsberger, M., Hayward, C. C., & Marinacci, F. 2016, ArXiv e-prints [arXiv:1606.02714]
- Melisse & Israel (1994) Melisse, J. P. M. & Israel, F. P. 1994, A&A, 285
- Meyer et al. (2004) Meyer, M. J., Zwaan, M. A., Webster, R. L., et al. 2004, MNRAS, 350, 1195
- Monaco et al. (2007) Monaco, P., Fontanot, F., & Taffoni, G. 2007, MNRAS, 375, 1189
- Obreja et al. (2014) Obreja, A., Brook, C. B., Stinson, G., et al. 2014, MNRAS, 442, 1794
- O’Halloran et al. (2006) O’Halloran, B., Satyapal, S., & Dudik, R. P. 2006, ApJ, 641, 795
- Pilyugin & Thuan (2005) Pilyugin, L. S. & Thuan, T. X. 2005, ApJ, 631, 231
- Raiteri et al. (1996) Raiteri, C. M., Villata, M., & Navarro, J. F. 1996, A&A, 315, 105
- Rémy-Ruyer et al. (2014) Rémy-Ruyer, A., Madden, S. C., Galliano, F., et al. 2014, A&A, 563, A31
- Rémy-Ruyer et al. (2013) Rémy-Ruyer, A., Madden, S. C., Galliano, F., et al. 2013, A&A, 557, A95
- Rémy-Ruyer et al. (2015) Rémy-Ruyer, A., Madden, S. C., Galliano, F., et al. 2015, A&A, 582, A121
- Rosenberg et al. (2006) Rosenberg, J. L., Ashby, M. L. N., Salzer, J. J., & Huang, J.-S. 2006, ApJ, 636, 742
- Rosenberg et al. (2008) Rosenberg, J. L., Wu, Y., Le Floc’h, E., et al. 2008, ApJ, 674, 814
- Rowlands et al. (2014) Rowlands, K., Gomez, H. L., Dunne, L., & et al. 2014, MNRAS, 441, 1040
- Santos-Santos et al. (2016) Santos-Santos, I. M., Brook, C. B., Stinson, G., et al. 2016, MNRAS, 455, 476
- Schneider et al. (2012) Schneider, N., Csengeri, T., Hennemann, P., & et al. 2012, A&A, 540, L11
- Schruba et al. (2012) Schruba, A., Leroy, A. K., Walter, F., & et al. 2012, AJ, 143, 138
- Seok et al. (2014) Seok, J. Y., Hirashita, H., & Asano, R. S. 2014, MNRAS, 439, 2186
- Shen et al. (2010) Shen, S., Wadsley, J., & Stinson, G. 2010, MNRAS, 407, 1581
- Siebenmorgen & Kruegel (1992) Siebenmorgen, R. & Kruegel, E. 1992, A&A, 259, 614
- Silva (1999) Silva, L. 1999, PhD thesis, SISSA - Trieste, Italy
- Silva et al. (2005) Silva, L., De Zotti, G., Granato, G. L., Maiolino, R., & Danese, L. 2005, MNRAS, 357, 1295
- Silva et al. (1998) Silva, L., Granato, G. L., Bressan, A., & Danese, L. 1998, ApJ, 509, 103
- Smith et al. (2012) Smith, D. J. B., Dunne, L., da Cunha, E., & et al. 2012, MNRAS, 427, 703
- Smith et al. (2007) Smith, J. D. T., Draine, B. T., Dale, D. A., et al. 2007, ApJ, 656, 770
- Springob et al. (2005) Springob, C. M., Haynes, M. P., Giovanelli, R., & Kent, B. R. 2005, ApJS, 160, 149
- Steinacker et al. (2013) Steinacker, J., Baes, M., & Gordon, K. D. 2013, ARA&A, 51, 63
- Stinson et al. (2006) Stinson, G., Seth, A., Katz, N., et al. 2006, MNRAS, 373, 1074
- Tasker & Tan (2009) Tasker, E. J. & Tan, J. C. 2009, ApJ, 700, 358
- Taylor et al. (1998) Taylor, C. L., Kobulnicky, H. A., & Skillman, E. D. 1998, AJ, 116, 2746
- Thielemann et al. (1986) Thielemann, F.-K., Nomoto, K., & Yokoi, K. 1986, A&A, 158, 17
- Todini & Ferrara (2001) Todini, P. & Ferrara, A. 2001, MNRAS, 325, 726
- Tolstoy et al. (2009) Tolstoy, E., Hill, V., & Tosi, M. 2009, ARA&A, 47, 371
- Vega et al. (2005) Vega, O., Silva, L., Panuzzo, P., & et al. 2005, MNRAS, 364, 1286
- Wada & Norman (2007a) Wada, K. & Norman, C. A. 2007a, ApJ, 660, 276
- Wada & Norman (2007b) Wada, K. & Norman, C. A. 2007b, ApJ, 660, 276
- Wadsley et al. (2004) Wadsley, J. W., Stadel, J., & Quinn, T. 2004, New A, 9, 137
- Walter et al. (2008) Walter, F., Brinks, E., de Blok, W. J. G., & et al. 2008, AJ, 136, 2563
- Weidemann (1987) Weidemann, V. 1987, A&A, 188, 74
- Weingartner & Draine (2001) Weingartner, J. C. & Draine, B. T. 2001, ApJ, 548, 296
- Wilson (1995) Wilson, C. D. 1995, ApJ, 448, L97
- Wolfire et al. (2010) Wolfire, M. G., Hollenbach, D., & McKee, C. F. 2010, ApJ, 716, 1191
- Woosley & Weaver (1995) Woosley, S. E. & Weaver, T. A. 1995, ApJS, 101, 181
- Wu et al. (2011) Wu, R., Hogg, D. W., & Moustakas, J. 2011, ApJ, 730, 111
- Yajima et al. (2012) Yajima, H., Li, Y., Zhu, Q., & Abel, T. 2012, MNRAS, 424, 884
- Yepes et al. (2014) Yepes, G., Gottlöber, S., & Hoffman, Y. 2014, New A Rev., 58, 1
- Zubko et al. (2004) Zubko, V., Dwek, E., & Arendt, R. G. 2004, ApJS, 152, 211
| Galaxy | Log M∗ | Log Mgas | Log MHI | Log MH2 | Log Mdust | Log SFRz=0 | 12+log(O/H) |
|---|---|---|---|---|---|---|---|
| (M⊙) | (M⊙) | (M⊙) | (M⊙) | (M⊙) | (M⊙yr-1) | ||
| 23 | 8.73 | 8.70 | 8.48 | 7.81 | 5.69 | -2.85 | 7.62 |
| 26 | 8.52 | 8.77 | 8.54 | 7.96 | 5.29 | -1.55 | 7.32 |
| 29 | 8.32 | 8.97 | 8.81 | 7.60 | 5.16 | -2.56 | 7.01 |
| 32 | 8.32 | 8.25 | 7.96 | 7.59 | 5.18 | -1.79 | 7.82 |
| 34 | 8.26 | 8.53 | 8.33 | 7.58 | 5.12 | -3.39 | 7.21 |
| 50 | 7.92 | 8.44 | 8.24 | 7.48 | 4.81 | -0.76 | 7.25 |
| 53 | 8.10 | 8.34 | 8.06 | 7.66 | 4.82 | -2.15 | 7.52 |
| 69 | 7.76 | 8.04 | 7.84 | 7.10 | 4.74 | -1.89 | 7.60 |
| 70 | 7.63 | 7.82 | 7.43 | 7.33 | 4.92 | -3.18 | 7.69 |
| 76 | 7.29 | 7.70 | 7.31 | 7.21 | 4.68 | -3.60 | 7.75 |
| 86 | 8.44 | 8.75 | 8.58 | 7.52 | 5.05 | -1.06 | 6.98 |
| 87 | 7.20 | 7.78 | 7.39 | 7.29 | 4.19 | -3.18 | 7.45 |
| 91 | 6.76 | 7.59 | 7.22 | 7.07 | 3.48 | -3.33 | 7.17 |
| 93 | 7.60 | 7.74 | 7.40 | 7.18 | 4.68 | -2.78 | 7.89 |
| 103 | 7.30 | 7.37 | 7.23 | 0.00 | 4.04 | -2.89 | 7.64 |
| 104 | 7.64 | 7.80 | 7.38 | 7.34 | 4.66 | -2.88 | 7.69 |
| 105 | 7.29 | 7.80 | 7.39 | 7.33 | 4.25 | -2.95 | 7.42 |
| 113 | 7.13 | 7.50 | 7.22 | 6.81 | 4.25 | -2.80 | 7.76 |
| 116 | 7.44 | 7.81 | 7.43 | 7.31 | 4.47 | -2.63 | 7.65 |
| 125 | 6.94 | 7.46 | 7.11 | 6.93 | 4.40 | -2.87 | 7.69 |
| 149 | 7.49 | 7.42 | 7.23 | 6.36 | 4.54 | -2.78 | 8.00 |
| 150 | 7.75 | 8.27 | 7.99 | 7.59 | 4.72 | -1.66 | 7.35 |
| 154 | 7.62 | 7.81 | 7.56 | 7.05 | 4.67 | -2.38 | 7.72 |
| 164 | 7.12 | 7.47 | 7.03 | 7.04 | 4.28 | -3.37 | 7.66 |
| 173 | 6.30 | 7.48 | 7.00 | 7.09 | 3.09 | -3.11 | 7.08 |
| 186 | 7.17 | 7.31 | 7.17 | 0.00 | 3.97 | -3.20 | 7.60 |
| 364 | 7.16 | 7.46 | 7.08 | 6.95 | 3.69 | -2.79 | 7.50 |