Ce 3 hard x-ray photoelectron spectroscopy study of
the topological Kondo insulator CeRu4Sn6
Abstract
Bulk sensitive hard x-ray photoelectron spectroscopy data of the Ce 3 core level of CeRu4Sn6 are presented. Using a combination of full multiplet and configuration iteration model we were able to obtain an accurate lineshape analysis of the data, thereby taking into account correlations for the strong plasmon intensities. We conclude that CeRu4Sn6 is a moderately mixed valence compound with a weight of 8 % for the Ce configuration in the ground state.
keywords:
topological Kondo insulator , valence , hard x-ray photoelectron spectroscopy , full multiplet , single impurity Anderson model1 Introduction
Kondo insulators are presently experiencing a renaissance since they are promising candidates for correlated materials with nontrivial topology [1, 2, 3, 4, 5, 6, 7]. Such predictions caused a flurry of experimental investigations on SmB6 (see Ref. [7] and references therein) and more recently we suggested that also CeRu4Sn6 might be a good candidate for a strongly correlated material with topologically protected surface states [8].
CeRu4Sn6 is a tetragonal Kondo insulator where the hybridization of and conduction electrons leads to the opening of a gap [9, 10, 11, 12, 13] at low temperature. Accordingly, the resistivity rises as temperature decreases, but saturates below 10 K. Our recent spectroscopic investigation of CeRu4Sn6 showed that it has a large Kondo temperature of about 170 K and a ground state crystal-field symmetry ( = 1/2) [8] which is the favorable symmetry for strong hybridization and opening of a gap according to Dzero et al. [3, 4]. The opening of a gap in the presence of the = 1/2 symmetry is supported by our band structure calculations and we inferred that CeRu4Sn6 must be topologically non trivial.
In that work [8] we had deduced the Kondo temperature from the temperature evolution of the spectral weight in the -edge absorption data where we had detected the Lα1 emission line. A difficulty of the analysis of the -edge data in general is the assignment of the spectral weights, even when measured in the life time reduced partial fluorescence yield mode, since the line shape reflects the empty 5 density of states in the presence of the core hole. This uncertainty does not affect the temperature dependence but the absolute numbers for the spectral weights. In Ref. [8] we have been fitting empirical, identical line shapes to each configuration and found an absolute occupation of 6%. Hard x-ray photoelectron spectroscopy (HAXPES) is a bulk sensitive technique [14, 15, 16, 17] and its data can be analyzed more quantitatively [18, 19] than that of x-ray absorption.
In cerium based Kondo systems the electron in the shell hybridizes with the conduction electrons so that the resulting hybridized ground state is a mixed state that can be written as = + + where the main component is given by the trivalent configuration with additional contributions of the divalent and tetravalent states ( and ) with weights ( = 0,1,2). Here denotes one (two) hole in the valence states. A core hole acts differently on the respective configurations so that they are split in a PES and XAS experiment and the spectra exhibit three spectral weights that are related to the initial state admixtures. However, due to strong final state effects spectral weights and weights in the ground state are not related 1:1. Here a configuration interaction model is required for converting between the two. Plasmons may complicate the situation when they cover up or distort the spectral weights. In such cases the spectra have to be corrected for plasmons by performing a full multiplet calculation that contains the plasmons as part of the lineshape (see Analysis). Below we present HAXPES data of CeRu4Sn6 at T 90 K that have been analyzed quantitatively with the combination of a full multiplet and configuration interaction calculation.
2 Experiment & Analysis
Single crystals were grown by the self-flux floating-zone melting method using optical heating in a four-mirror furnace [20]. The samples are single grain and single phase, as shown by Laue and x-ray diffraction, scanning electron microscopy, and energy dispersive x-ray spectroscopy.
Hard x-ray core level photoemission spectra are performed at the Taiwan beamline BL12XU at the SPring-8 synchrotron radiation facility in Japan. The high incident energy of 6.47 keV ensures bulk sensitivity. The photo electrons were detected by a MB Scientific A-1HE analyzer with a pass energy of 200 meV in vertical geometry for the Ce 3 test measurement and in horizontal geometry [21] for the Ce 3 and Sn 3, yielding an instrumental FWHM of about 1 eV. The Fermi energy was determined by a Au thin film measured with same conditions. The samples were cooled down and cleaved in ultra high vacuum of 10-8 mbar and were then immediately transferred to the measurement position (pressure 310-10 mbar and T90 K). The quality of the sample and sample surface was verified by performing long energy scans that verify the absence of extra peaks (Fermi energy to 1500 eV binding energy).
We have analyzed the HAXPES data with a combination of full multiplet and configuration interaction model. We use the XTLS 9.0 code [22] for these calculations with input parameters from atomic calculations using Cowans atomic code [23]. The code uses a configuration interaction model based on a single non-dispersive valence state [24] combined with a full multiplet calculation. The plasmon parameters are determined from emission lines that are not subject to the configuration interaction, here the Sn 3, so that, once the overall lineshape of the multiplet is adjusted, the configuration interaction model only depends on four parameters, Coulomb exchange interaction between the electrons () and between the electrons and core hole (), the effective -electron binding energy f and the isotropic hybridization . These parameters are uniquely defined by the intensity ratios and energy differences of the three valence states in the spectra. More details about the simulation can be found in Ref. [25] and [26].
3 Results
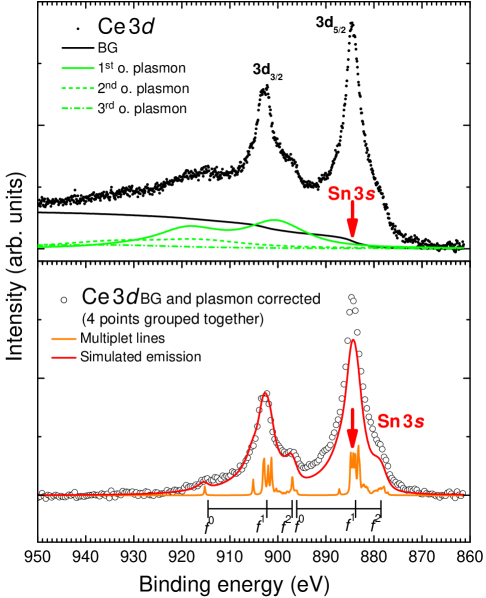
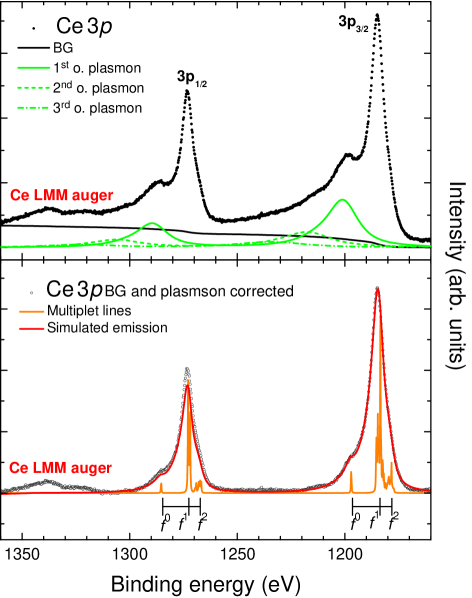
For the rare earth the 3 core level spectrum is typically used for determining the valence state. In Fig. 1 (top) the Ce 3 spectrum of CeRu4Sn6 is shown. There are two sets of emission lines due to the 3 spin-orbit splitting (3 and 3). However, in CeRu4Sn6 the Sn 3 emission appears at 885 eV binding energy (see red arrow) so that it severely distorts the spectral weights. We therefore measured the Ce 3 emission line which is shown in Fig. 2 (top). The advantage of the Ce 3 is also that the two spin-orbit contributions do not overlap because the spin-orbit coupling of the Ce 3 electrons is much stronger and the resulting splitting of the Ce 3 and Ce 3 much larger than for Ce 3 (note the different energy scales of Fig. 1 and 2). A drawback is the stronger intrinsic lifetime broadening due to the higher binding energy. The expected averaged energy positions of the configurations are marked by the ruler at the bottom of Fig. 1 and 2, respectively.
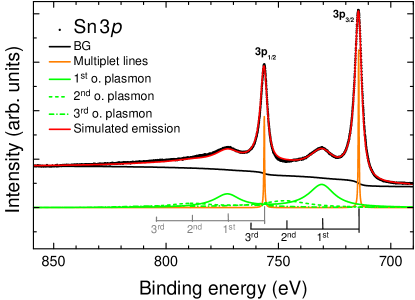
Before analyzing the Ce data further we look at the Sn 3 emission lines which are also spin orbit split (3 and 3) (see Fig. 3 (top)). The multiplet structure consists of a single emission line and Sn is not affected by the configuration interaction so that the additional humps at about 16 eV distance from the main emission lines are identified as strong plasmons. These plasmons have about the same energy distance from the main emission line as the expected contributions so that these plasmon intensities have to be taken into account when analyzing the Ce 3 spectra. After subtracting a Shirley-type background the plasmon parameters (energy positions, intensity ratios, and widths of 1st, 2nd, and 3rd order plasmons) are determined form the Sn 3 emission. In Fig. 3 (top) the black line shows the Shirley-type background and the green lines the plasmon contributions (solid 1 order, dashed 2 order, and dotted 3 order). The orange line is the multiplet line broadened with a Gaussian FWHM=1 eV and Lorentzian FWHM=3.1 eV as well as a Mahan lineshape with energy cut-off =8 eV and asymmetry factor =0.1, and the red line is the total fit. The plasmon parameters are listed in Table 1.
We now use these plasmon parameters for describing the Ce 3 multiplet structure i.e. we attach the plasmon of this shape and energy to each emission line [25, 26]. In Fig. 2 (top) the Shirley-type background (black) and resulting plasmon intensities (green) are shown. In the bottom part the background and plasmon corrected data are shown. There is clearly a strong shoulder at the energy position where we expect the spectral weight. The combination of multiplet and configuration interaction calculation yields the multiplet structure (orange). For the fit the multiplet emission lines are broadened with a Gaussian FWHM=1 eV, a Lorentzian FWHM=3.8 eV and a Mahan lineshape with energy cut-off =8 eV and asymmetry factor =0.4. The red line is the total fit. The resulting weights of the configurations in the initial state and the resulting configuration interaction parameters are listed in Table 2. The resulting weight () to the ground state amounts to 8%. The strong Lorentzian broadening and overlap between and limits the precise separation between theses contribution so that we give the sum of and . When fitting the main emphasis has been put on the Ce 3 part of the data since it is not affected by the Auger intensities.
As a consistency check the parameters from the Ce 3 emission data were used for Ce 3. The black and green lines in Fig. 1 (top) refer to the Shirley-type background and the plasmon intensities, using the parameters from Table 1. The bottom panel of Fig. 1 shows the background an plasmon corrected data (4 energy intervals grouped together), the multiplet structure (orange) resulting from the multiplet calculation with the configuration interactions parameters from Table 2 and the calculated emission (red line). The multiplet lines of the Ce 3 are broadened with a Gaussian FWHM=1 eV, a Lorentzian FWHM=1.6 eV and a Mahan lineshape with energy cut-off =8 eV and asymmetry factor =0.3. The Ce 3 part is quite well described while the Ce 3 shows some discrepancy between calculation and data. The latter was expected because of the contribution of Sn 3. Note, that the Ce 3 is still affected by the plasmon of the Sn 3.
| Order of plasmon | 1 | 2 | 3 | 4 |
|---|---|---|---|---|
| Scaling factor | 0.5 | 0.25 | 0.13 | 0.06 |
| Energy shift (eV) | 16.1 | 32.2 | 48.3 | 64.4 |
| Lorentzian FWHM (eV) | 10.0 | 20.0 | 30.0 | 40.0 |
| (eV) | (eV) | (eV) | (eV) | (%) | +(%) |
|---|---|---|---|---|---|
| 9.1(9) | 10.6(9) | -2.5(3) | 0.26(2) | 8(2) | 92(2) |
The present experiment and analysis of the Ce 3 core level emission data finds 8% of configuration in the initial state. The value is slightly larger than in our previous -edge absorption study [8] since in the present analysis final state effects have been taken into account. Comparing results of the same type of analysis, we can state that hybridization and occupation of of CeRu4Sn6 are only slightly larger than in CeRu2Si2, a magnetically non-ordering, metallic heavy fermion compound. However, ground state symmetries, that also have an impact on the efficiency of hybridization are not taken into account in such a comparison.
We summarize that the Ce 3 core level is an alternative to the Ce 3 for determining valencies with photoemission and the present work provides a more quantitative value for the absolute weight in the ground state of CeRu4Sn6, thus confirming its moderate intermediate valency.
Acknowledgment
K.C. M.S. and A.S. are grateful for support from the German funding agency DFG through Project 600575.
References
- [1] Dzero M, Sun K, Galitski V and Coleman P 2010 Phys. Rev. Lett. 104(10) 106408 http://link.aps.org/doi/10.1103/PhysRevLett.104.106408
- [2] Takimoto T 2011 Journal of the Physical Society of Japan 80 123710 http://dx.doi.org/10.1143/JPSJ.80.123710
- [3] Dzero M, Sun K, Coleman P and Galitski V 2012 Phys. Rev. B 85(4) 045130 http://link.aps.org/doi/10.1103/PhysRevB.85.045130
- [4] Dzero M and Galitski V 2013 Journal of Experimental and Theoretical Physics 117 499–507 ISSN 1090-6509 http://dx.doi.org/10.1134/S1063776113110083
- [5] Alexandrov V, Dzero M and Coleman P 2013 Phys. Rev. Lett. 111(22) 226403 http://link.aps.org/doi/10.1103/PhysRevLett.111.226403
- [6] Lu F, Zhao J, Weng H, Fang Z and Dai X 2013 Phys. Rev. Lett. 110(9) 096401 http://link.aps.org/doi/10.1103/PhysRevLett.110.096401
- [7] Dzero M, Xia J, Galitski V and Coleman P 2016 Annual Review of Condensed Matter Physics 7 249–280 http://dx.doi.org/10.1146/annurev-conmatphys-031214-014749
- [8] Sundermann M, Strigari F, Willers T, Winkler H, Prokofiev A, Ablett J, Rueff J P, Schmitz D, Weschke E, Moretti Sala M, Al-Zein A, Tanaka A, Haverkort M, Kasinathan D, Tjeng L, Paschen S and Severing A 2015 Scientific Reports 5 17937 http://dx.doi.org/10.1038/srep17937
- [9] Das I and Sampathkumaran E V 1992 Phys. Rev. B 46(7) 4250–4252 http://link.aps.org/doi/10.1103/PhysRevB.46.4250
- [10] Strydom A, Guo Z, Paschen S, Viennois R and Steglich F 2005 Physica B: Condensed Matter 359–361 293 – 295 ISSN 0921-4526 proceedings of the International Conference on Strongly Correlated Electron Systems http://www.sciencedirect.com/science/article/pii/S092145260500116X
- [11] Paschen S, Winkler H, Nezu T, Kriegisch M, Hilscher G, Custers J, Prokofiev A and Strydom A 2010 Journal of Physics: Conference Series 200 012156 http://stacks.iop.org/1742-6596/200/i=1/a=012156
- [12] Brüning E M, Brando M, Baenitz M, Bentien A, Strydom A M, Walstedt R E and Steglich F 2010 Phys. Rev. B 82(12) 125115 http://link.aps.org/doi/10.1103/PhysRevB.82.125115
- [13] Wissgott P and Held K 2016 The European Physical Journal B 89 1–7 ISSN 1434-6036 http://dx.doi.org/10.1140/epjb/e2015-60753-5
- [14] Tanuma S, Powell C and Penn D 2011 Surface and Interface Analysis 43 689–713 ISSN 1096-9918 http://dx.doi.org/10.1002/sia.3522
- [15] Braicovich L, Brookes N B, Dallera C, Salvietti M and Olcese G L 1997 Phys. Rev. B 56(23) 15047–15055 http://dx.doi.org/10.1103/PhysRevB.56.15047
- [16] Laubschat C, Weschke E, Holtz C, Domke M, Strebel O and Kaindl G 1990 Phys. Rev. Lett. 65(13) 1639–1642 http://dx.doi.org/10.1103/PhysRevLett.65.1639
- [17] Sekiyama A, Iwasaki T, Matsuda K, Saitoh Y, Onuki Y and Suga S 2000 Nature 403 396 – 398 http://dx.doi.org/10.1038/35000140
- [18] Allen J, Oh S, Gunnarsson O, Schönhammer K, Maple M, Torikachvili M and Lindau I 1986 Advances in Physics 35 275–316 http://dx.doi.org/10.1080/00018738600101901
- [19] Hüfner S 1992 Zeitschrift für Physik B Condensed Matter 86 241–246 ISSN 1431-584X http://dx.doi.org/10.1007/BF01313831
- [20] Prokofiev A and Paschen S 2012 Modern Aspects of Bulk Crystal and Thin Film Preparation (InTech) chap Crystal Growth and Stoichiometry of Strongly Correlated Intermetallic Cerium Compounds http://www.intechopen.com/books/modern-aspects-of-bulk-crystal-and-thin-film-preparation/crystal-growth-and-stoichiometry-of-strongly-correlated-intermetallic-cerium-compounds
- [21] Weinen J, Koehte T C, Agrestini S, Kasinathan D, Strigari F, Haupricht T, Liao Y F, Tsuei K D and Tjeng L H 2016 Hard X-ray Photoelectron Spectroscopy (HAXPES) (Springer International Publishing) chap 11 Springer Series in Surface Sciences 59 ISBN 978-3-319-24041-1 http://link.aps.org/doi/10.1007/978-3-319-24043-5
- [22] Tanaka A and Jo T 1994 J. Phys. Soc. Jpn. 63 2788–2807 http://dx.doi.org/10.1143/JPSJ.63.2788
- [23] Cowan R D 1981 The Theory of Atomic Structure and Spectra (Berkeley: University of Calivornia Press)
- [24] Imer J M and Wuilloud E 1987 Zeitschrift für Physik B Cond. Mat. 66 153–160 ISSN 0722-3277 http://dx.doi.org/10.1007/BF01311650
- [25] Strigari F, Sundermann M, Muro Y, Yutani K, Takabatake T, Tsuei K D, Liao Y, Tanaka A, Thalmeier P, Haverkort M, Tjeng L and Severing A 2015 Journal of Electron Spectroscopy and Related Phenomena 199 56–63 ISSN 0368-2048 http://www.sciencedirect.com/science/article/pii/S036820481500016X
- [26] Sundermann M, Strigari F, Willers T, Weinen J, Liao Y, Tsuei K D, Hiraoka N, Ishii H, Yamaoka H, Mizuki J, Zekko Y, Bauer E, Sarrao J, Thompson J, Lejay P, Muro Y, Yutani K, Takabatake T, Tanaka A, Hollmann N, Tjeng L and Severing A 2016 Journal of Electron Spectroscopy and Related Phenomena 209 1 – 8 ISSN 0368-2048 http://www.sciencedirect.com/science/article/pii/S0368204816300123