The Search for Multiple Populations in Magellanic Cloud Clusters II: The Detection of Multiple Populations in Three Intermediate-Age SMC Clusters††thanks: Based on observations made with the NASA/ESA Hubble Space Telescope, and obtained from the Hubble Legacy Archive, which is a collaboration between the Space Telescope Science Institute (STScI/NASA), the Space Telescope European Coordinating Facility (ST-ECF/ESA) and the Canadian Astronomy Data Centre (CADC/NRC/CSA).
Abstract
This is the second paper in our series about the search for multiple populations in Magellanic Cloud star clusters using the Hubble Space Telescope. Here we report the detection of multiple stellar populations in the colour-magnitude diagrams of the intermediate-age clusters Lindsay 1, NGC 416 and NGC 339. With ages between 6.0 and 7.5 Gyr, these clusters are the youngest ones in which chemical abundance spreads have been detected so far. This confirms that the appearance of multiple populations is not restricted to only ancient globular clusters, but may also be a common feature in clusters as young as 6 Gyr. Our results are in agreement with a recent spectroscopic study of Lindsay 1. We found that the fraction of enriched stars in NGC 416 is 45% whereas it is 25% in NGC 339 and 36% in Lindsay 1. Similar to NGC 121, these fractions are lower than the average value for globular clusters in the Milky Way.
keywords:
galaxies: star clusters: individual: Lindsay 1, NGC 339, NGC 416 – galaxies: individual: SMC – Hertzsprung–Russell and colour–magnitude diagrams – stars: abundances1 Introduction
The increasing precision in observing techniques has revolutionized our view of star clusters in the last few decades. It is now well established that old globular clusters (GCs) are not, as previously thought, simple stellar populations but are composed of multiple populations. The stars of the various populations show different (anti-)correlated abundances of light elements, the most prominent being the Na-O and C-N anti-correlations (e.g. Carretta et al., 2009a; Cannon et al., 1998). Moreover, some clusters additionally show a Mg-Al anti-correlation (e.g. Carretta et al., 2009b).
Multiple populations seem to be an inherent and universal property of GCs (with the only known possible exceptions being IC 4499 and Ruprecht 106 - Walker et al. 2011; Villanova et al. 2013) and their appearance seems not to depend on the environment of the cluster and the type of the host galaxy. Besides the extensively studied GCs in the Milky Way (see e.g. Gratton et al., 2012, for a review), also GCs in nearby dwarf galaxies host multiple populations, for example in the Fornax dwarf spheroidal galaxy (Larsen et al., 2014), the Sagittarius dwarf galaxy (Carretta et al., 2010; Carretta et al., 2014) and the Large Magellanic Cloud (LMC, Mucciarelli et al. 2009). Recently, Dalessandro et al. (2016) and Niederhofer et al. (2017, hereafter Paper I) also detected multiple populations in NGC 121, the only ’classical’ GC in the Small Magellanic Cloud (SMC). This cluster has an age of about 10.5 Gyr (Glatt et al., 2008a).
It is, however, still unclear if the appearance of multiple populations depends on when or how long ago the cluster formed. To date, there have been no clusters younger than 3 Gyr found with chemical abundance variations (see e.g. Mucciarelli et al., 2008; Mucciarelli et al., 2011; Mucciarelli et al., 2014; Davies et al., 2009; Cabrera-Ziri et al., 2016). Clusters that fill the age gap between 3 Gyr and 10 Gyr have to date been almost completely neglected by studies searching for multiple populations. So far, only Hollyhead et al. (2017) have studied a cluster that falls in this range of ages. They spectroscopically analyzed a sample of red giant branch (RGB) stars in the 7.5 Gyr old (Glatt et al., 2008b) cluster Lindsay 1 and found a significant variation in N amongst their sample of stars. This result provides the first evidence that multiple populations are likely to be present in clusters younger than about 10 Gyr.
Recently, we started a photometric survey of star clusters in the Magellanic Clouds covering a large range of ages and masses to search for anomalies in their colour-magnitude diagrams (CMDs) due to possible spreads in chemical abundances, mainly in N and C (see Paper I for details of the survey). Using this sample of targets, our goal is to establish the lower age limit down to which star clusters show evidence for multiple populations. As a first result of this study, we detected a bifurcation in the RGB of the 10.5 Gyr old SMC cluster NGC 121 (see Paper I), consistent with the independent study by Dalessandro et al. (2016). Here, we present the analysis of three more SMC clusters, Lindsay 1, NGC 339 and NGC 416, which have ages between 6.0 and 7.5 Gyr (Glatt et al., 2008b). Table 1 lists the basic parameters of the three clusters.
This paper is structured as follows: We briefly describe the observations and data reduction procedures in §2. The analysis and the results are shown in §3. In §4 we present the discussion of our results and draw final conclusions.
| Cluster Name | RA | Dec | Age | Ref. | Mass | Ref. | Metallicity Z | Ref. |
|---|---|---|---|---|---|---|---|---|
| [Gyr] | [105 M☉] | |||||||
| Lindsay 1 | 00h 03m 54s.0 | -73 28 18 | 7.5 | (1) | 2.0 | (2) | 0.001a | (1) |
| NGC 339 | 00h 57m 48s.90 | -74 28 00.2 | 6.0 | (1) | 0.8 | (3) | 0.001a | (1) |
| NGC 416 | 01h 07m 54s.98 | -72 20 50.6 | 6.0 | (1) | 1.6 | (3) | 0.002a | (1) |
2 Observations and Data Reduction
The observations for the clusters analyzed in this paper are from our ongoing Hubble Space Telescope (HST) survey (GO-14069, PI. N. Bastian). All three targets have been observed with the WFC3/UVIS instrument in the near-UV/optical wide-band filters and , as well as in the narrow-band filter , with long, intermediate and short exposures. These filters are particularly suitable to separate populations with varying N and C abundances in the CMD. The and filters contain a strong NH absorption band whereas the filter has a CH absorption feature within its pass-band (see Larsen et al. 2015, Paper I). Additionally, we also use archival observations of NGC 339 in the and filters from the program GO-10396 (PI: J.Gallagher), taken with the ACS/WFC instrument.
For the photometry, we used the images that have been corrected for imperfect charge transfer efficiency (CTE) and calibrated through the standard HST pipeline for bias, dark, low-frequency flats and new improved UVIS zero-points Ryan et al. (2016). We derived the stellar photometry using the spatially variable "effective point spread function" (ePSF) method (J. Anderson, private communication). The instrumental magnitudes were then transformed into the VEGAMAG system using the newly derived improved UVIS VEGAMAG zero-points from the WFC3 instrument website. Finally, the derived stellar positions were corrected for the WFC3/UVIS geometric distortion (Bellini et al., 2011).
The ACS/WFC observations were processed in a similar manner. For the photometry we used the ePSF libraries for ACS/WFC (Anderson & King, 2006). The transformations of the instrumental magnitudes into the VEGAMAG system were performed with the corrections described in Sirianni et al. (2005). We refer the interested reader to Paper I where the survey and the photometric techniques are described in more detail.
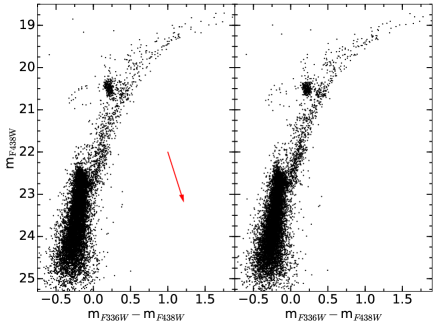
Inspecting the CMDs for the clusters, we found that the data for NGC 416 is severely affected by differential reddening across the extent of the cluster. This is reflected in the poorly defined features in the CMD and in the extended red clump morphology along the direction of the reddening vector (see left-hand panel in Figure 1). We therefore corrected the data for NGC 416 using the technique that is explained in detail in Milone et al. (2012). The resulting corrected CMD is displayed in the right-hand panel of Figure 1. We see that the various features now show less scatter and also the red clump has a more compact shape. We use the corrected magnitudes and colours for our further analysis.
Finally, we statistically subtracted any field star contamination from the cluster CMDs. For this, we selected a field centred on the cluster and a reference field of equal area, maximizing the spatial separation between the two fields. We then removed for each star in the CMD of the reference field the star that is closest in colour-magnitude space (within certain thresholds) from the cluster’s CMD (see e.g. Niederhofer et al., 2015). This procedure, however, only works for NGC 339 and NGC 416 as they have a compact structure. We could not clean the CMD of Lindsay 1 for field stars as it is too extended to define a reasonable reference field for the subtraction within our single pointing (162162 field-of-view; Glatt et al. 2009 reported a core radius of 617). The field star contamination in the CMD of Lindsay 1 is expected to be minimal, though, as the cluster is located in the outskirts of the SMC.
3 Analysis
 |
 |
 |
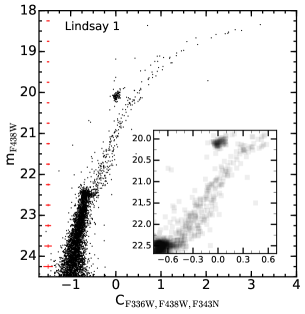
In Paper I, we found that a filter combination of the form as the CMD’s colour-axis is best suited to separate populations with different C and N abundances. The models predict a splitting in the RGB with this filter combination. Stars with a primordial composition (first population) follow a bluer/brighter sequence whereas stars enriched in N and depleted in C (second population) lie on a redder/fainter track.
3.1 The Structure of the RGB in Lindsay 1, NGC 399 and NGC 416
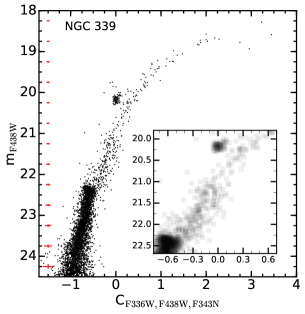
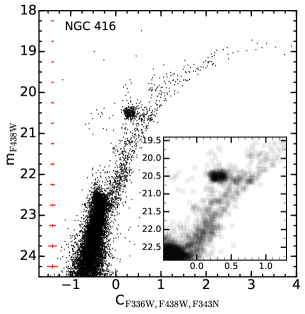
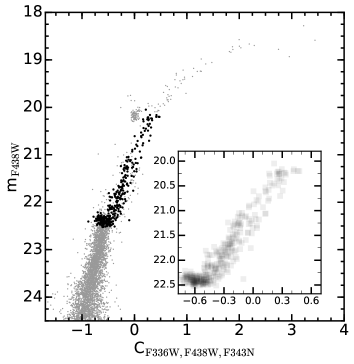
Figure 2 shows the CMDs for the three clusters using this pseudo colour as the abscissa. All clusters reveal a broadening/split in the lower parts of their RGB, indicative of the presence of multiple populations. The inlays in each panel of Figure 2 show a Hess diagram zooming in on the RGB region of the respective cluster. In these diagrams, the splitting of the RGB is most obvious in Lindsay 1 and NGC 416. The CMD of NGC 416 which has the most populated RGB, even shows the presence of two individual RGB bumps at 20.6 mag right next to the red clump (Figure 2 right-hand panel). The RGB of NGC 339 is more scattered and does not show a bifurcation, but it is clearly broadened in its lower parts (Figure 2 middle panel).
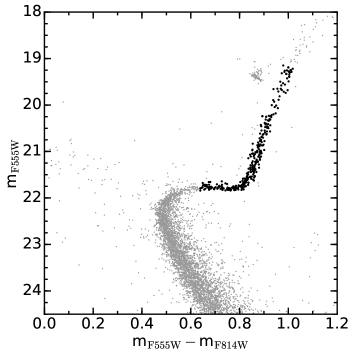
The RGB in NGC 339 might still be contaminated by a younger, more metal-rich field star population that was not entirely subtracted by our statistical de-contamination procedure. Such a population crosses the RGB in the used filter combination thus mimicking enriched cluster stars on the lower RGB. The bend-like structure in the RGB at a magnitude of 21.25 might indicate that the broadened RGB of NGC 339 still contains some contribution of field stars that cannot be discriminated from actual second population stars. This degeneracy can be broken, when using observations in optical filters. In order to get a cleaner sample of stars belonging to the red RGB stars in the vs CMD of NGC 339 we constructed a CMD using the optical filters and (see upper panel of Figure 3). In this filter combination, the younger field population lies blue-ward of the main sequence. In a first step, we used the optical filters to statistically subtract the field star contamination form the cluster data. As can be seen in the upper panel of Figure 3, there is still some contribution from a younger populations left in the CMD. We therefore selected a sample of fiducial RGB stars in the vs CMD and used this sample for our further analysis. In Figure 3 the selected RGB stars are marked with black dots in both CMDs. The vs CMD clearly shows that there was indeed a considerable fraction of an unrelated population present in the lower RGB (Figure 3 lower panel). But the lower RGB is still broadened, indicating that there is indeed a second population present in the cluster.
 |
 |
 |
 |
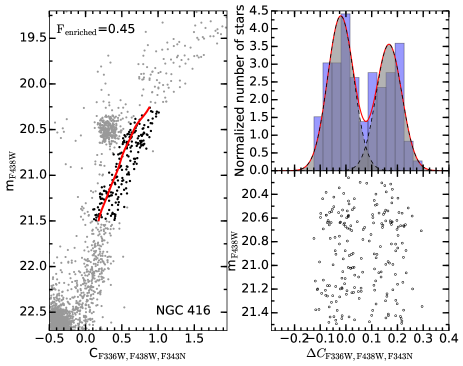 |
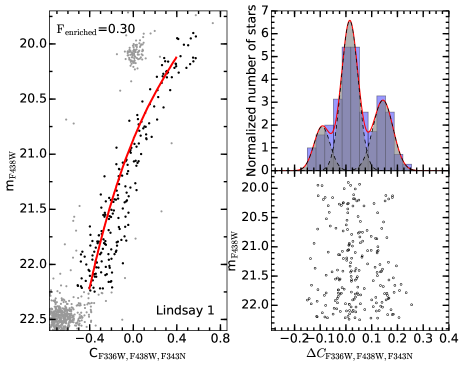
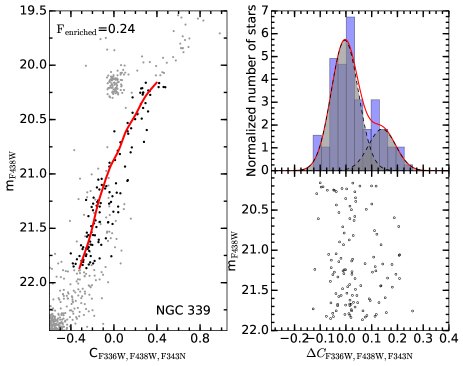
In order to analyze the structure of the RGBs in the three clusters we fitted a fiducial line to the blue sequence of the RGB and calculated for each star the distance from this line (see Figure 4, the lower right figure of each panel). The stars of Lindsay 1 and NGC 416 show a clear bi-modal pseudo-colour distribution. NGC 339 shows a less clear pattern as the RGB stars are more scattered there. But the lower part of the RGB is significantly broadened to the red and this spread is comparable to the separation of the two sequences in NGC 416 and Lindsay 1.
3.2 The Fraction of Enriched Stars
We now use Gaussian Mixture Models (GMMs) with a variable number of components to fit the distribution along the axis of the individual stars in the three verticalized CMDs. To find the number of Gaussians that reproduce the observed distribution best, we used the Akaike Information Criterion (AIC, Akaike 1974). The results are shown in the upper right plots of Figure 4. There, we also show the binned data in the form of a histogram for a comparison. The distribution of the unbinned RGB stars in NGC 339 and NGC 416 is best fitted with a two-component Gaussian whereas the fit to the data of Lindsay 1 favours three components. We define the fraction of enriched stars as the weight of the Gaussian fitting for the red sequence in each cluster. We find that in Lindsay 1 the fraction of enriched stars is 30%, in NGC 339 there are 24% enriched stars and NGC 416 has 45% stars that belong to the second population.
The exact fraction of first to second population stars, however, slightly depends on the exact choice of the RGB fiducial line which cannot unambiguously be defined in clusters with a sparsely populated RGB. We note here that the CMD of Lindsay 1 has not been cleaned for any field-star component. There might be a certain fraction of stars not related to the cluster in the part of the CMD that we used for estimating the fraction of enriched stars. However, note that Parisi et al. (2016) find that the field stars around Lindsay 1 are generally more metal-poor than the cluster, and would thus presumably lie mostly blue-ward of the cluster RGB, meaning we would overestimate the fraction of primordial Lindsay 1 stars and thus underestimate the fraction of enriched stars. It is also possible that the sparse blue component of the verticalized RGB is due to these metal-poor field stars. When excluding this blue peak from the calculation, we found a fraction of 36% enriched stars in Lindsay 1.
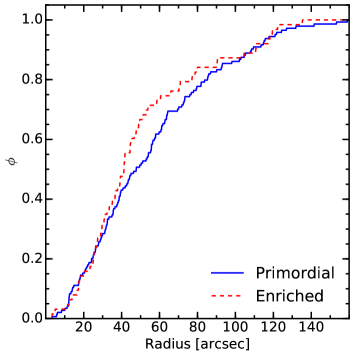
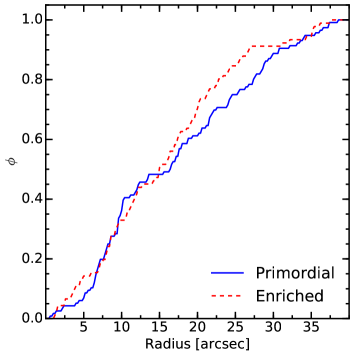
The fraction of enriched stars in NGC 339 is affected by stars not related to the cluster, as the sequence of the second population contains most likely still a considerable contribution of field stars. Therefore, we used observations in the and filters to get a cleaner sample of RGB stars. We do not have this problem in NGC 416, as we are estimating the fraction of enriched stars above the point where the field star sequence crosses the RGB of the cluster. In order to test if there is a considerable amount of stars within the two RGB branches that do not belong either to Lindsay 1 or NGC 416, we looked at the cumulative distribution of the two sequences as a function of the distance from the cluster centre. These distributions are shown in Figure 5. In both clusters, the red and the blue sequence follow a similar distribution, suggesting that none of the branches is dominated by unrelated field stars.
 |
 |
3.3 Comparison with Spectroscopic Results
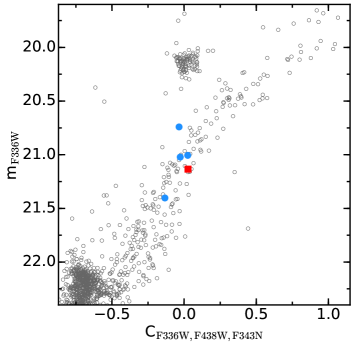
Recently, Hollyhead et al. (2017) spectroscopically studied the N and C content of 16 RGB stars that have been identified to be members of Lindsay 1. They found that six stars in their sample are significantly enhanced in N compared to the other stars, e.g. up to [N/Fe]1.3 dex. The analysed stars are fainter than the bump in the luminosity function. Therefore internal mixing has a negligible impact in changing their C and N content, from which they conclude that the enhancement in N is evidence of a second population within Lindsay 1. We can now compare their spectroscopic results with our photometric data as a consistency check. For this, we cross-correlated the coordinates of the stars in their sample with the stellar positions in our photometric catalogue. We found that in total there are five cluster stars analyzed by Hollyhead et al. (2017) that are within our field-of-view. One of them was determined to be enhanced in N, the other four have a primordial composition. We marked the stars in our CMD of Lindsay 1 (see Figure 6). The red filled square is the star enriched in N, whereas the blue filled circles indicate primordial stars. We can see that the enriched star lies on the faint sequence whereas all stars with a primordial composition follow the brighter RGB. This was as expected, as the models predict that second population stars (stars enhanced in N) follow a redder RGB sequence.
4 Discussion and Conclusions
We presented HST photometry for the three SMC intermediate-age clusters Lindsay 1, NGC 339 and NGC 416. Using the pseudo colour index , we were able to detect a splitting in their RGBs, characteristic of the presence of multiple populations within the clusters. The results obtained in this paper provide an independent confirmation of the findings by Hollyhead et al. (2017) who spectroscopically detected variations in N abundances in a sample of RGB stars in Lindsay 1.
We determined the fraction of second population stars within the innermost regions of the clusters to be between 25% and 50% which is lower than the median value in Galactic GCs where the enriched stars typically outnumber the primordial population by a factor of 2 (e.g. Bastian & Lardo, 2015). We note, however, that the values in Bastian & Lardo (2015) are mainly from spectroscopic analyses and sample mostly the outskirts of the clusters. In NGC 121, a SMC star cluster as well, the enriched stars also make up only 30% of the total stellar mass (Dalessandro et al., 2016, Paper I). It seems unlikely that this low fraction of second population stars is related to the mass of the cluster, as NGC 121 has a mass of M☉ (Mackey & Gilmore, 2003; McLaughlin & van der Marel, 2005), comparable to typical masses of Milky Way GCs. As star clusters in the SMC seem to have a systematically lower fraction of second population stars than Galactic GCs, it might be that this fraction is dependent on the environment in which the cluster has formed. It is difficult to evaluate whether the enriched stellar fraction in SMC clusters correlates with the mass of the cluster, as the fractions of enriched stars reported here are uncertain. Mucciarelli et al. (2009) spectroscopically studied three GCs in the LMC and found a Na-O anti-correlation within these clusters. The number of stars analyzed in each cluster, however, is too small to determine the fraction of enriched stars in LMC GCs.
Lindsay 1, NGC 339 and NGC 416 are so far the youngest star clusters known to show star-to-star variations in light element abundances. These clusters are significantly younger than the ancient Galactic and extragalactic GCs showing multiple populations. We even detect a splitting in the RGB of the very extended cluster Lindsay 1 therefore it appears that even low-density clusters can be capable of forming multiple populations. We also note here, that the density of a cluster alone is not a sufficient criterion whether a cluster is capable in hosting multiple populations. In order to characterize the compactness of a cluster, Krause et al. (2016) defined the compactness index as , where is the stellar mass of the cluster and its half-mass radius. Using the values for Lindsay 1 as given in Glatt et al. (2011), we find a index of 0.12. The Galactic open cluster NGC 6791 (Berkeley 46) has a smaller mass than Lindsay 1 but the same index as Lindsay 1 (Krause et al., 2016). However, the open cluster has been shown not to host multiple populations (Bragaglia et al., 2014).
The fact that we detect a splitting in the RGB in all three clusters suggests multiple populations are also a common characteristic of clusters with ages as young as 6 Gyr, and possibly even younger. This implies that the occurrence of this feature which is typical for GCs is not an early cosmological effect. Whatever process is causing the formation of multiple populations must have acted down to a redshift of, at most, z=0.65, where the conditions for cluster formation are expected to be similar to that observed in galaxies with a high cluster formation rate today (there is no significant change in the star formation rate within the SMC 6 - 8 Gyr ago, Weisz et al. 2013). Hence, we might expect multiple populations to be present in even young clusters, as well. This would provide a direct link between young massive clusters forming today and old GCs, as predicted by several theories of cluster formation (e.g. Schweizer, 1987; Ashman & Zepf, 1992; Kruijssen, 2015). However, studies by, e.g. Mucciarelli et al. (2008); Mucciarelli et al. (2011); Mucciarelli et al. (2014) have not found evidence of light element abundance spreads in LMC star clusters with ages less than 3 Gyr, based on ground based spectroscopic data. In order to confirm at which cluster ages multiple populations are present or absent, larger samples of data, including space-based, are needed. In future works, we will extend our study to star clusters with ages younger than 6 Gyr for which we have already data in hand.
Acknowledgements
We, in particular FN, NB, VKP and IP, gratefully acknowledge financial support for this project provided by NASA through grant HST-GO-14069 from the Space Telescope Science Institute, which is operated by the Association of Universities for Research in Astronomy, Inc., under NASA contract NAS526555. NB gratefully acknowledges financial support from the Royal Society (University Research Fellowship) and the European Research Council (ERC-CoG-646928, Multi-Pop). DG gratefully acknowledges support from the Chilean BASAL Centro de Excelencia en Astrofísica y Tecnologías Afines (CATA) grant PFB-06/2007. MJC gratefully acknowledges support from the Sonderforschungsbereich SFB 881 "The Milky Way System" (subproject A8) of the German Research Foundation (DFG). We are very grateful to Jay Anderson and Andrea Bellini for sharing with us their ePSF software. We thank the anonymous referee for useful comments and suggestions.
References
- Akaike (1974) Akaike H., 1974, IEEE Transactions on Automatic Control, 19, 716
- Anderson & King (2006) Anderson J., King I. R., 2006, Technical report, PSFs, Photometry, and Astronomy for the ACS/WFC. STScI, Baltimore, MD
- Ashman & Zepf (1992) Ashman K. M., Zepf S. E., 1992, ApJ, 384, 50
- Bastian & Lardo (2015) Bastian N., Lardo C., 2015, MNRAS, 453, 357
- Bellini et al. (2011) Bellini A., Anderson J., Bedin L. R., 2011, PASP, 123, 622
- Bragaglia et al. (2014) Bragaglia A., Sneden C., Carretta E., Gratton R. G., Lucatello S., Bernath P. F., Brooke J. S. A., Ram R. S., 2014, ApJ, 796, 68
- Cabrera-Ziri et al. (2016) Cabrera-Ziri I., Lardo C., Davies B., Bastian N., Beccari G., Larsen S. S., Hernandez S., 2016, MNRAS, 460, 1869
- Cannon et al. (1998) Cannon R. D., Croke B. F. W., Bell R. A., Hesser J. E., Stathakis R. A., 1998, MNRAS, 298, 601
- Carretta et al. (2009a) Carretta E., et al., 2009a, A&A, 505, 117
- Carretta et al. (2009b) Carretta E., Bragaglia A., Gratton R., Lucatello S., 2009b, A&A, 505, 139
- Carretta et al. (2010) Carretta E., et al., 2010, A&A, 520, A95
- Carretta et al. (2014) Carretta E., Bragaglia A., Gratton R. G., D’Orazi V., Lucatello S., Sollima A., 2014, A&A, 561, A87
- Dalessandro et al. (2016) Dalessandro E., Lapenna E., Mucciarelli A., Origlia L., Ferraro F. R., Lanzoni B., 2016, ApJ, 829, 77
- Davies et al. (2009) Davies B., Origlia L., Kudritzki R.-P., Figer D. F., Rich R. M., Najarro F., Negueruela I., Clark J. S., 2009, ApJ, 696, 2014
- Girardi et al. (2000) Girardi L., Bressan A., Bertelli G., Chiosi C., 2000, A&AS, 141, 371
- Girardi et al. (2008) Girardi L., et al., 2008, PASP, 120, 583
- Glatt et al. (2008a) Glatt K., et al., 2008a, AJ, 135, 1106
- Glatt et al. (2008b) Glatt K., et al., 2008b, AJ, 136, 1703
- Glatt et al. (2009) Glatt K., et al., 2009, AJ, 138, 1403
- Glatt et al. (2011) Glatt K., et al., 2011, AJ, 142, 36
- Gratton et al. (2012) Gratton R. G., Carretta E., Bragaglia A., 2012, A&ARv, 20, 50
- Hollyhead et al. (2017) Hollyhead K., et al., 2017, MNRAS, 465, L39
- Krause et al. (2016) Krause M. G. H., Charbonnel C., Bastian N., Diehl R., 2016, A&A, 587, A53
- Kruijssen (2015) Kruijssen J. M. D., 2015, MNRAS, 454, 1658
- Larsen et al. (2014) Larsen S. S., Brodie J. P., Grundahl F., Strader J., 2014, ApJ, 797, 15
- Larsen et al. (2015) Larsen S. S., Baumgardt H., Bastian N., Brodie J. P., Grundahl F., Strader J., 2015, ApJ, 804, 71
- Mackey & Gilmore (2003) Mackey A. D., Gilmore G. F., 2003, MNRAS, 338, 85
- McLaughlin & van der Marel (2005) McLaughlin D. E., van der Marel R. P., 2005, ApJS, 161, 304
- Milone et al. (2012) Milone A. P., et al., 2012, A&A, 540, A16
- Mucciarelli et al. (2008) Mucciarelli A., Carretta E., Origlia L., Ferraro F. R., 2008, AJ, 136, 375
- Mucciarelli et al. (2009) Mucciarelli A., Origlia L., Ferraro F. R., Pancino E., 2009, ApJ, 695, L134
- Mucciarelli et al. (2011) Mucciarelli A., et al., 2011, MNRAS, 413, 837
- Mucciarelli et al. (2014) Mucciarelli A., Dalessandro E., Ferraro F. R., Origlia L., Lanzoni B., 2014, ApJ, 793, L6
- Niederhofer et al. (2015) Niederhofer F., Hilker M., Bastian N., Silva-Villa E., 2015, A&A, 575, A62
- Niederhofer et al. (2017) Niederhofer F., et al., 2017, MNRAS, 464, 94
- Parisi et al. (2016) Parisi M. C., Geisler D., Carraro G., Clariá J. J., Villanova S., Gramajo L. V., Sarajedini A., Grocholski A. J., 2016, AJ, 152, 58
- Ryan et al. (2016) Ryan Jr. R. E., et al., 2016, Technical report, The Updated Calibration Pipeline for WFC3/UVIS: a Reference Guide to calwf3 (version 3.3). STScI, Baltimore, MD
- Schweizer (1987) Schweizer F., 1987, in Faber S. M., ed., Nearly Normal Galaxies. From the Planck Time to the Present. pp 18–25
- Sirianni et al. (2005) Sirianni M., et al., 2005, PASP, 117, 1049
- Villanova et al. (2013) Villanova S., Geisler D., Carraro G., Moni Bidin C., Muñoz C., 2013, ApJ, 778, 186
- Walker et al. (2011) Walker A. R., et al., 2011, MNRAS, 415, 643
- Weisz et al. (2013) Weisz D. R., Dolphin A. E., Skillman E. D., Holtzman J., Dalcanton J. J., Cole A. A., Neary K., 2013, MNRAS, 431, 364