ALMA Reveals Potential Localized Dust Enrichment from Massive Star Clusters in II Zw 40
Abstract
We present subarcsecond images of submillimeter CO and continuum emission from a local galaxy forming massive star clusters: the blue compact dwarf galaxy II Zw 40. At 0.4″ resolution (20 pc), the CO(3–2), CO(1–0), 3mm and 870m continuum maps illustrate star formation on the scales of individual molecular clouds. Dust contributes about a third of the 870m continuum emission, with free-free accounting for the rest. On these scales, there is not a good correspondence between gas, dust, and free-free emission. Dust continuum is enhanced toward the star-forming region as compared to the CO emission. We suggest that an unexpectedly low and spatially variable gas-to-dust ratio is the result of rapid and localized dust enrichment of clouds by the massive clusters of the starburst.
1. Introduction
Cycling of gas in galaxies drives galactic evolution; massive stars are important in this process because of their high luminosities, intense and hard radiation fields, and mass loss. In particular, concentrations of young, massive stars in clusters can rapidly create and expel large masses of metal-rich gas, which can potentially produce dust-enriched clouds (Turner et al., 2015). Dust-enriched gas can affect gas dynamics and interactions of young stars with their surroundings, determining the manner in which gas and dust are dispersed from massive clusters (Silich et al., 2004; Tenorio-Tagle et al., 2006; Krumholz & Matzner, 2009; Murray et al., 2010; Draine, 2011a; Kim et al., 2016). Differences between CO-derived and dust-derived masses in clouds of the LMC (Indebetouw et al., 2013; Galametz et al., 2016) suggest local variations in either the CO-to-H2 conversion factor or in the gas-to-dust ratios (GTDs).
Previous submillimeter observations of modest spatial resolution blend regions of different ages and enrichment, which might explain globally-uniform GTDs that are observed (Groves et al., 2015). The Atacama Large Millimeter/Submillimeter Array (ALMA) has made possible high resolution submillimeter maps which can resolve individual giant molecular clouds in local galaxies. It is now possible to test the assumption that gas and dust are well mixed on cluster scales.
II Zw 40 is a nearby (D=10 Mpc), low-metallicity (Z=0.25 Z⊙, Bordalo et al., 2009), blue compact dwarf galaxy. Although it hosts an exceedingly luminous “extragalactic HII region” (Sargent & Searle, 1970; Thuan & Martin, 1981; Kunth & Sargent, 1983), it has very faint CO lines (Sage et al., 1992; Meier et al., 2001; Israel, 2005). Its region of intense star formation (Beck et al., 2002; Wu et al., 2006; Vanzi et al., 2008; Beck et al., 2013; Kepley et al., 2014, 2016) contains at least two massive star clusters of – each (Beck et al., 2013). This “starburst” dominates the infrared spectrum of II Zw 40, which has an unusually warm peak at 60m (Vader et al., 1993). The dominance of the starburst makes II Zw 40 an excellent target for studying the effects of massive clusters on their environments.
We present here some of the first ALMA submillimeter 3mm and 870m continuum and CO observations of an extragalactic star-forming region with massive young star clusters. We have mapped CO(3-2), CO(1-0), and continuum in II Zw 40. From these images we can study how well correlated CO and submillimeter dust continuum emission are on the scales of star-forming regions.
2. Observations
II Zw 40 (UGCA116) was observed in ALMA Bands 3 and 7 as a Cycle 2 (Early Science) program (ID = 2013.1.00122.S, PI = J. Turner). Band 7 observations took place on 2014 13 August and 13 December. A single field with an 18″ field-of-view centered on 05:55:42.620, +03.23.32.0 was observed with 2844 seconds on source. The uv range covers 17-983 k; structures 12″ are undersampled. This is not a problem for CO(3-2), since emission in individual channels is compact, nor for free-free emission. However, it could be an issue for dust, which traces both atomic and molecular gas. Band 3 observations took place on 2015 September 2 and 3, with 4927 seconds on source. Spectral resolution 244.141 kHz per channel resolves both CO(3–2) and CO(1–0) lines; we present the integrated intensity maps for emission 1.5. The uv range for the 2.6mm images covers 5-525k, sampling structures up to 40″(1.9 kpc). Bandpass, phase, and flux were calibrated with J0607-0834, J0532+0732, and J0510+180 respectively. Data calibration using CASA followed the pipeline. Continuum emission was subtracted in the (u,v) plane before making line maps. All maps are convolved to a 0.47″ x 0.4″, PA=51.02∘ beam.
For the continuum maps, RMS noise is Jy beam-1 for the 2 GHz band centered at 345.796 GHz (“870m”), and 20 Jy beam-1 at 115.27 GHz (“3 mm”). The RMS in a single 2 km s-1 Hanning-weighted channel is 1.5 mJy beam-1 for CO(1-0) maps and 1.6 mJy beam-1 for CO(3-2). The RMS in the integrated intensity maps is 19 mJy beam-1 km s-1 in CO(1–0) with a 1.5 cutoff, and 14 mJy beam-1 km s-1 for CO(3–2) with a 2.5 cutoff. Single dish fluxes from the literature are 1.4-4.6 Jy km s-1 for CO(1-0) in a 22-24″ beam (Sage et al., 1992; Albrecht et al., 2004) and 6.7 Jy km s-1 for CO(3-2) (Meier et al., 2001; Israel, 2005). We may detect up to half of the CO(1-0) single dish flux, but this is unclear from the conflicting published values. We detect most, perhaps all of the CO(3–2) single dish flux, based on comparison with single dish upper limits.
3. 3mm free-free continuum, HII regions and star formation rate in II Zw 40
Free-free emission from the HII region dominates the 3mm continuum of II Zw 40, shown in Figure 1b; synchrotron and dust contributions are negligible. The 3mm flux density for the inner 2-3″ is 0.2 mJy, with a peak of 1.67 mJy beam-1 at RA: 05:55:42.614 Dec: 03.23.32.01 (J2000). Using opacity and recombination coefficient expressions from Draine (2011a,b) we find, and for Te= 13000 K (Walsh & Roy, 1993; Thuan & Izotov, 2005), we obtain a Lyman continuum rate of . This is higher than estimated from cm-wave fluxes (Kepley et al., 2014), which can be caused by particularly dense ionized gas turning optically thin at millimeter wavelengths (Beck et al., 2002). Since dust competes with gas for UV photons the actual Lyman continuum rate will be higher than this value. Following Inoue et al. (2001), based on the observed (Engelbracht et al., 2008, corrected for distance) and we estimate that 72% of the Lyman continuum photons end up ionizing hydrogen. The corrected Lyman continuum rate is therefore, corresponding to 12000 O stars, and total stellar mass M⊙.
4. Dust and Molecular Gas in II Zw 40
4.1. 870m continuum and dust distribution in II Zw 40
The 870m continuum image is shown in Figure 1a; total flux for the inner 6″ is mJy and the peak is 1.740.06 mJy beam-1. Hirashita (2013) found mJy, at 880m in a map with the Submillimeter Array. His peak flux of 8.5 mJy beam-1 in a 7″ beam is consistent with our total flux measurement for a region of the same size. This is 10% of the flux in the single dish JCMT-SCUBA maps, much of which arises in the extended HI tail (Galliano et al., 2005; Hunt et al., 2005; van Zee, Skillman & Salzer, 1998). The 870m continuum includes both dust and free-free emission. To map only the dust, we extrapolate the 3mm free-free emission to 870m using the spectral index -0.118 (Draine, 2011b). The total free-free flux density of mJy is two-thirds of the total. The remaining flux density is due to dust; we obtain mJy. This value agrees with that of Kepley et al. (2016). The contribution of dust to the 3mm continuum, for dust emissivity , is mJy.
Subtracting the scaled 3mm free-free continuum from the 870m gives a map of the dust emission alone, shown in Figure 1c.
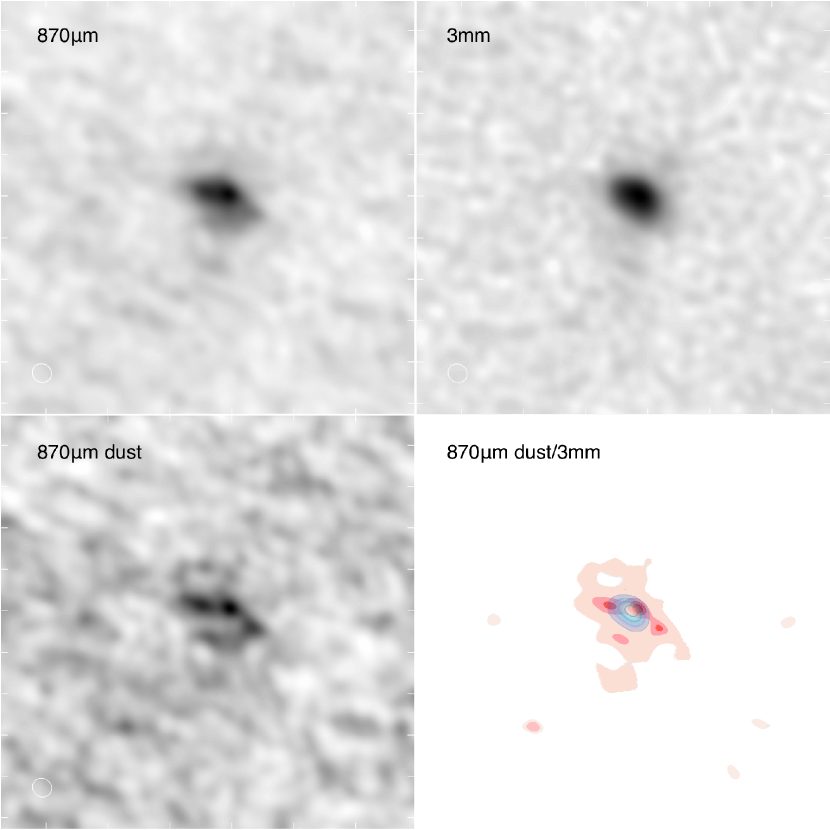
Dust is concentrated near the star formation in a region 2″, or 100 pc in extent. Dust and ionized gas are not perfectly co-extensive: the peak flux in the 870m continuum is at 05:55:42.612, 03:23:32.02 (J2000), slightly (0.14″, or 7 pc) shifted from the 3mm peak. Dust peaks include: a central peak, 0.38 mJy beam-1 (42s.604, 32″.06), western peak, 0.28 mJy beam-1 (42s.564, 31″.55), eastern peak, 0.32 mJy beam-1 (42s.649, 32″.11), and southern peak, 0.24 mJy beam-1 (42s.632, 31″.33). Dust fluxes in Table 1 differ from these because those are measured at CO(3-2) peaks.
4.2. Molecular Gas Distribution and Conditions
Integrated line images of CO(3-2) and CO(1-0) are shown in Figure 2.
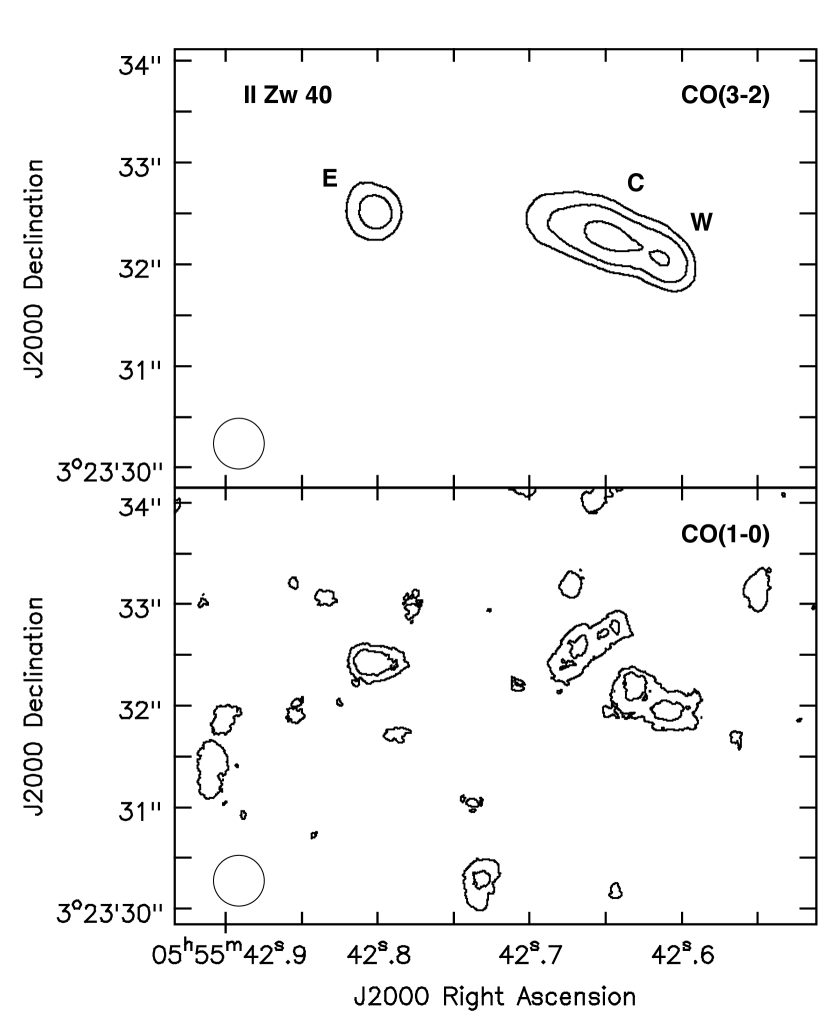
CO(3-2) traces dense (104 cm-3) gas, so the clouds in these images are dense clouds associated with the star formation. We restrict our discussion to the CO(3–2) and CO(1–0) in the dense, compact CO(3-2)-emitting clouds in this paper; there may be more extended and diffuse clouds traced by CO(1-0) that may not be well-represented in these images, while we recover most of the CO(3-2) flux ( 2). CO(3-2) has been mapped previously by Kepley et al. (2016), but they did not detect CO(1-0) with 3 times higher rms.
The overall integrated flux ratio of CO(3–2) and CO(1–0), , where (Jy km s-1), is on average , and ranges from 3–13 for CO(1–0) integrated intensity 1.5. The line ratio in thermal, optically thick gas is 7.4 for K. The observed is consistent with thermalized, warm gas. We have chosen the contours for the CO(3-2) in Figure 2 to be 7.4 times those of CO(1-0) to demonstrate the similarities in the maps at this value of . The central extended cloud has significantly elevated , as does the western cloud near the 3mm continuum peak (10), indicative of warmer gas directly associated with star formation. The observed II Zw 40 cloud values are much higher than the galactic =1.6 found in the JCMT survey of local SINGS galaxies (Wilson et al., 2012). Since we identify clouds based on CO(3-2) structure, it is not surprising that these clouds have higher than average values. These CO(3-2)-emitting clouds are denser and warmer in II Zw 40 than typical spiral disk clouds, with 3.5-4.
4.3. Gas-to-Dust in II Zw 40
Figure 3 shows the gas and dust together.
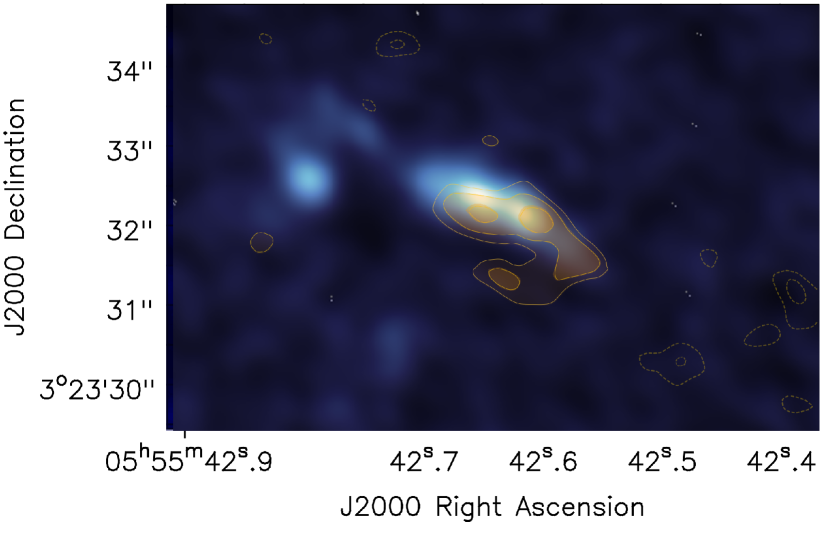
The CO-to-dust emission ratio varies significantly across the starburst region. The isolated CO cloud to the east is molecular gas rich, with almost no dust emission. In contrast, the westernmost dust peak is relatively dust-rich, with weak CO. The ratio of CO(3-2) line flux to dust continuum flux varies from km s-1 to km s-1, almost an order of magnitude.
We calculate GTD by determining dust and gas masses separately. We focus on three regions 0.6″ in diameter: “Cloud W”, coincident with the 3mm free-free peak, “Cloud C”, to the immediate east of the free-free peak, and “Cloud E”, an isolated cloud to the east (Figure 2). Clouds E and W are similar in CO flux, but very different in dust emission. To obtain dust mass, we use a dust opacity calculated for an extended region in the LMC by Galliano et al. (2011), with and . For Clouds C and W, we use the 33K IRAS 60/100 color temperature (Engelbracht et al., 2008) and for the isolated Cloud E, we use TDust=20K. We obtain a total dust mass for the central 5″ of 170005000 M⊙(for T=33K). This may underestimate the true dust mass, since the SED peak is dominated by the warmest dust, which will not dominate the mass.
Gas masses are derived from CO(1-0) using the conversion factor, . Since the CO(1-0) detection is weak, we also include masses based on the CO(3-2) fluxes for comparison, using =7.4 to obtain the equivalent CO(1-0) flux. Because of excitation effects in CO(3-2), the CO(1-0) masses, while uncertain, are more reliable for using . We adopt the LMC conversion factor of (Israel et al., 2003; Hughes et al., 2010). This value was obtained for more diffuse gas which is more likely to have CO-dark H2; it could well overestimate the molecular gas in these dense clouds. Gas and dust masses and GTD calculated for the three Clouds E, C, and W, associated with CO(3-2) peaks, and for the entire central 5″ starburst region are given in Table 1. The overall gas mass based on CO(1-0) is M⊙, including helium.
GTD is expected to scale with galactic metallicity, although with large scatter (Rémy-Ruyer et al., 2014). The metallicity of II Zw 40 is 12+log(O/H)8.1, 0.25 Z⊙ (Bordalo et al., 2009), so the predicted GTD is 400-600. Only Cloud E approaches this value. The observed values of GTD60-170 are far lower than expected for this low metallicity galaxy.
| Name | Position | CO(1-0) | CO(3-2) | Dust Fluxb | GTDc | ||||
|---|---|---|---|---|---|---|---|---|---|
| 05:55; +03:23 | (Jy km s-1) | (Jy km s-1) | ratio | () | () | (mJy) | () | (1-0), (3-2) | |
| Cloud Wd | 42.609, 32.03 | 0.06 | 0.71 | 12 | 13 | 21 | 0.34 | 1940 | 69, 110 |
| Cloud Ed | 42.802, 32.482 | 0.055 | 0.52 | 9 | 12 | 16 | 0.04 | 450 | 270, 350 |
| Cloud Cd | 42.647, 32.264 | 0.045 | 0.93 | 21 | 10 | 28 | 0.29 | 1650 | 60, 170 |
| Starburste | 42.695, 31.763 | 0.50 | 4.1 | 8 | 110 | 120 | 3.0 | 65, 72 |
5. Low and Spatially Varying Gas-to-Dust: Gas Conditions or Starburst Dust Production?
Derived GTD values in II Zw 40 are consistently lower than predicted from its metallicity. GTD also varies significantly across the region; from 70 in Cloud W to 270 in Cloud E, clouds similar in CO flux and size. There are several possible explanations for the variation. The missing gas mass is unlikely to be HI in these dense clouds. It is difficult to compare to the large beams of HI maps, but based on observed column densities (van Zee, Skillman & Salzer, 1998), we estimate that roughly 10% of the mass could be in HI in these compact clouds. Columns higher than this will become molecular gas. CO-dark H2 is unlikely to contribute significantly in dense clouds (Langer et al., 2014); the adopted conversion factor has already accounted for this to some extent. variations could explain the variable GTD (as suggested for the LMC, Galametz et al., 2016). For the entire region to have the same GTD as Cloud E would require - in dense clouds where CO-dark H2 is not expected, and it requires that vary by a factors of 4-10 across a region of 200 pc extent. High values of have been inferred in other low metallicity galaxies, but under the assumption of a uniform GTD (Shi et al., 2014, 2015), which we argue below is questionable. We also note the apparent contradiction in any model relying on CO-dark H2: to explain these results requires extinction be lowest in clouds where dust emission is strongest.
We favor instead for II Zw 40 a model in which the GTD is low and variable because the starburst has enriched the surrounding clouds in metals and dust. Massive clusters such as those in II Zw 40 contain the most massive O stars (Smith et al., 2016) that lose most of their mass within a few Myr (Ekström et al., 2012). Both the Geneva high mass loss stellar models and the rotating models used in Starburst99 (Leitherer et al., 1999, 2014) predict metal (CNOSiMg) yields of up to 60,000 M⊙ for clusters of this luminosity () that are 3 Myr or older. If half of this metal yield were in the form of dust, as in the Galaxy (Jenkins, 2009) then 30,000 M⊙ of dust could be present. We infer a total dust mass that is half this amount. In this scenario, the dominant source of dust is production in the stars of the massive clusters, and the contribution of dust from the natal clouds is small. This explains the contrast in GTD between Cloud W, which has been enriched by the massive clusters, and Cloud E, which has little star formation. This theory is also consistent with the significant spatial variations seen in the inferred oxygen abundances within this region by Bordalo et al. (2009). Enrichment is a natural and expected result of the stellar evolution of large clusters containing O stars.
Localized dust enrichment also provides an explanation for the spatial distribution of the dust (Draine, 2011a). In luminous clusters, radiation pressure can cause the dust to drift relative to the gas, by 1 km s-1. This could explain the slight offset of the main dust peak (10 pc) from the radio continuum peak and presence of dust mostly outside the HII region. Regions of dust emission without gas or continuum, such as the westernmost dust peak, may signal the presence of older clusters which no longer have HII regions. At a sound speed of 10 km s-1, 100 Myr is required to cover the observed dust-emitting region; the presence of radio continuum emission suggests that these clusters are much younger. The starburst in II Zw 40 is young enough that the cluster-enriched gas has not had time to fully disperse.
These observations of II Zw 40 suggest that dust enrichment from massive clusters can be rapid and localized in starburst galaxies. This could explain why very high values of are inferred when Galactic GTD are assumed (e.g., Shi et al., 2014, 2015). Localized enrichment by massive star clusters may also explain why dusty galaxies, or dusty regions within galaxies, are seen so early in the universe (Watson et al., 2015).
6. Summary and Conclusions
We present ALMA continuum maps at 3mm and 870m and integrated intensity images of the CO(3–2) and CO(1–0) lines in the blue compact dwarf galaxy II Zw 40, at a resolution of 0.4″ (20 pc). Based on a 3mm continuum flux of 7.60.2 mJy, we obtain a Lyman continuum rate of with 72% of the uv photons ionizing the gas. From 3mm and 870m continuum maps, we construct a dust-only continuum map. For a dust flux of mJy, we estimate a dust mass of M⊙, for Tdust=33 K. While CO(1-0) emission is weak, CO(3-2) and CO(1-0) line emission maps show similar structure and are consistent with warm, thermalized gas: CO(3-2) integrated fluxes are 3-13 times stronger than the CO(1-0). Adopting an LMC km s-1, we estimate a gas mass of M⊙, including helium, comparable to the masses of the star clusters. The CO(3-2) extends over 4″ ( 200 pc), significantly larger than the free-free emission, while the dust is concentrated to the immediate 2″ (100 pc) vicinity of the starburst.
The ratio of CO(3-2) line flux to dust continuum flux varies from km s-1 to km s-1 across the source. Some of this variation is due to CO(3-2) excitation, but much of it is due to gas column variations. For values of and dust opacity from the LMC, we find the gas-to-dust ratio, based on CO(1-0) fluxes, is unexpectedly low and variable across the 200 pc region: GTD60-70 in the 0.6″ regions (50 pc) adjacent to the starburst, but GTD270 in a similar, but isolated and quiescent cloud 200 pc to the east. We argue that a low and variable GTD ratio in II Zw 40 is a result of dust produced by the O stars within the massive star clusters, an example of localized dust enrichment by a starburst that has not yet had time to disperse.
References
- Albrecht et al. (2004) Albrecht, M., Chini, R., Krügel, E., Müller, S. A. H., & Lemke, R. 2004, A&A, 414, 141
- Beck et al. (2013) Beck, S., Turner, J., Lacy, J., Greathouse, T., & Lahad, O. 2013, ApJ, 767, 53
- Beck et al. (2002) Beck, S., Turner, J., Langland-Shula, L., Meier, D., Crosthwaite, L., & Gorjian, V. 2002, AJ, 124, 2516
- Bordalo et al. (2009) Bordalo, V., Plana, H., & Telles, E. 2009, ApJ, 696, 1668
- Draine (2011a) Draine, B. T. 2011, ApJ, 732, 100
- Draine (2011b) Draine, B. T. 2011, Physics of the Interstellar and Intergalactic Medium by Bruce T. Draine. Princeton University Press, 2011. ISBN: 978-0-691-12214-4, 95
- Engelbracht et al. (2008) Engelbracht, C. W., Rieke, G. H., Gordon, K. D., et al. 2008, ApJ, 678, 804-827
- Ekström et al. (2012) Ekström, S., Georgy, C., Eggenberger, P., et al. 2012, A&A, 537, A146
- Galametz et al. (2016) Galametz, M., Hony, S., Albrecht, M., et al. 2016, MNRAS, 456, 1767
- Galliano et al. (2011) Galliano, F., Hony, S., Bernard, J.-P., et al. 2011, A&A, 536, A88
- Galliano et al. (2005) Galliano, F., Madden, S. C., Jones, A. P., Wilson, C. D., & Bernard, J.-P. 2005, A&A, 434, 867
- Groves et al. (2015) Groves, B. A., Schinnerer, E., Leroy, A., et al. 2015, ApJ, 799, 96
- Hirashita (2013) Hirashita, H. 2013, MNRAS, 429, 3390
- Hughes et al. (2010) Hughes, A., Wong, T., Ott, J., et al. 2010, MNRAS, 406, 2065
- Hunt et al. (2005) Hunt, L., Bianchi, S., & Maiolino, R. 2005, A&A, 434, 849
- Indebetouw et al. (2013) Indebetouw, R., Brogan, C., Chen, C.-H.R. et al. 2013, ApJ, 774, 73
- Inoue et al. (2001) Inoue, A. K., Hirashita, H., & Kamaya, H. 2001, ApJ, 555, 613
- Israel (2005) Israel, F. P. 2005, A&A, 438, 855
- Israel et al. (2003) Israel, F. P., de Graauw, T., Johansson, L. E. B., et al. 2003, A&A, 401, 99
- Jenkins (2009) Jenkins, E. B. 2009, ApJ, 700, 1299
- Kepley et al. (2014) Kepley, A. A., Reines, A. E., Johnson, K. E., & Walker, L. M. 2014, AJ, 147, 43
- Kepley et al. (2016) Kepley, A. A., Leroy, A. K., Johnson, K. E., Sandstrom, K., & Chen, C.-H. R. 2016, arXiv:1607.01779
- Kim et al. (2016) Kim, J.-G., Kim, W.-T., & Ostriker, E. C. 2016, ApJ, 819, 137
- Krumholz & Matzner (2009) Krumholz, M. R., & Matzner, C. D. 2009, ApJ, 703, 1352
- Kunth & Sargent (1983) Kunth, D. & Sargent, W.L.W. 1983, ApJ, 273, 81
- Langer et al. (2014) Langer, W. D., Velusamy, T., Pineda, J. L., Willacy, K., & Goldsmith, P. F. 2014, A&A, 561, A122
- Leitherer et al. (2014) Leitherer, C., Ekström, S., Meynet, G., et al. 2014, ApJS, 212, 14
- Leitherer et al. (1999) Leitherer, C., Schaerer, D., Goldader, J. D., et al. 1999, ApJS, 123, 3
- Meier et al. (2001) Meier, D. S., Turner, J. L., Crosthwaite, L. P., & Beck, S. C. 2001, AJ, 121, 740
- Murray et al. (2010) Murray, N., Quataert, E., & Thompson, T. A. 2010, ApJ, 709, 191
- Rémy-Ruyer et al. (2014) Rémy-Ruyer, A., Madden, S. C., Galliano, F., et al. 2014, A&A, 563, A31
- Sage et al. (1992) Sage, L. J., Salzer, J. J., Loose, H.-H., & Henkel, C. 1992, A&A, 265, 19
- Sargent & Searle (1970) Sargent, W.L.W. & Searle, L. 1970, ApJ, 162, 155
- Shi et al. (2014) Shi, Y., Armus, L., Helou, G., et al. 2014, Nature, 514, 335
- Shi et al. (2015) Shi, Y., Wang, J., Zhang, Z.-Y., et al. 2015, ApJ, 804, L11
- Silich et al. (2004) Silich, S., Tenorio-Tagle, G., & Rodríguez-González, A. 2004, ApJ, 610, 226
- Smith et al. (2016) Smith, L. J., Crowther, P. A., Calzetti, D., & Sidoli, F. 2016, ApJ, 823, 38
- Tenorio-Tagle et al. (2006) Tenorio-Tagle, G., Muñoz-Tuñón, C., Pérez, E., Silich, S., & Telles, E. 2006, ApJ, 643, 186
- Thuan & Izotov (2005) Thuan, T. X., & Izotov, Y. I. 2005, ApJS, 161, 240
- Thuan & Martin (1981) Thuan, T.X. & Martin, G.E. 1981, ApJ, 247, 823
- Turner et al. (2015) Turner, J.L., Beck, S.C., Benford, D.J., et al. 2015, Nature, 519, 331
- Vader et al. (1993) Vader, J. P., Frogel, J. A., Terndrup, D. M., & Heisler, C. A. 1993, AJ, 106, 1743
- van Zee, Skillman & Salzer (1998) van Zee, L., Skillman, E., & Salzer, J. 1998, AJ, 116, 1186
- Vanzi et al. (2008) Vanzi, L., Cresci, G., Telles, E., & Melnick, J. 2008, A&A, 486, 393
- Walsh & Roy (1993) Walsh, J.R., & Roy, J.R. 1993, MNRAS, 262, 27
- Watson et al. (2015) Watson, D., Christensen, L., Knudsen, K. K., et al. 2015, Nature, 519, 327
- Wilson et al. (2012) Wilson, C. D., Warren, B. E., Israel, F. P., et al. 2012, MNRAS, 424, 3050
- Wu et al. (2006) Wu, Y., Charmandaris, V., Hao, L., et al. 2006, ApJ, 639, 157