SOL width and intermittent fluctuations in KSTAR
Abstract
Radial profiles of the ion saturation current and its fluctuation statistics are presented from probe measurements in L-mode, neutral beam heated plasmas at the outboard mid-plane region of KSTAR. The familiar two-layer structure, seen elsewhere in tokamak L-mode discharges, with a steep near-SOL profile and a broad far-SOL profile, is observed. The profile scale length in the far-SOL increases drastically with line-averaged density, thereby enhancing plasma interactions with the main chamber walls. Time series from the far-SOL region are characterised by large-amplitude bursts attributed to the radial motion of blob-like plasma filaments. Analysis of a data time series of several seconds duration under stationary plasma conditions reveals the statistical properties of these fluctuations, including the rate of level crossings and the average duration of periods spent above a given threshold level. This is shown to be in excellent agreement with predictions of a stochastic model, giving novel predictions of plasma–wall interactions due to transient transport events.
I Introduction
The boundary region of magnetically confined plasmas is generally in an inherently fluctuating state. Single point measurements of the plasma density reveal frequent occurrence of large-amplitude bursts and relative fluctuation levels of order unity dmz ; garcia-pfr . These fluctuations, seen in the scrape-off layer (SOL) of all tokamaks, are attributed to radial motion of blob-like filamentary structures through the SOL, leading to broad profiles and enhanced levels of plasma interactions with the main chamber walls that may be an issue for next generation magnetic confinement experiments pitts1 ; pitts2 ; whyte ; lipschultz-nf ; labombard2 ; labombard1 ; asakura ; lipschultz-ppcf .
Measurements from a number of tokamak experiments have demonstrated that as the line-averaged plasma density increases, the radial particle density profile in the SOL becomes broader and plasma–wall interactions increase asakura ; lipschultz-ppcf ; whyte ; labombard1 ; labombard2 ; rudakov-nf ; garcia-tcv-jnm ; garcia-tcv-nf ; garcia-tcv-ppcf2 ; labombard3 ; carralero-nf ; carralero-jnm ; militello-nf ; carralero-prl . The particle density profile typically exhibits a two-layer structure. Close to the separatrix, in the so-called near-SOL, it has a steep exponential decay and moderate fluctuation levels. Beyond this region, in the so-called far-SOL, the profile has an exponential decay with a much longer scale length and a fluctuation level of order unity asakura ; lipschultz-ppcf ; labombard1 ; labombard2 ; rudakov-nf ; garcia-tcv-jnm ; garcia-tcv-nf . As the discharge density limit is approached, the profile in the far-SOL becomes broader and the break point moves radially inwards such that the far-SOL profile effectively extends all the way to the magnetic separatrix or even inside it rudakov-nf ; garcia-tcv-jnm ; garcia-tcv-nf ; garcia-tcv-ppcf2 ; labombard3 .
The first part of this contribution augments the tokamak SOL profile database by presenting in Sec. III a summary of the first SOL profile measurements on the Korean Superconducting Tokamak Advanced Research (KSTAR), obtained at the outboard mid-plane of lower single null diverted, L-mode discharges bak1 ; bak2 . The results presented here are consistent with measurements on many other devices, in particular the increase of profile scale length with increasing line-averaged density. Moreover, the relative fluctuation level and the skewness and flatness moments are shown to vary weakly with radial position and line-averaged density in the far-SOL, suggesting the same kind of robustness of fluctuations found for many other devices labombard1 ; labombard2 ; rudakov-nf ; garcia-tcv-jnm ; garcia-tcv-nf ; garcia-tcv-ppcf2 ; labombard3 .
A novel stochastic model has been proposed in order to describe intermittent fluctuations in the SOL, based on a super-position of uncorrelated pulses with an exponential pulse shape of constant duration and exponentially distributed pulse amplitudes garcia-acm-jnm ; garcia-acm-php ; kube-acm-ppcf ; garcia-tcv-nfl ; theodorsen-tcv-ppcf ; garcia-prl ; kube-mse ; garcia-php ; theodorsen-php ; theodorsen-pre . Under some simplifying assumptions, this model predicts an exponential radial profile and thus elucidates the physical mechanisms underlying broad radial profiles and large fluctuation levels in the SOL garcia-php . The stochastic model and its predictions are presented in Sec. IV.
To contribute further to the understanding of the statistical properties of plasma fluctuations in the SOL and to contribute to the cross-machine scaling of this turbulence, a dedicated experiment was performed on KSTAR with a reciprocating Langmuir dwelled at a fixed position in the far-SOL during an entire discharge. This yielded high frequency turbulence measurements over a period of 5.5 seconds, several factors longer than previously obtained on other tokamaks. The resulting ion saturation current time series of unprecedented duration is analysed and compared with a similar investigation of a realisation of the stochastic model with additional noise in Sec. V. Excellent agreement is found between the two time series, including large-amplitude burst events and an analysis of level crossings and the average duration of time intervals spent above a given threshold level garcia-php ; theodorsen-php ; theodorsen-pre ; sato ; fattorini .
A discussion of the results, the conclusions and an outlook are given in Sec. VI. The KSTAR measurements presented here give further evidence for universality of fluctuations in the boundary region of magnetically confined plasmas. These are here shown to be described by a novel stochastic model. This includes the rate of level crossing and excess times, which are crucial for threshold phenomena like plasma–wall interactions. The stochastic model thus has the potential to provide all relevant distributions as far as the pulse duration and the lowest order moments can be reliably predicted for fusion plasmas.
II Experimental setup
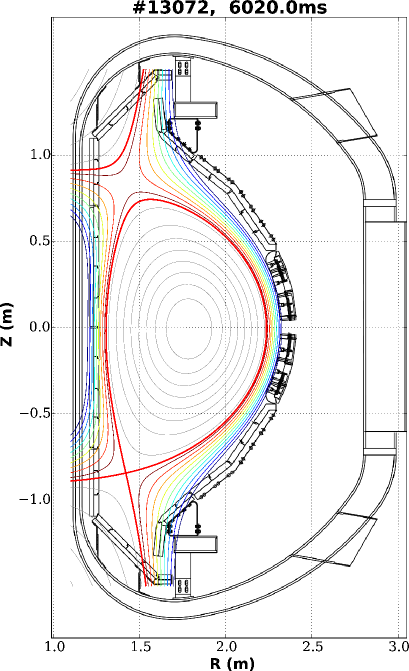
Results are presented from reciprocating Langmuir probe measurements in lower single null, deuterium fuelled L-mode plasmas in KSTAR bak1 ; bak2 . This superconducting, full carbon wall tokamak has a minor radius of m and a major radius of m. The experimental measurements were made with a plasma current of MA, axial toroidal magnetic field of T, neutral beam heating power of MW and electron cyclotron resonance heating of MW. For these parameters, the disruptive density limit is at , corresponding to complete divertor detachment, where is the line-averaged density and is the Greenwald density greenwald . A poloidal cross-section of KSTAR is presented in Fig. 1, which also shows magnetic flux surfaces based on an equilibrium reconstruction for one of the discharges analysed in the following.
A fast reciprocating Langmuir probe assembly moves through the SOL region at the outboard mid-plane, measuring the ion saturation current with a sampling rate of MHz. Only probe data from stationary phases of the plasma discharges are analysed, which typically have a duration of s. Measurements influenced by probe arcing have been carefully eliminated from the probe data analysed here. A scan in line-averaged density up to the disruptive limit has been performed. Table 1 gives the KSTAR shot number, the Greenwald fraction of the line-averaged density and the plot marker and color used for the following presentation of the results. Further information about the probe system can be found in Refs. bak1, ; bak2, .
| Shot number | Plot marker | |
|---|---|---|
| 13094 | 0.55 | |
| 13097 | 0.44 | |
| 13095 | 0.34 | |
| 13092 | 0.25 |
|
| 13084 | 0.22 |
For each shot, the probe head moves through the outboard mid-plane SOL plasma up to a distance of from the magnetic separatrix. Typically, two reciprocations are made per discharge, separated by several seconds. In the resulting time series of the ion saturation current, hysteresis is observed between the ingoing and outgoing profiles. This is likely due to perturbation of the plasma by the probe assembly. For this reason, only data for the inward probe motion and from one reciprocation for each plasma discharge is used for the following analysis. A parabolic function is fitted for the probe position versus time. Based on this, the data time series is divided into sub-records corresponding to radial movement of the probe, giving of the order of or more data elements per bin. This has been found as the best compromise between spatial resolution and convergence of estimators for the lowest order statistical moments. From the resulting sub-records of typically ms duration, the sample mean, standard deviation, skewness and flatness moments are readily calculated. The results from the density scan experiments are presented in Sec. III.
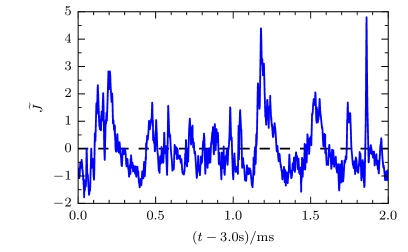
In order to further investigate the statistical properties of large-amplitude fluctuations in the ion saturation current, a special experiment was performed with the probe maintained at a fixed position in the SOL throughout the entire discarge. The line-averaged density for this shot was , while all other parameters were the same as for the density scan described above (see Fig. 1 for the magnetic equilibrium). The probe was placed from the separatrix and in front of the limiter structures. The resulting time series of the ion saturation current under stationary plasma conditions has an unprecedented duration of s. A short part of this time series is presented in Fig. 2. Here and in the following, the rescaled ion saturation current signal is defined by , where and are the sample mean and root mean square values, respectively. The raw data presented in Fig. 2 show the frequent occurence of large-amplitude bursts, which are typically observed in the boundary region of magnetically confined plasmas. In Sec. V the statistical properties of these fluctuations are investigated in detail.
III SOL profiles
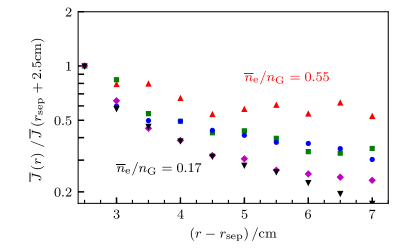
The radial profiles of the ion saturation current are presented in Fig. 3 for the various line-averaged densities. A double-exponential function has been fitted to each profile, giving an estimate of the profile scale length in the near- and far-SOL regions and their variation with the line-averaged density. Each profile in Fig. 3 is normalized to the value of the profile at a distance of from the estimated magnetic separatrix location. The familiar profile broadening with increasing line-averaged density is clearly observed. In the far-SOL, the scale length more than doubles from at to at . At the highest line-averaged density, the ion saturation current profile is broad and well described by a single exponential function over the entire SOL measurement region, similar to what has been observed in many other experiments whyte ; lipschultz-ppcf ; asakura ; labombard1 ; labombard2 ; garcia-tcv-jnm ; garcia-tcv-nf ; garcia-tcv-ppcf2 ; labombard3 ; rudakov-nf ; carralero-nf ; militello-nf ; carralero-jnm ; carralero-prl .
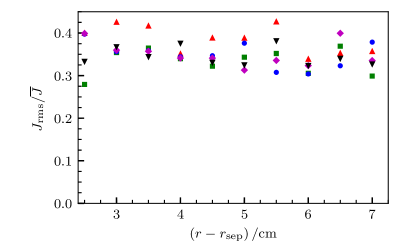
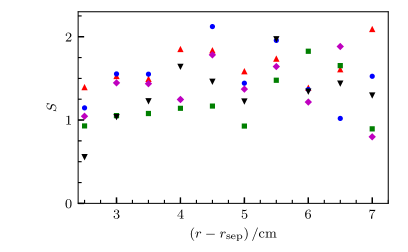
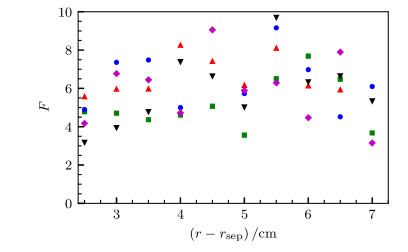
The radial profiles of the relative fluctuation level for the various line-averaged densities are presented in Fig. 4. Here it is clearly seen that the fluctuation level lies at approximately 35% throughout the SOL measurement region for all line-averaged densities investigated. The sample skewness moments presented in Fig. 5 are larger than unity over most of the SOL. Similarly, the sample flatness moments in Fig. 6 are significantly larger than three for most line-averaged densities and radial positions, which is the flatness value for a normally distributed random variable kube-mse ; garcia-prl ; garcia-php ; theodorsen-php . Due to the short duration of the time series, there is significant scatter of the data points for the higher order moments kube-mse ; garcia-php .
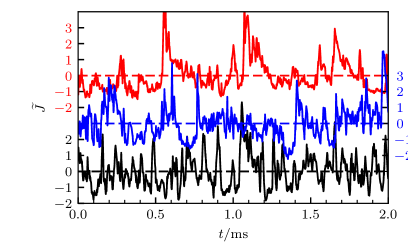
It should, however, be noted that for the measurement point closest to the separatrix, the skewness and flatness moments are slightly larger for the highest line-averaged density, which has a broad profile across the entire SOL measurement region. This is consistent with the raw ion saturation current time series shown in Fig. 7 for the lowest, intermediate and highest line-averaged densities. Here it is clearly seen that the signal is more intermittent and dominated by large-amplitude bursts for the highest line-averaged density.
These results demonstrate that the plasma in the SOL of KSTAR is in an inherently fluctuating state with positively skewed and flattened fluctuation amplitudes. Based on similar results from other devices, these fluctuations are attributed to the radial motion of blob-like plasma filaments. The mean profile becomes broader with increasing line-averaged density, thereby enhancing plasma interactions with the main chamber walls. The plasma–surface interactions depend on the rate of level crossings and the duration of intervals where the signal exceeds some threshold level. Before discussing these properties of the fluctuations, a stochastic model will first be described in the following section.
IV Stochastic modelling
Previous measurements in tokamak SOL plasma have shown that large-amplitude plasma fluctuations have on average an exponential wave-form with constant duration, exponentially distributed amplitudes, and appear in accordance with a Poisson process garcia-acm-jnm ; garcia-acm-php ; garcia-tcv-nfl ; theodorsen-tcv-ppcf ; kube-acm-ppcf . This provides evidence for a stochastic model of the fluctuations as a super-position of uncorrelated pulses garcia-prl ; garcia-php ; theodorsen-php ; kube-mse ; theodorsen-pre ,
| (1) |
where is the pulse shape, is the amplitude and the arrival time for the pulse labeled . It is assumed that the number of pulses occurring during a time interval of duration is Poisson distributed and that the pulse arrival times are uniformly distributed on the interval . From this it follows that the waiting times are exponentially distributed with the average waiting time given by garcia-prl ; garcia-php ; theodorsen-php . In the following, an exponential pulse shape will be considered,
| (2) |
where is the unit step function and the pulse duration is taken to be the same for all pulses. For this stochastic process, the intermittency parameter determines the degree of pulse overlap and it can be shown that the probability density function (PDF) approaches a normal distribution in the limit of large , independent of the amplitude distribution and pulse shape garcia-prl ; garcia-php .
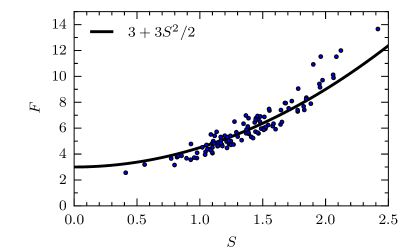
For the particular case of an exponential pulse shape and exponentially distributed pulse amplitudes, the stationary PDF for the random variable is a Gamma distribution with the shape parameter given by garcia-prl ; garcia-php . The mean value and variance of the signal are given by and , respectively, where is mean pulse amplitude, and there is a parabolic relationship between the skewness and flatness moments given by . A scatter plot of the sample flatness versus skewness moments for the KSTAR density scan experiments discussed in the previous section is presented in Fig. 8. The parabolic relation is clearly a good description of these measurement data.
For exponential pulse shapes with duration , the auto-correlation function for the random variable is readily calculated as . This allows the pulse duration time to be estimated for a synthetic data time series or experimental measurements. Furthermore, the stochastic model described above allows the rate of threshold crossings , the average duration of time intervals where the process exceeds some prescribed threshold level, and how these change with the intermittency parameter , to be computed analytically garcia-php ; theodorsen-php .
Measurements of fluctuations in the SOL of tokamak plasmas have demonstrated that there is additional noise on top of the large-amplitude bursts that is not captured by the process given by Eq. (1) garcia-acm-php ; kube-acm-ppcf . The effect of this additional noise can be described through a stochastic differential equation on the form theodorsen-pre
| (3) |
where is a standard white noise process. The solution of this equation can be written as , where the Ornstein–Uhlenbeck process is normally distributed with vanishing mean and unit standard deviation. The process described by Eq. (3) has the same exponential decay response for the stochastic noise forcing as for the Poisson point process described by Eq. (1). It should be noted that additional noise allows the signal to have negative values, as opposed to the process described by Eq. (1).
The auto-correlation function for the process is the same as for , while the stationary PDF for is the convolution of a Gamma and a normal distribution theodorsen-pre . Comparing this distribution to simulations of the process or experimental measurement data provides an estimate of the intermittency parameter and the noise ratio as fit parameters. This distribution has recently been shown to give an excellent description of plasma fluctuations in the SOL of Alcator C-Mod kube-acm-ppcf . Closed analytical expressions for the level crossing rate and average excess times in the case of additional noise have not yet been derived.
V Fluctuation statistics
In this section, predictions of the stochastic model given by Eq. (3) are compared with probe measurements on KSTAR. In order to critically assess the underlying assumptions and predictions of the model, a simulation of the stochastic process has been calculated using model parameters estimated from the long data time series from the probe dwell experiment discussed in Sec. II. Results are presented from an identical analysis of the measurement and synthetic data time series. In the following plots, a full blue line represents results from analysis of the KSTAR ion saturation current time series, a dotted black line is the result of a similar analysis of the synthetic data, and a dashed green line is the best fit of using the analytical function specified in the following.
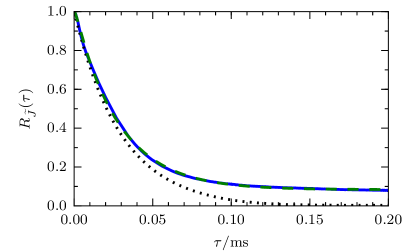
The ion saturation current signal shown in Fig. 2 is clearly dominated by the frequent appearance of large-amplitude bursts, which are generally characterised by an asymmetric wave-form with a fast rise and slower decay. It should be noted that the peak amplitudes of the ion saturation current bursts are typically several times the rms value. The auto-correlation function for the ion saturation current signal and the synthetic data are presented in Fig. 9. The latter has the exponential decay predicted by the model. However, the auto-correlation function for the measurement data does not decay to zero and is in Fig. 9 fitted by the modified exponential function , where . This is clearly an excellent fit to the data and gives a correlation time of s, which is used as an input parameter for the model simulation.
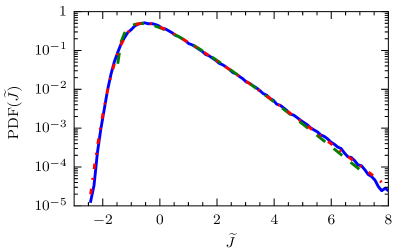
The PDF for the ion saturation current signal is presented in Fig. 10. Also shown in this figure is the best fit of a Gamma distribution, giving , and the best fit of the prediction of the stochastic model with additional noise, which is a convolution of a Gamma and a normal distribution. The latter provides an estimate for the model parameters, which in this case are given by and . The sample skewness and flatness moments for the ion saturation current time series are and , respectively, in agreement with expectations from the stochastic model, which give and , respectively. These values are also consistent with those found for the density scan experiments reported in Sec. III. It should be noted that the distribution function covers more than four decades in probability, which is a result of the long data time series available here.
The saturation current PDF is positively skewed and flattened and has an exponential tail towards large values, reflecting the frequent appearance of large-amplitude bursts in the time series. In order to reveal the statistical properties of these fluctuations, a standard conditional averaging technique is utilised johnsen ; huld ; nielsen . Events when the ion saturation current is above a specified amplitude threshold value are recorded. The algorithm searches the signal for the largest amplitude events, and records conditional sub-records centred around the time of peak amplitude whenever the amplitude condition is satisfied. These sub-records are then averaged over all events to give conditionally averaged wave-forms associated with large-amplitude events in the signal. Overlap of conditional sub-records are avoided in order to ensure statistical independence of the events.
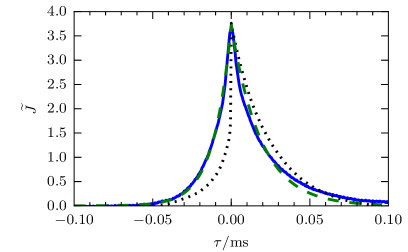
In Fig. 11 the conditionally averaged wave-form for the ion saturation current is presented for peak fluctuation amplitudes larger than 2.5 times the root mean square value and a conditional window duration of s. This resulted in a total of 7471 non-overlapping events for this long data time series. The saturation current wave-form has an asymmetric shape with a fast rise and slower decay, as is also apparent in the raw data presented in Fig. 2. The average wave-form is well described by a double-exponential pulse shape with a rise time of s and fall time of s, giving a duration time of s, in agreement with the correlation analysis presented above. While the underlying pulses for the synthetic data have a sharp rise, the conditionally averaged wave-form has a finite rise time due to pulse overlap. The difference in the shape of the conditional wave-forms for the measurement and synthetic data is therefore as expected. Note that the peak amplitudes are in perfect agreement.
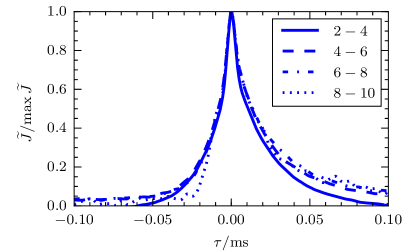
Restricting the peak amplitude of conditional events in the ion saturation current signal to be within a range of 2–4, 4–6, 6–8 and 8–10 times the rms value, the appropriately scaled conditional wave-forms, shown in Fig. 12, reveal that the average burst shapes and durations do not depend on the burst amplitude and are again well described by a double-exponential wave-form. This gives further support for the assumptions underlying the stochastic model presented in Sec. IV.
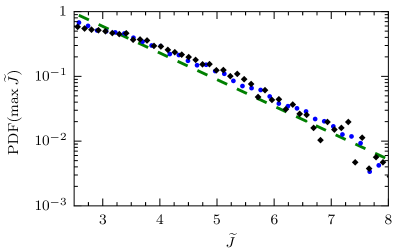
For conditional burst events, the peak amplitudes after the signal crosses a certain threshold level are also recorded. Fig. 13 shows the distribution of these peak amplitudes for ion saturation current and synthetic data fluctuations larger than 2.5 times the rms level. This is clearly well described by a truncated exponential distribution, as might be expected from the exponential tail in the distribution function for the full signal presented in Fig. 10. The mean value of the fitted exponential distribution is , consistent with the peak amplitude of the conditionally averaged ion saturation current wave-form shown in Fig. 11. There is excellent agreement for the amplitude distribution between the measurement and synthetic data.
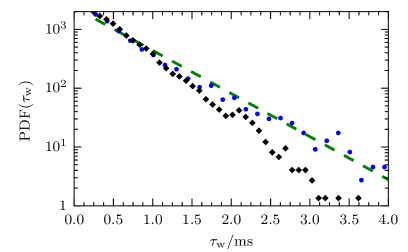
From the occurrence times of large-amplitude events in the ion saturation current signal, the waiting times between them is also calculated. As shown in Fig. 14, for peak amplitudes larger than 2.5 times the rms value, the waiting time distribution is well described by an exponential function over three orders of magnitude on the ordinate. The mean value of the waiting times based on this fit is ms. Such an exponential distribution of waiting times is in accordance with a Poisson process, suggesting that large-amplitude fluctuations in the far-SOL are uncorrelated. A similar analysis of the synthetic data also reveals exponentially distributed waiting times, but the average waiting time is slightly shorter than for the measurement data. The reason for this has yet to be clarified.
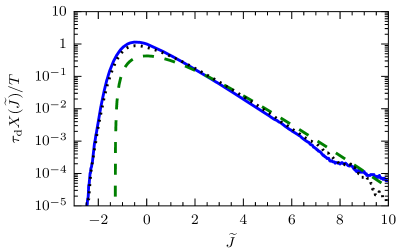
For a time series of duration , the number of up-crossings over the level is denoted by . The normalised rate of such level crossings is presented in Fig. 15 for both the measurement and synthetic data time series. This is compared to an analytical prediction for the stochastic model described by Eq. (1) theodorsen-php ; garcia-php . The number of up-crossings of the -level is 18298 for the ion saturation current time series. As expected, the rate of level crossings is largest around the mean value of the signal. The analytical model under-estimates the rate of level crossings for low threshold levels, which is obviously due to the additional noise in the measurement and synthetic data time series. However, the tail behaviour for large threshold levels compares favourably with the analytical expression. For all threshold levels, there is excellent agreement between the measurements and the synthetic data.
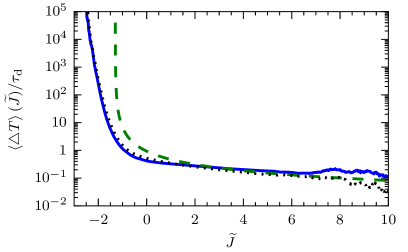
For the stationary stochastic process described by Eq. (1) it is possible to calculate analytically both the number of up-crossings and the total time spent above a given threshold level, the latter given by the complementary cumulative distribution function. The ratio of these gives the average duration of time intervals spent above the threshold level theodorsen-php ; garcia-php . In Fig. 16 this theoretical prediction is compared to direct computations of the average excess times for the measurement and synthetic data time series. Since both the distribution function and level crossing rate are well described by the model realisation, the excellent agreement between measurement and synthetic data in Fig. 16 comes as no surprise. As for the level crossing rate, the analytical model without additive noise fails to accurately describe average excess times for low threshold levels. For large threshold levels, the average duration of excess times is slightly smaller than the pulse duration and decreases gradually with the threshold level.
VI Discussion and conclusions
Langmuir probe measurements at the outboard mid-plane region of KSTAR have revealed results that are consistent with observations in many other devices. The SOL generally exhibits a two-layer structure: a near-SOL with a steep profile and moderate fluctuation level near the separatrix, and a flatter profile with larger fluctuations outside this in the so-called far-SOL. As the line-averaged plasma density increases, the profile scale length in the far-SOL increases and the break point between the near- and far-SOL regions moves radially inwards. This substantially enhances plasma interactions with the main chamber walls.
The large profile scale length and fluctuation level in the far-SOL region is generally attributed to the radial motion of blob-like plasma filaments. The stochastic model outlined in Sec. IV predicts an exponential radial profile for a super-position of propagating pulses with constant size and velocity garcia-php ,
| (4) |
where the parallel transit time is estimated by the ratio of the magnetic connection length and the sound speed , . Since the connection length and electron temperature typically remain constant in the far-SOL, this suggests that the increase in the profile scale length is due to faster blob-like plasma filaments. However, the average density in the SOL may also increase due to higher pulse amplitudes and stronger pulse overlap.
The far-SOL in KSTAR is characterised by large relative fluctuation levels and positively skewed and flattened fluctuations. Similar to observations on several other tokamaks, these moments vary little with radial position and line-averaged density labombard1 ; garcia-tcv-jnm ; garcia-tcv-nf ; rudakov-nf . This suggests that while the fluctuations are strongly intermittent, they have universal properties. These properties have been explored by a novel experiment on KSTAR in which the probe was dwelled in the far-SOL during an entire discharge in order to obtain a time series of the ion saturation current under stationary plasma conditions of unprecedented duration. It is found that large-amplitude bursts on average have an exponential wave-form with exponentially distributed burst amplitudes and waiting times. Moreover, the burst shape and duration does not depend on the burst amplitude, similar to previous results from Alcator C-Mod and TCV garcia-acm-jnm ; garcia-acm-php ; garcia-tcv-nfl ; theodorsen-tcv-ppcf ; kube-acm-ppcf .
These are exactly the assumptions underlying a recently proposed stochastic model for the intermittent plasma fluctuations described as a super-position of uncorrelated pulses garcia-prl ; garcia-php ; theodorsen-php . Consistent with predictions of this model, the auto-correlation function for the ion saturation current time series is found to be exponential, the PDF is given by a Gamma distribution and there is a parabolic relation between the skewness and flatness moments. By adding random noise to this process, an identical analysis of a model simulation and the measured ion saturation current are in excellent agreement, demonstrating that the stochastic process reproduces all the salient statistical properties of the plasma fluctuations.
Based on the stochastic model, novel predictions have been given for the rate of level crossings and the average duration of time intervals spent above a specified threshold level garcia-php ; theodorsen-php . By adding random noise, a realisation of the process have been shown to give predictions of these quantities that are in excellent agreement with the experimental measurements. Provided the fluctuation statistics have universal properties, an experimental determination of the correlation time and the lowest order statistical moments are thus sufficient in order to predict the distribution of fluctuation amplitudes, level crossing rates and excess times in the vicinity of the main chamber walls. These quantities are particularly relevant for plasma–surface interaction processes such as sputtering and melting, which are threshold phenomena.
Acknowledgements
This research was partially supported by Ministry of Science, ICT, and Future Planning under KSTAR project and was partly supported by National Research Council of Science and Technology (NST) under the international collaboration and research in Asian countries, PG-1314. The views and opinions expressed herein do not necessarily reflect those of the ITER Organization. ITER is the Nuclear Facility INB-174. OEG, RK and AT were supported with financial subvention from the Research Council of Norway under grant 240510/F20.
References
- (1) D. A. D’Ippolito, J. R. Myra and S. J. Zweben, Phys. Plasmas 18, 060501 (2011).
- (2) O. E. Garcia, Plasma Fusion Res. 4, 019 (2009).
- (3) R. A. Pitts, J. P. Coad, D. P. Coster, G. Federici, W. Fundamenski, J. Horacek, K. Krieger, A. Kukushkin, J. Likonen and G. F. Matthews, Plasma Phys. Contr. Fusion 47, B303 (2005).
- (4) R. A. Pitts, S. Carpentier, F. Escourbiac, T. Hirai, V. Komarov, A. S. Kukushkin, S. Lisgo, A. Loarte, M. Merola, R. Mitteau, A. R. Raffray, M. Shimada, and P. C. Stangeby, J. Nuclear Mater. 415, S957 (2011).
- (5) B. Lipschultz, X. Bonnin, G. Counsell, A. Kallenbach, A. Kukushkin, K. Krieger, A. Leonard, A. Loarte, R. Neu, R. A. Pitts, T. Rognlien, J. Roth, C. Skinner, J. L. Terry, E. Tsitrone, D. Whyte, S. Zweben, N. Asakura, D. Coster, R. Doerner, R. Dux, G. Federici, M. Fenstermacher, W. Fundamenski, P. Ghendrih, A. Herrmann, J. Hu, S. Krasheninnikov, G. Kirnev, A. Kreter, V. Kurnaev, B. LaBombard, S. Lisgo, T. Nakano, N. Ohno, H. D. Pacher, J. Paley, Y. Pan, G. Pautasso, V. Philipps, V. Rohde, D. Rudakov, P. Stangeby, S. Takamura, T. Tanabe, Y. Yang and S. Zhu, Nucl. Fusion 47, 1189 (2007).
- (6) D. G. Whyte, B. L. Lipschultz, P. C. Stangeby, J. Boedo, D. L. Rudakov, J. G. Watkins and W. P. West, Plasma Phys. Contr. Fusion 47, 1579 (2005).
- (7) N. Asakura, Y. Koide, K. Itami, N. Hosogane, K. Shimizu, S. Tsuji-Iio, S. Sakurai, A. Sakasai, J. Nuclear Mater. 241, 559 (1997).
- (8) B. L. Lipschultz, D. Whyte and B. LaBombard, Plasma Phys. Contr. Fusion 47, 1559 (2005).
- (9) B. LaBombard, J. W. Hughes, D. Mossessian, M. Greenwald, B. Lipschultz, J. L. Terry and the Alcator C-Mod Team, Nucl. Fusion 45, 1658 (2005).
- (10) B. LaBombard, R. L. Boivin, M. Greenwald, J. Hughes, B. Lipschultz, D. Mossessian, C. S. Pitcher, J. L. Terry, S. J. Zweben and Alcator Group, Phys. Plasmas 8, 2107 (2001).
- (11) D. L. Rudakov, J. A. Boedo, R. A. Moyer, P. C. Stangeby, J. G. Watkins, D. G. Whyte, L. Zeng, N. H. Brooks, R. P. Doerner, T. E. Evans, M. E. Fenstermacher, M. Groth, E. M. Hollmann, S. I. Krasheninnikov, C. J. Lasnier, A. W. Leonard, M. A. Mahdavi, G. R. McKee, A. G. McLean, A. Yu. Pigarov, W. R. Wampler, G. Wang, W. P. West and C. P. C. Wong, Nucl. Fusion 45, 1589 (2005).
- (12) O. E. Garcia, R. A. Pitts, J. Horacek, A. H. Nielsen, W. Fundamenski, J. P. Graves, V. Naulin and J. Juul Rasmussen, J. Nuclear Mater. 363–365, 575 (2007).
- (13) O. E. Garcia, J. Horacek, R. A. Pitts, A. H. Nielsen, W. Fundamenski, V. Naulin and J. Juul Rasmussen, Nucl. Fusion 47, 667 (2007).
- (14) O. E. Garcia, R. A. Pitts, J. Horacek, J. Madsen, V. Naulin, A. H. Nielsen and J. Juul Rasmussen, Plasma Phys. Contr. Fusion 49, B47 (2007).
- (15) B. LaBombard, J. L. Terry, J. W. Hughes, D. Brunner, J. Payne, M. L. Reinke, I. Cziegler, R. Granetz, M. Greenwald, I. H. Hutchinson, J. Irby, Y. Lin, B. Lipschultz, Y. Ma, E. S. Marmar, W. L. Rowan, N. Tsujii, G. Wallace, D. G. Whyte, S. Wolfe, S. Wukitch, G. Wurden and Alcator C-Mod Team, Phys. Plasmas 15, 056106 (2008).
- (16) D. Carralero, G. Birkenmeier, H. W. Müller, P. Manz, P. deMarne, S. H. Müller, F. Reimold, U. Stroth, M. Wischmeier, E. Wolfrum and The ASDEX Upgrade Team, Nucl. Fusion 54, 123005 (2014).
- (17) D. Carralero, H. W. Müller, M. Groth, M. Komm, J. Adamek, G. Birkenmeier, M. Brix, F. Janky, P. Hacek, S. Marsen, F. Reimold, C. Silva, U. Stroth, M. Wischmeier, E. Wolfrum, ASDEX Upgrade Team, COMPASS Team and JET-EFDA Contributors, J. Nuclear Mater. 463, 123 (2015).
- (18) F. Militello, L. Garzotti, J. Harrison, J. T. Omotani, R. Scannell, S. Allan, A. Kirk, I. Lupelli, A. J. Thornton and the MAST team, Nucl. Fusion 56, 016006 (2016).
- (19) D. Carralero, P. Manz, L. Aho-Mantila, G. Birkenmeier, M. Brix, M. Groth, H. W. Müller U. Stroth, N. Vianello, E. Wolfrum, ASDEX Upgrade team, JET Contributors, and EUROfusion MST1 Team, Phys. Rev. Lett. 115, 215002 (2015).
- (20) J. G. Bak, S. G. Lee, J. Y. Kim and the KSTAR Project Team, Contrib. Plasma Phys. 50, 892 (2010).
- (21) J. G. Bak, H. S. Kim, M. K. Bae, J. W. Juhn, D. C. Seo, E. N. Bang, S. B. Shim, K. S. Chung, H. J. Lee and S. H. Hong, J. Nuclear Mater. 463, 424 (2015).
- (22) O. E. Garcia, I. Cziegler, R. Kube, B. LaBombard and J. L. Terry, J. Nuclear Mater. 438, S180 (2013).
- (23) O. E. Garcia, S. M. Fritzner, R. Kube, I. Cziegler, B. LaBombard and J. L. Terry, Phys. Plasmas 20 055901 (2003).
- (24) R. Kube, A. Theodorsen, O. E. Garcia, B. LaBombard and J. L. Terry, Plasma Phys. Contr. Fusion 58, 054001 (2016).
- (25) A. Theodorsen, O. E. Garcia, J. Horacek, R. Kube and R. A. Pitts, Plasma Phys. Contr. Fusion 58, 044006 (2016).
- (26) O. E. Garcia, J. Horacek and R. A. Pitts, Nucl. Fusion 55, 062002 (2015).
- (27) R. Kube and O. E. Garcia, Phys. Plasmas 22, 012502 (2015).
- (28) O. E. Garcia, Phys. Rev. Lett. 108, 265001 (2012).
- (29) O. E. Garcia, R. Kube, A. Theodorsen and H. L. Pécseli, Phys. Plasmas 23, 052308 (2016).
- (30) A. Theodorsen and O. E. Garcia, Phys. Plasmas 23, 040702 (2016).
- (31) A. Theodorsen, O. E. Garcia and M. W. Rypdal, “Statistical properties of a filtered Poisson process with additive random noise: Distributions, correlations and moment estimation´´ submitted to Phys. Rev. E (2016).
- (32) H. Sato, H. L. Pécseli and J. Trulsen, J. Geophys. Res. 117, A03329 (2012).
- (33) L. Fattorini, Å. Fredriksen, H. L. Pécseli, C. Riccardi and J. K. Trulsen, Plasma Phys. Contr. Fusion 54, 085017 (2012).
- (34) M. Greenwald, Plasma Phys. Contr. Fusion 44, R27 (2002).
- (35) H. Johnsen, H. L. Pécseli and J. Trulsen 1987 Phys. Fluids 30 2239
- (36) T. Huld, A. H. Nielsen, H. L. Pecseli and J. Juul Rasmussen 1991 Phys. Fluids B 3 1609
- (37) A. H. Nielsen, H. L. Pécseli and J. Juul Rasmussen 1996 Phys. Plasmas 3 1530