Raman spectroscopy of rare-earth orthoferrites RFeO3 (R = La, Sm, Eu, Gd, Tb, Dy)
Abstract
We report a Raman scattering study of six rare earth orthoferrites RFeO3, with R = La, Sm, Eu, Gd, Tb, Dy. The use of extensive polarized Raman scattering of SmFeO3 and first-principles calculations enable the assignment of the observed phonon modes to vibrational symmetries and atomic displacements. The assignment of the spectra and their comparison throughout the whole series allows correlating the phonon modes with the orthorhombic structural distortions of RFeO3 perovskites. In particular, the positions of two specific Ag modes scale linearly with the two FeO6 octahedra tilt angles, allowing the distortion throughout the series. At variance with literature, we find that the two octahedra tilt angles scale differently with the vibration frequencies of their respective Ag modes. This behavior as well as the general relations between the tilt angles, the frequencies of the associated modes and the ionic radii are rationalized in a simple Landau model. The reported Raman spectra and associated phonon-mode assignment provide reference data for structural investigations of the whole series of orthoferrites.
I Introduction
In the past, RFeO3 perovskites have attracted considerable interest due to their remarkable magnetic properties White1969 ; White1982a ; Eibschutz1967 . At ambient conditions, they adopt an orthorhombic Pnma structure, hence their common name orthoferrites. This orthorhombic structure can be derived from the ideal cubic perovskite structure by rotations (tilts) of its FeO6 octahedra, where the tilt angles can be tuned by the size of the rare earth R. All members of the family possess a canted antiferromagnetic structure arising from spin moments of the Fe3+ cations. The antiferromagnetic ordering of the iron ions occurs at a N el temperature around 650 to 700 K. Several orthoferrites show a spin reorientation at lower temperatures. In contrast to the Fe3+ cations, the magnetic moments of the R3+ rare earth ions order below 10 K. Interestingly, a so-called compensation point where moments of the two sublattices cancel has been reported for several RFeO3 compounds White1969 . More recent studies have also focused on spin-ordering processes of the rare earth ions Zhao2016 ; Cao2014 ; Marshall2012 and the interaction between magnetism and crystal lattice, including the role of spin-lattice coupling in multiferroic properties Tokunaga2009 ; Du2010a ; Lee2011 ; Kuo2014 ; Cheng2014a .
Tilts of the FeO6-octahedra are the main structural parameters to tune the band overlap and thus the physical properties of orthoferrites. Unfortunately, tilt angles are chronically difficult to probe directly, specifically in thin films, because they require in depth diffraction experiments needing at best large-scale instruments using neutron or synchrotron radiation. Alternatively, Raman spectroscopy (RS) is a well-known technique to follow tilt-driven soft mode phase transitions Fleury1968 ; Scott1969 ; Scott1974 . More recently, it has been shown that RS is also an appropriate probe for the investigation of lattice distortions and slight changes in octahedra rotations Iliev2006a ; Chaix-Pluchery2011 ; Weber2012 ; Todorov2012 . Further to this, RS is an ideal probe for the investigation of spin-phonon coupling phenomena Laverdiere2006 ; Ferreira2009 ; Moreira2010 ; Bhadram2013 ; ElAmrani2014 . Finally, RS is a now widely used technique for probing even subtle strain-induced structural modifications in oxide thin films Tenne2006 ; Weber2016 ; Kreisel2012 . All such investigations rely on thorough reference spectra, solid knowledge of the relations between structural distortions phonon modes, and on a proper band assignment of vibrational bands in terms of symmetry and atomic displacement patterns. The present paper aims at providing this fundamental knowledge by investigating both experimentally and theoretically a series of orthoferrites and by proposing a consolidated view of this new data together with available literature data on other members of the family.
II Experimental
SmFeO3 single crystals were grown in an optical-floating-zone
furnace as described elsewhere Cao2014 . Three single domain
platelets were oriented along the three orthorhombic directions, with
their edges also parallel to cristallographic axes, and polished down
to a thickness of 100 m. The single domain state was
verified by XRD and polarized light microscopy. A SmFeO3 crystal
was manually grinded to acquire a homogeneous powder. LaFeO3 and
EuFeO3 powders were obtained by conventional solid state
reactions. GdFeO3 and DyFeO3 powder samples were prepared using
the urea sol-gel combustion method, reported elsewhere
Moreira2010a and their quality was checked by XRD and
SEM. TbFeO3 samples were prepared by floating zone method in
FZ-T-4000 (Crystal Systems Corporation) mirror furnace. As starting
materials, Fe2O3 (purity 2N, supplier: Sigma Aldrich), and
Tb4O7 (purity 3N, supplier: Alpha Aesar) were used. They
were mixed in a Tb:Fe stoichiometric ratio, cold pressed into rods and
sintered at 1100 ∘C from 12 to 14 hours in air. Their quality
was checked by X-ray powder diffraction and by energy dispersion X-ray
analysis, confirming the single perovskite phase.
Raman scattering measurements were performed with an inVia Renishaw
Reflex Raman Microscope in micro-Raman mode. For excitation a 633 nm
He-Ne laser with a spectral cut-off at 70 cm-1 was used. Great
care was taken to avoid heating of the sample by limiting the incident laser power. Samples were
cooled to liquid nitrogen temperature in a Linkam THMS600 stage in
order to reduce thermal broadening of the spectra and ease the
identification of Raman bands. The band positions were obtained
by fitting the spectra with Lorentzian functions.
For the calculations we used density functional theory (DFT) within the generalized gradient approximation revised for solids,Perdew2008 as implemented in the Vienna ab-initio Simulation Package (VASP)Kresse1996 ; Kresse1999 . For a better treatment of iron’s 3 electrons, we used the Hubbard-like correction proposed by Dudarev et al.,Dudarev1998 with = 4 eV. The ionic cores were treated within the projection augmented approximation (PAW),blochl94 and the following electrons were explicitly solved in the simulations: O’s 2s22p4; Fe’s 3p63d74s1; 5p65d16s2 for Eu, Gd, Tb, and Dy; and 5s25p65d16s2 for Sm and La. Note that, for the generation of the PAW potentials of the rare-earth species, a ionization state was assumed and the remaining 4 electrons were considered to be frozen in the ionic core. We explicitly checked in one case (GdFeO3) that this approximation has a very small impact on the phonon frequencies and eigenvectors of interest in this work. Electronic wave functions are described in a basis of plane waves cut-off at 500 eV; reciprocal space integrals in the Brillouin zone of the 20-atom cell were computed in a mesh of -points. Structural optimization were performed until residual atomic forces are smaller than 0.01 eV/Å and phonon spectra were computed calculated by the finite difference method.
III Results and Discussion
III.1 Structural properties of the RFeO3 series
Rare earth orthoferrites crystallize in an orthorhombic Pnma
structure at ambient conditions. With respect to the parent cubic
perovskite phase Pmm, the Pnma structure in orthoferrites can be derived by octahedral
rotations. In Glazer’s notation the octahedra tilt system is expressed
as a-b+a- Glazer1972 or in pseudo-cubic
settings as rotations , and around the
[101]pc, [010]pc and
[111]pc, respectively Mitchell2002 . Megaw has
shown that it is sufficient to consider two independent angles
and in order to describe the octahedral rotations of
the Pnma phase, assuming that the octahedral tilts
a and a are approximately equal
Megaw1973 . The angle can be then expressed as
Mitchell2002 . The
octahedra rotations represent the order parameters for a hypothetical
phase transition to the cubic Pmm phase.
Similar to other perovskites with Pnma structure, such
as orthochromites RCrO3, orthomanganites
RMnO3, orthonickelates RNiO3, or
orthoscandates RScO3, we can assume in good approximation
that changing the rare earth affects negligibly the chemical bonding
of the material. In contrast, the size of the rare earth impacts on
the distortions of the structure, as measured for example by the tilt
angles or the spontaneous strains, and can be continuously tuned by
the size of the R3+ rare earth. The octahedral rotations
are most reliably calculated from atomic positions following the
formalism in Ref. Zhao1993, . Table 1
summarizes the structural properties of all members of the
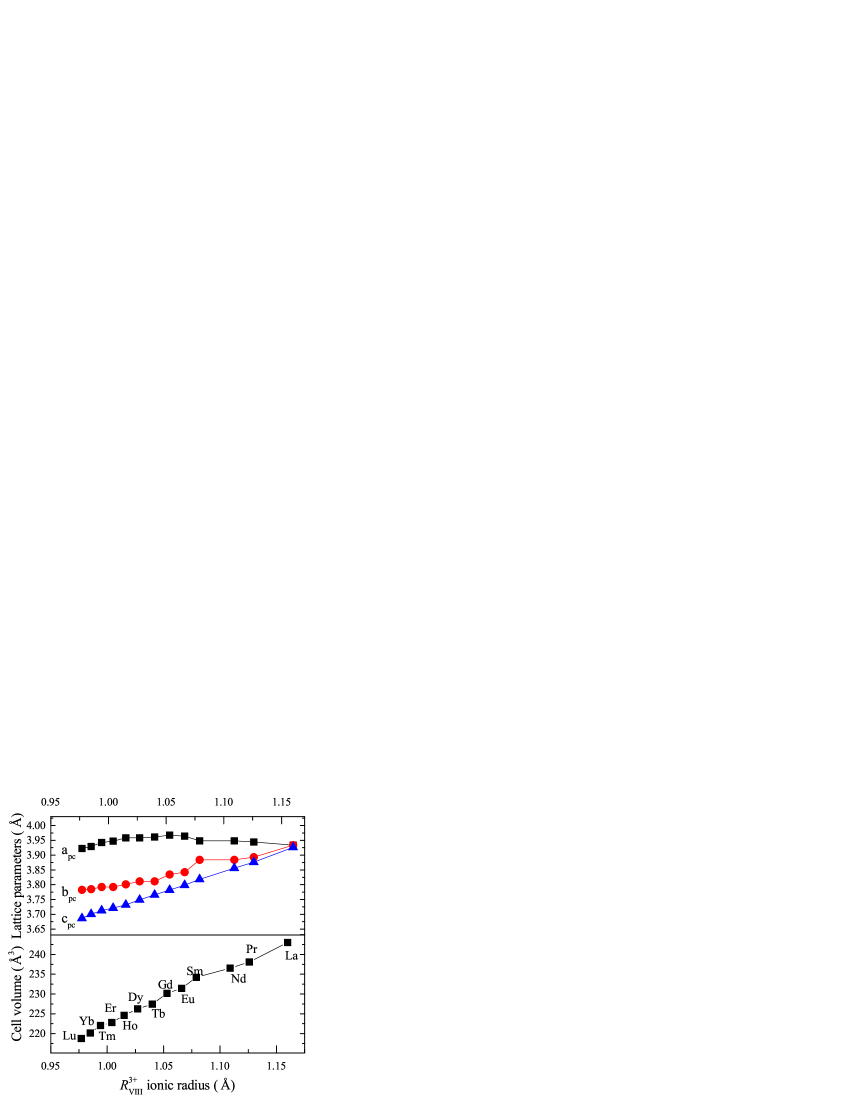
RFeO3 family. In Fig. 1 the structural
evolution throughout the series is illustrated by the unit cell
volume, which scales linearly with the ionic radius, and the lattice
parameters.
The tolerance factor, given in Table 1, is an indication for the stability of the perovskite structure. The closer its value is to , the closer the structure is to the cubic structure. From both, pseudo-cubic lattice parameters and tolerance factor, we find that with increasing ionic radius of the rare earth, from lutetium to lanthanum, the structure approaches a cubic metric. Notably, LaFeO3 appears to be closest to a cubic structure.
| Lattice parameters ( setting) | FeO6 octhahedra tilt angle | ||||||||
|---|---|---|---|---|---|---|---|---|---|
| r | a (Å) | b (Å) | c (Å) | V (Å3) | t | [010] (∘) | [101] (∘) | ||
| LaFeO3 | 1.160 | 5.563 | 7.867 | 5.553 | 243.022 | 0.934 | 7.3 | 12.2 | |
| PrFeO3 | 1.126 | 5.578 | 7.786 | 5.482 | 238.085 | 0.921 | 9.6 | 13.6 | |
| NdFeO3 | 1.109 | 5.584 | 7.768 | 5.453 | 236.532 | 0.915 | 10.0 | 14.5 | |
| SmFeO3 | 1.079 | 5.584 | 7.768 | 5.400 | 234.233 | 0.904 | 11.2 | 15.6 | |
| EuFeO3 | 1.066 | 5.606 | 7.685 | 5.372 | 231.437 | 0.899 | 11.6 | 16.0 | |
| GdFeO3 | 1.053 | 5.611 | 7.669 | 5.349 | 230.172 | 0.894 | 11.9 | 16.2 | |
| TbFeO3 | 1.040 | 5.602 | 7.623 | 5.326 | 227.442 | 0.889 | 12.1 | 16.9 | |
| DyFeO3 | 1.027 | 5.598 | 7.623 | 5.302 | 226.255 | 0.884 | 12.6 | 17.3 | |
| HoFeO3 | 1.015 | 5.598 | 7.602 | 5.278 | 224.611 | 0.880 | 12.7 | 17.7 | |
| ErFeO3 | 1.004 | 5.582 | 7.584 | 5.263 | 222.803 | 0.876 | 12.9 | 18.2 | |
| TmFeO3 | 0.994 | 5.576 | 7.584 | 5.251 | 222.056 | 0.872 | 12.9 | 18.6 | |
| YbFeO3 | 0.985 | 5.557 | 7.570 | 5.233 | 220.134 | 0.869 | 13.4 | 19.0 | |
| LuFeO3 | 0.977 | 5.547 | 7.565 | 5.213 | 218.753 | 0.866 | 13.2 | 19.5 | |
III.2 Raman spectra and mode assignment
The orthorhombic Pnma structure gives rise to 24 Raman-active vibrational modes Kroumova2003 , which decompose into 7Ag + 5B1g + 7B2g + 5B3g. Schematically, the vibration modes below 200 cm-1 are mainly characterized by displacements of the heavy rare-earth ions. Above 300 cm-1, motions of the light oxygen ions dominate, and in the intermediate frequency range vibration patterns involve both ions. Note that iron ions occupy centers of inversion in the Pnma structure and, therefore, vibrations involving Fe3+ motions are not Raman-active. Fig. 2 shows the Raman spectra of six rare earth orthoferrites RFeO3 (R = La, Sm, Eu, Gd, Tb, Dy), all measured at 80 K in order to reduce thermal broadening and make mode identification easier. Thanks to well-defined spectra, we identify between 18 and 21 vibration bands, depending on the compound. The remaining predicted modes are either masked by band overlap or their intensity is below the detection limit. The Raman spectra of SmFeO3, EuFeO3, GdFeO3, TbFeO3 and DyFeO3 present a similar overall shape which allows to follow the evolution of particular bands throughout the series. The spectral signature of LaFeO3 is distinctly different as explained by the size difference between La3+ and the closest Sm3+ and also its proximity to the cubic structure (see Fig. 1). This is similar to observations for other rare earth perovskites, where the Raman spectrum of the lanthanum member is systematically different when compared to the remaining members of the series Iliev2006a ; Weber2012 ; Daniels2013 . This will be elaborated on later in the discussion.

In order to go further in the mode assignment, we performed a polarized Raman study of SmFeO3 single crystals. Indeed, the identification of the symmetry of the difference Raman bands is difficult if not impossible from powder samples alone. On the other hand, polarized Raman spectroscopy on well-oriented single crystals allows identifying the symmetries of phonon bands. Raman modes of a given symmetry can be selectively probed through particular configurations of incident and scattered light polarizations with respect to the orientation of the crystal. This experimental configuration is expressed in Porto’s notation Damen1966 . In the following, we use X, Y, Z to indicate the crystallographic axes in the Pnma setting. Figure 3 presents the obtained results for SmFeO3 single crystals for twelve scattering configurations. Fig. 3a shows the Raman spectra for Ag configurations modes, while spectra exhibiting B1g, B2g or B3g modes are given in Fig. 3b. In total, we identify all expected Ag, six B2g modes and four out of five B1g and B3g modes (see Table 2).
In a next step, we run DFT calculations of phonon modes for all
measured orthoferrites in order to confirm the mode symmetries and
associate a vibrational pattern to each mode. A summary of all
theoretical and experimental band frequencies with their symmetry and
characteristic atomic motions is given in
Table 2. The calculated frequencies are in very good
agreement with our experimental values and the continuous evolution of
the spectral signature.
The band between 600 and 650 cm-1 in Fig. 3a shows a peculiar behaviour and needs a specific discussion. First, as can be seen in Fig. 2, its frequency seems to be independent of the rare earth. Besides, it shows intensity variations from sample to sample that contrast with the other bands, and also exhibits a strong asymmetry. For SmFeO3, Fig. 3 shows that these bands appear with very low intensity in crossed polarization but are strongly visible in parallel configuration, which would rather point to a Ag symmetry. However, as can be seen in Table 2, the calculations predict two bands of B2g and B3g symmetry in this region, but no Ag Raman mode, and all Ag modes are already conclusively attributed. We therefore conclude that this band is not a first-order Raman mode.
A precise interpretation for this band is beyond the scope of this work, but we note that similar features have been described for other perovskite oxides, with unclear assignments and conflicting reports. As an example, Iliev et al. discussed it for LaCrO3 Iliev2006c and demonstrated that its intensity can be reduced by annealing the sample in vacuum. Therefore it seems likely that it is related to chemical defects of the lattice Iliev2006c . Here, we note that DyFeO3 and GdFeO3, where this band is stronger, were produced by a chemical metalorganic process, whereas the other samples (LaFeO3, SmFeO3, EuFeO3 and TbFeO3) were synthesized by solid-state reaction. A difference in defect chemistry originating from different growth processes is therefore plausible.


| Symmetry | LaFeO3 | SmFeO3 | EuFeO3 | GdFeO3 | TbFeO3 | DyFeO3 | main atomic motion | ||||||
|---|---|---|---|---|---|---|---|---|---|---|---|---|---|
| 80 K | calc. | 80 K | calc. | 80 K | calc. | 80 K | calc. | 80 K | calc. | 80 K | calc. | ||
| Ag(1) | 84.5 | 89 | 109.5 | 109 | 110.9 | 112 | 111.1 | 111 | 112.5 | 112 | 113.3 | 112 | (x), in-phase in x-z, out-of-phase in y |
| Ag(2) | 135.3 | 127 | 144.2 | 138 | 140.7 | 140 | 140.4 | 137 | 143.9 | 136 | 140.5 | 135 | (z), out-of-phase |
| Ag(3) | 186.6 | 183 | 223.9 | 244 | 235.1 | 252 | 253.2 | 255 | 261.9 | 259 | 261.5 | 262 | [010]pc FeO6 rotation, in-phase |
| Ag(4) | 274.2 | 273 | 319.1 | 320 | 323.2 | 325 | 329.9 | 330 | 334.5 | 330 | 341.1 | 332 | O(1) x-z plane |
| Ag(5) | 302.8 | 306 | 379.5 | 383 | 387.8 | 397 | 399.4 | 405 | 410.9 | 410 | 422.4 | 422 | [101]pc FeO6 rotation, in-phase |
| Ag(6) | 449.8 | 433 | 420.7 | 413 | 419.6 | 414 | 420.9 | 416 | 420.1 | 416 | 417.3 | 415 | Fe-O(2) stretching, in-phase |
| Ag(7) | 433.3 | 413 | 470.7 | 468 | 474.0 | 476 | 483.6 | 480 | 490.1 | 484 | 496.8 | 490 | O(1)-Fe-O(2) scissor-like bending |
| B1g(1) | 169 | 160.7 | 151 | 149 | 143 | 139 | 135 | (y) in-phase in x-z, out-of-phase in y | |||||
| B1g(2) | 148 | 238.7 | 233 | 236.4 | 243 | 247.1 | 244 | 251.9 | 248 | 250 | [010]pc FeO6 rotation, out-of-phase | ||
| B1g(3) | 338.1 | 328 | 353.3 | 352 | 350.0 | 356 | 357.0 | 356 | 359.2 | 356 | 360.9 | 359 | [010]pc FeO6 rotating, out-of-phase |
| B1g(4) | 442.3 | 425 | 426.4 | 422 | 425.8 | 424 | 428.8 | 426 | 427.7 | 425 | 427.4 | 427 | Fe-O(2) stretching, out-of-phase |
| B1g(5) | 560.9 | 584 | 594 | 597 | 595 | 592 | 593 | Fe-O(1) stretching | |||||
| B2g(1) | 105.5 | 103 | 109.8 | 109 | 110.9 | 111 | 111.1 | 109 | 107.7 | 109 | 110.6 | 109 | (z), in-phase in x-z, out-of-phase in y |
| B2g(2) | 143.0 | 144 | 157.4 | 159 | 159.3 | 163 | 159.9 | 161 | 160.1 | 161 | 162.8 | 161 | (x), out-of-phase |
| B2g(3) | 166.5 | 172 | 255.0 | 278 | 271.1 | 291 | 289.3 | 299 | 302.7 | 305 | 324.9 | 311 | [101]pc FeO6 rotation, in-phase |
| B2g(4) | 329 | 346 | 348 | 349 | 349 | 351 | O(1) x-z plane | ||||||
| B2g(5) | 416.8 | 401 | 462.8 | 460 | 468.2 | 469 | 478.9 | 474 | 485.6 | 478 | 493.7 | 482 | O(1)-Fe-O(2) scissor-like bending |
| B2g(6) | 481 | 521.5 | 513 | 524.5 | 521 | 531.7 | 528 | 535.8 | 528 | 534 | O(2)-Fe-O(2) scissor-like bending, in-phase | ||
| B2g(7) | 625.1 | 622 | 640.5 | 610 | 638.1 | 613 | 640.5 | 612 | 611 | 624.2 | 612 | Fe-O(2) stretching, in-phase | |
| B3g(1) | 137 | 145.0 | 135 | 133.6 | 134 | 132.2 | 129 | 126 | 123 | (y) out-of-phase in x-z, y | |||
| B3g(2) | 316.8 | 300 | 322.8 | 313 | 315 | 312 | 311 | 311 | O(1)-Fe-O(2) in-phase | ||||
| B3g(3) | 436.0 | 425 | 432.7 | 424 | 429.9 | 424 | 431.5 | 426 | 433.3 | 422 | 433.1 | 424 | octahedra squeezing in y |
| B3g(4) | 428.6 | 408 | 455.9 | 447 | 456.7 | 452 | 465.0 | 455 | 468.8 | 457 | 473.7 | 460 | O(2)-Fe-O(2) scissor-like bending, out-of-phase |
| B3g(5) | 641.9 | 650 | 641 | 643 | 640 | 637 | 639.4 | 637 | FeO6 breathing | ||||
III.3 Phonon Raman modes vs. ionic radii and octahedra tilt angle
Figure 4 presents the evolution of the band positions
for the different orthoferrites as a function of the ionic radii of
the rare earths. Overall, Raman bands shift to lower frequencies
with increasing r, which naturally correlates with the
increase in volume and, therefore, of most bond lengths. It can
be seen that the frequencies of the Raman modes are differently
sensitive to the change of rare earth. This is understood in the context of the structural instabilities in the Pnma
structure. In the framework of Landau theory, the two octahedra
rotations represent the two order parameters for a phase transition
from the high-symmetry parent cubic perovskite phase. If a
vibrational displacement is directly related to the order parameter,
the phonon mode is called soft mode Hayes1978 ; Scott1974 and
can experience very large frequency shifts.
Thus our Raman data across the RFeO3 family exhibits patterns that provide useful insights into the relations among structural order parameters, associated phonon frequencies, and steric effects driven by the R cation. To understand such patterns better, it is useful to think in terms of the simplest Landau-like potential connecting all the relevant ingredients, which we introduce in the following. Let denote the relevant structural order parameter, which may correspond to either antiphase or in-phase FeO6 rotations in the case of orthoferrite perovskites. Also, let be the isotropic strain of the material, and let us assume that = = 0 corresponds to the ideal cubic perovskite. We can write the Landau free energy as a function of these variables as
| (1) |
where the and parameters define the potential well associated to the -instability, and we have assumed the simplest temperature () dependence of the quadratic term as customarily done in Landau theory. We want to focus on the behavior of the material at temperatures well below the structural transition between the cubic and orthorhombic phases; hence, the transition region is of no interest to us and we can assume a simple fourth-order potential to describe the energy surface, introducing a characteristic whose precise meaning (i.e., whether or not it coincides with the actual transition temperature) is irrelevant here. Our Landau-like potential also includes an elastic constant that quantifies the stiffness of the material, as well as the lowest-order coupling between and that is allowed by symmetry. (Because is a fully-symmetric strain, the coupling that goes as always exists irrespective of the symmetry of ; further, this is the lowest-order coupling provided that is a symmetry-breaking order parameter, as it is the case here.)
In principle, we could write such a potential for each of the orthoferrites, fit the corresponding parameters to reproduce experimental data, etc. However, here we would like to test the following hypothesis: we assume that all the RFeO3 orthoferrites present the same parameters quantifying the energetics of and , and that the only feature changing from compound to compound is the value of the strain , as dictated by the size of the rare-earth cation. More specifically, let be a reference value for the ionic radii of the cations (for the sake of concreteness, we can think of as an average value), and let be the radius of the rare-earth cation for a particular RFeO3 compound; then, such a compound is characterized by a strain , where is a suitable proportionality constant. We can further consider a Landau potential as the above one, but corresponding to some sort of average orthoferrite (i.e., with parameters obtained as an average of the parameters of specific compounds), substitute the expression for , and postulate the resulting -dependent potential as applicable to the whole family:
| (2) |
A key point to realize here is that the compound dependence is restricted to the harmonic part of the potential. Further, formally, the ionic radius plays the exact same role as the temperature.
Now, let us introduce . Then, it is straightforward to derive
| (3) |
for the equilibrium order parameter at . (At such a temperature, we assume for all relevant values.) Further, the associated soft-mode frequency is
| (4) |
where is a mass characteristic of the order parameter; for our FeO6-rotational cases, this reduces to the mass of the oxygen atom. Now, combining these equations we can write
| (5) |
which gives us the desired relation between the compound-dependent parameter (the ionic radius ), temperature, the relevant structural distortion, and its corresponding phonon frequency. In other words, we expect a linear relation between order parameter , i.e. the octahedra tilt angle, and the corresponding soft-mode frequency , which is solely dependent on the ionic radius of the rare earth and the temperature . In particular, if we fix , this expression allows us to compare (and predicts the behavior of) the structural and Raman data across the orthoferrite series.
In order to apply this relation to the orthoferrite family, the identification of the soft modes is crucial. An order parameter may give rise to several soft modes which do not necessarily need to be Raman active. However, using the group theoretical formalism of Landau theory, Birman Birman1973a and Shigenari Shigenari1973 demonstrated that one of the soft modes related to an order parameter has a Raman-active symmetry. In the Pnma structure it is therefore common to focus on the soft modes. From our DFT calculations leading to the assignment of the bands to the respective vibrational pattern (see Table 2), we find that (3) and (5) are the soft-modes to corresponding and , respectively, where and are the order parameters of the Pnma structure representing the octahedra rotations around the [010]pc (in-phase) and the [101]pc (antiphase) axes. The assignment of the (3) as a soft-mode is at variance with earlier work by Todorov and co-workers Todorov2012 and underlines the importance of precise calculations to gain full understanding of the experimental findings.
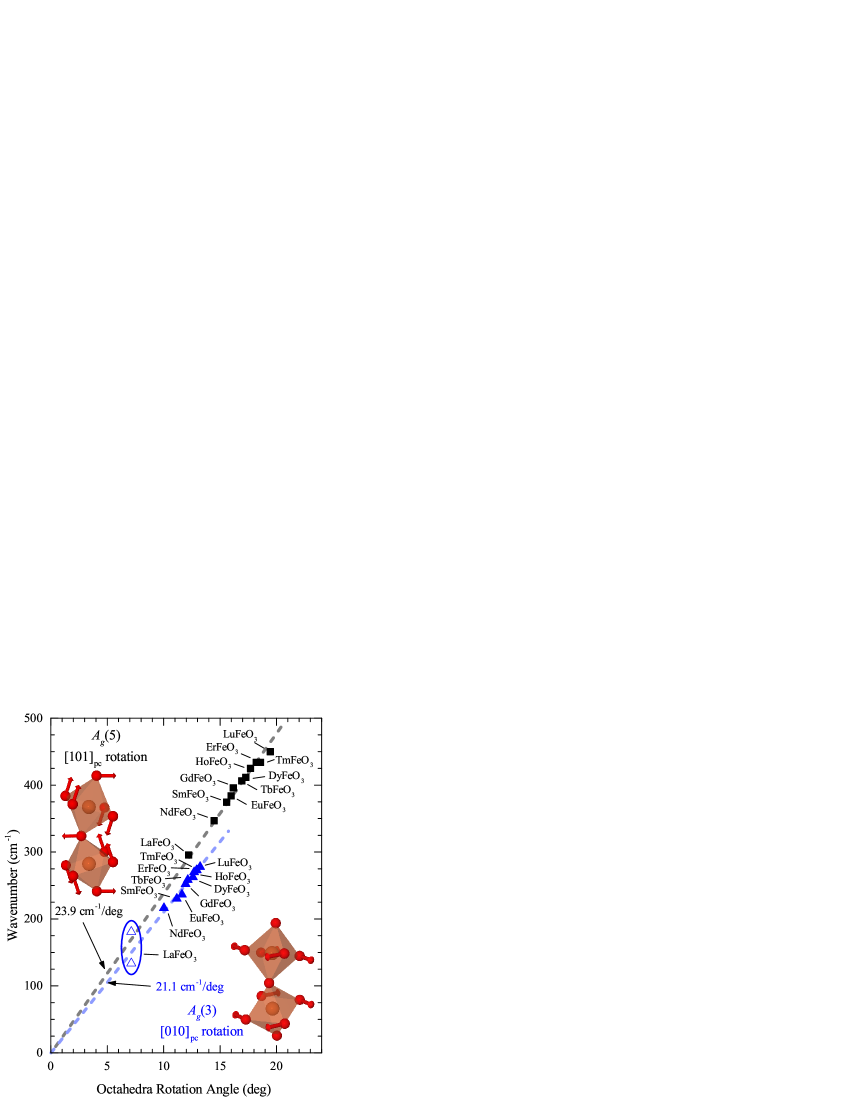
Fig. 5 presents the evolution of the soft modes (3) and (5) against the corresponding tilt angle. For completeness and in order to test the general validity of this model, we extend our graph with literature data on orthoferrites with Lu, Tm, Er, Ho and Nd Venugopalan1990 ; Venugopalan1985 ; Koshizuka1980 ; Singh2008 . The evolution shows the expected linear relation between the vibrational frequencies and the tilt angles of the RFeO3. This adds further support to the proposed soft-mode-like relation of tilt frequency and size of the rare earth, not only in the orthoferrites, but also for other families where this behavior has been experimentally verified: orthomanganites Iliev2006a , orthochromates Weber2012 , orthoscandates Chaix-Pluchery2011 among others Todorov2012 . However, at variance with these previous experimental data, our work on orthoferrites show two additional features that have to be commented on, namely that i) the two tilt modes follow two different lines and ii) LaFeO3 deviates significantly from the general linear behaviour.
The octahedral-rotation angles and soft-mode frequencies do not present the same scaling for the different order parameters. The rotation about [010]pc reveals a scaling factor of 21.1 cm-1/deg whereas the slope of the rotation about [101]pc gives 23.9 cm-1/deg. This is natural and expected when bearing in mind that the two soft modes are associated to two independent order-parameters. The relation in Eq. 5 needs to be separately considered for each of the relevant order parameters (in-phase and antiphase FeO6 rotations in our case), and there is no reason to expect that the values of the coefficients in our Landau potential will be the same for different cases. However, this difference was never pointed out in previous investigations Iliev2006a ; Chaix-Pluchery2011 ; Weber2012 ; Todorov2012 . This probably comes from a combination of factors including experimental difficulties in mode assignment and frequency determination, scattered data from a more limited number of compounds, and possibly differences in scaling factors coincidentally too small to be resolved experimentally. We believe that a careful (re)investigation of the other series will reveal this difference.
Last, we investigate the case of LaFeO3 in more details. For LaFeO3, no Raman mode actually follows the scaling given by the other members of the series. Instead, the (2) and (3) modes, plotted as open triangles in Fig. 5, fall below and above the scaling line respectively. On the other hand, we have already pointed out that the band positions in LaFeO3 differ significantly from the other orthoferrites and do not seem to follow from a continuous evolution of the other spectra. In order to rationalize this comparatively exotic behaviour, we analyzed in details the vibrational patterns given from our first-principles calculations for LaFeO3 and SmFeO3. This comparison reveals several frequency ranges where the modes do not keep their atomic displacement patterns from La to Sm, but instead exhibit mixed characteristics, which is expected from mode coupling phenomena between two modes of the same symmetry getting close to each other. In LaFeO3, the mode mixing occurs in the regions between 100 and 200 cm-1 and 400 and 450 cm-1 as indicated in Fig. 4. In particular, it strongly affects the lower soft mode (3) as it approaches the lower lying (2). For Sm3+ and smaller cations, these two modes have very distinguishable atomic displacement patterns, with the (2) mode being dominated by R3+ displacements while (3) is dominated by octahedral rotations. In contrast, in LaFeO3, the two modes have significant contributions from both La3+ displacement and octahedral rotations. It is therefore no longer possible to identify any of them as the soft mode of interest associated to octahedral tilts only. The soft-mode frequency for a hypothetical unmixed-state would lie between the two positions. This in turns enable us to understand why the Raman spectrum LaFeO3 is significantly different as a whole from the others members of the series, since the mode coupling will affect band positions and intensities. This behavior par excellence has been reported by Iliev et al. in orthomanganites Iliev2006b , was also found in the (La,Sm)CrO3 solid solutions Daniels2013 and is probably a general phenomenon occurring in orthorhombic Pnma perovskites in the limit of small tilt angles, where distortions of the octahedra have to be taken into account Zhou2005 .
IV Conclusion
We have presented a Raman scattering study of a series of orthoferrites RFeO3 (R = La, Sm, Eu, Gd, Tb, Dy). A symmetry assignment of the observed modes has been presented on the basis of a single-crystal study of SmFeO3 and DFT calculations, and by taking advantage of the continuous changes in the Raman spectra across the whole RFeO3 series. This careful assignment has allowed to relate most of the vibration modes to their vibrational pattern and symmetries. Based on this, we can follow the structural evolution across the series and we have namely shown that the (3) and (5) modes are the soft-modes of symmetry which correspond to the octahedral-rotation order-parameters (in-phase octahedral tilts about the [010] pseudocubic axis) and (antiphase octahedral tilts about pseudocubic [101]). In this framework we have demonstrated the proportionality of soft-mode frequency and order parameter. Furthermore we have shown that for rare-earth orthoferrites (and similar series) the change of the soft-mode frequency depends only on the size of the rare earth (for a fixed temperature). This work provides reference data for structural investigation of the orthoferrite RFeO3 family, and will be helpful in further studies of phenomena in orthoferrites including structural instabilities, possible ferroelectricity and multiferroicity, and rare-earth magnetism at low temperature via spin-phonon coupling.
Acknowledgements.
The authors thank R. Haumont (Universit Paris Sud), B. Dkhil (Université Paris Saclay) and W. Ren (Shanghai University), E. Queiros and P.B. Tavares (University of Trás-os-Montes e Alto Douro), and M. Mihalik jr., M. Mihalik, and M. Zentkova (Slovak Academy of Sciences) for providing high-quality samples. MCW, MG, HJZ, JI and JK acknowledge financial support from the Fond National de Recherche Luxembourg through a PEARL grant (FNR/P12/4853155/Kreisel). JMA and AA acknowledge for financial support through projects Norte-070124-FEDER-000070, UID/NAN/50024/2013, PTDC/FIS-NAN/0533/2012 and VEGA2/0132/16. RV thanks for financial support through the grant PD/BI/106014/2015 by FCT.References
- (1) R. L. White, Journal of Applied Physics 40, 1061 (1969).
- (2) R. M. White, R. J. Nemanich, and C. Herring, Physical Review B 25, 1822 (1982).
- (3) M. Eibschütz, S. Shtrikman, and D. Treves, Physical Review 156, 562 (1967).
- (4) H. J. Zhao, J. Íñiguez, X. M. Chen, and L. Bellaiche, Physical Review B 93, 014417 (2016).
- (5) S. Cao, H. Zhao, B. Kang, J. Zhang, and W. Ren, Scientific reports 4, 5960 (2014).
- (6) L. G. Marshall, J.-G. Cheng, J.-S. Zhou, J. B. Goodenough, J.-Q. Yan, and D. G. Mandrus, Physical Review B 86, 064417 (2012).
- (7) Y. Tokunaga, N. Furukawa, H. Sakai, Y. Taguchi, T.-h. Arima, and Y. Tokura, Nature materials 8, 558 (2009).
- (8) Y. Du, Z. X. Cheng, X. L. Wang, and S. X. Dou, Journal of Applied Physics 107, 09D908 (2010).
- (9) J.-H. Lee, Y. K. Jeong, J. H. Park, M.-A. Oak, H. M. Jang, J. Y. Son, and J. F. Scott, Physical Review Letters 107, 117201 (2011).
- (10) C.-Y. Kuo, Y. Drees, M. T. Fernández-Díaz, L. Zhao, L. Vasylechko, D. Sheptyakov, A. M. T. Bell, T. W. Pi, H.-J. Lin, M.-K. Wu, E. Pellegrin, S. M. Valvidares, Z. W. Li, P. Adler, A. Todorova, R. Küchler, A. Steppke, L. H. Tjeng, Z. Hu, and A. C. Komarek, Physical Review Letters 113, 217203 (2014).
- (11) Z. Cheng, F. Hong, Y. Wang, K. Ozawa, H. Fujii, H. Kimura, Y. Du, X. Wang, and S. Dou, ACS Applied Materials and Interfaces (2014).
- (12) P. Fleury, J. Scott, and J. Worlock, Physical Review Letters 21, 16 (1968).
- (13) J. Scott, R. Leite, and T. Damen, Physical Review 188, 1285 (1969).
- (14) J. F. Scott, Reviews of Modern Physics 46, 83 (1974).
- (15) M. Iliev, M. Abrashev, J. Laverdière, S. Jandl, M. Gospodinov, Y.-Q. Wang, and Y.-Y. Sun, Physical Review B 73, 3 (2006).
- (16) O. Chaix-Pluchery and J. Kreisel, Phase Transitions 84, 542 (2011).
- (17) M. C. Weber, J. Kreisel, P. A. Thomas, M. Newton, K. Sardar, and R. Walton, Physical Review B 85, 054303 (2012).
- (18) N. D. Todorov, M. V. Abrashev, and V. G. Ivanov, Journal of physics. Condensed matter : an Institute of Physics journal 24, 175404 (2012).
- (19) J. Laverdière, S. Jandl, A. Mukhin, V. Ivanov, and M. Iliev, Physical Review B 73, 214301 (2006).
- (20) W. S. Ferreira, J. Agostinho Moreira, A. Almeida, M. R. Chaves, J. P. Araújo, J. B. Oliveira, J. M. Machado Da Silva, M. A. Sá, T. M. Mendonça, P. Simeão Carvalho, J. Kreisel, J. L. Ribeiro, L. G. Vieira, P. B. Tavares, and S. Mendonça, Physical Review B 79, 054303 (2009).
- (21) J. A. Moreira, A. Almeida, W. S. Ferreira, J. E. Araújo, A. M. Pereira, M. R. Chaves, J. Kreisel, S. M. F. Vilela, and P. B. Tavares, Physical Review B 81, 054447 (2010).
- (22) V. S. Bhadram, B. Rajeswaran, A. Sundaresan, and C. Narayana, EPL (Europhysics Letters) 101, 17008 (2013).
- (23) M. El Amrani, M. Zaghrioui, V. Ta Phuoc, F. Gervais, and N. E. Massa, Journal of Magnetism and Magnetic Materials 361, 1 (2014).
- (24) D. A. Tenne, A. Bruchhausen, N. D. Lanzillotti-Kimura, A. Fainstein, R. S. Katiyar, A. Cantarero, A. Soukiassian, V. Vaithyanathan, J. H. Haeni, W. Tian, D. G. Schlom, K. J. Choi, D. M. Kim, C. B. Eom, H. P. Sun, X. Q. Pan, Y. L. Li, L. Q. Chen, Q. X. Jia, S. M. Nakhmanson, K. M. Rabe, and X. X. Xi, Science (New York, N.Y.) 313, 1614 (2006).
- (25) M. C. Weber, M. Guennou, N. Dix, D. Pesquera, F. Sánchez, G. Herranz, J. Fontcuberta, L. López-Conesa, S. Estradé, F. Peiró, J. Iñiguez, and J. Kreisel, 3, 1 (2016).
- (26) J. Kreisel, M. C. Weber, N. Dix, F. Sánchez, P. A. Thomas, and J. Fontcuberta, Advanced Functional Materials 22, 5044 (2012).
- (27) J. A. Moreira, A. Almeida, W. S. Ferreira, M. R. Chaves, J. B. Oliveira, J. M. M. da Silva, M. A. Sá, S. M. F. Vilela, and P. B. Tavares, Journal of Electroceramics 25, 203 (2010).
- (28) J. P. Perdew, A. Ruzsinszky, G. I. Csonka, O. A. Vydrov, G. E. Scuseria, L. A. Constantin, X. Zhou, and K. Burke, Physical Review Letters 100, 136406 (2008).
- (29) G. Kresse and J. Furthmüller, Physical Review B 54, 11169 (1996).
- (30) G. Kresse and D. Joubert, Physical Review B 59, 1758 (1999).
- (31) S. L. Dudarev, G. A. Botton, S. Y. Savrasov, C. J. Humphreys, and a. P. Sutton, Physical Review B 57, 1505 (1998).
- (32) P. E. Blöchl, Physical Review B 50, 17953 (1994).
- (33) A. M. Glazer, Acta Crystallographica Section B Structural Crystallography and Crystal Chemistry 28, 3384 (1972).
- (34) R. H. Mitchell, Perovskites: Modern and ancient, Almaz Press, Ontario, 2002.
- (35) H. D. Megaw, Crystal structures: A working approach, W.B. Saunders Co., Philadelphia PA, 1973.
- (36) Y. Zhao, D. J. Weidner, J. B. Parise, and D. E. Cox, Physics of the Earth and Planetary Interiors 76, 17 (1993).
- (37) R. D. Shannon, Acta Crystallographica A 32 (1976).
- (38) M. Marezio, J. P. Remeika, and P. D. Dernier, Acta Crystallographica Section B Structural Crystallography and Crystal Chemistry 26, 2008 (1970).
- (39) M. Marezio and P. Dernier, Materials Research Bulletin 6, 23 (1971).
- (40) E. Kroumova, M. Aroyo, J. Perez-Mato, A. Kirov, C. Capillas, S. Ivantchev, and H. Wondratschek, Phase Transitions 76, 155 (2003).
- (41) L. M. Daniels, M. C. Weber, M. R. Lees, M. Guennou, R. J. Kashtiban, J. Sloan, J. Kreisel, and R. I. Walton, Inorganic chemistry 52, 12161 (2013).
- (42) T. Damen, S. Porto, and B. Tell, Physical Review 142, 570 (1966).
- (43) M. Iliev, A. Litvinchuk, V. Hadjiev, Y.-Q. Wang, J. Cmaidalka, R.-L. Meng, Y.-Y. Sun, N. Kolev, and M. Abrashev, Physical Review B 74, 214301 (2006).
- (44) W. Hayes and R. Loudon, Scattering of Light by Crystals, John Wiley & Sons, New York, 1978.
- (45) J. Birman, Physics Letters A 45, 196 (1973).
- (46) T. Shigenari, Physics Letters A 46, 243 (1973).
- (47) S. Venugopalan and M. M. Becker, The Journal of Chemical Physics 93, 3833 (1990).
- (48) S. Venugopalan, M. Dutta, A. K. Ramdas, and J. P. Remeika, Physical Review B 31, 1490 (1985).
- (49) N. Koshizuka and S. Ushioda, Physical Review B 22, 5394 (1980).
- (50) M. K. Singh, H. M. Jang, H. C. Gupta, and R. S. Katiyar, Journal of Raman Spectroscopy 39, 842 (2008).
- (51) M. N. Iliev, M. V. Abrashev, J. Laverdière, S. Jandl, M. M. Gospodinov, Y.-Q. Wang, and Y.-Y. Sun, Physical Review B 73, 064302 (2006).
- (52) J.-S. Zhou and J. B. Goodenough, Physical Review Letters 94, 065501 (2005).