∎
33email: sandip.varkey@students.iiserpune.ac.in
33email: g.ambika@iiserpune.ac.in 44institutetext: R. Misra 55institutetext: Inter University Centre for Astronomy and Astrophysics, Ganeshkhind, Pune 411 007, India
55email: rmisra@iucaa.in
Detecting Dynamical States from Noisy Time Series using Bicoherence
Abstract
Deriving meaningful information from observational data is often restricted by many limiting factors, the most important of which is the presence of noise. In this work, we present the use of the bicoherence function to extract information about the underlying nonlinearity from noisy time series. We show that a system evolving in the presence of noise which has its dynamical state concealed from quantifiers like the power spectrum and correlation dimension D2, can be revealed using the bicoherence function. We define an index called main peak bicoherence function as the bicoherence associated with the maximal power spectral peak. We show that this index is extremely useful while dealing with quasi-periodic data as it can distinguish strange nonchaotic behavior from quasi-periodicity even with added noise. We demonstrate this in a real world scenario, by taking the bicoherence of variable stars showing period doubling and strange nonchaotic behavior. Our results indicate that bicoherence analysis can also bypass the method of surrogate analysis using Fourier phase randomization, used to differentiate linear stochastic processes from nonlinear ones, in conventional methods involving measures like D2.
Keywords:
Bicoherence main peak bicoherence noise limit-cycle quasi-periodicity strange nonchaotic dynamics variable stars1 Introduction
The presence of noise in real time series or data, is a problem that has been addressed frequently in recent times. Except in very limited circumstances, it is difficult to derive meaningful information about the underlying dynamics in such cases fra01 . Despite having no information about the underlying non-linearity in a times series, the power spectrum is used extensively in studying nonlinear dynamical systems. At the same time the use of polyspectra like bi and tri spectra to understand dynamical behavior is rather limited pez90 ; pez92 ; wan01 ; eva00 . Limitations posed by the power of the dominant nonlinearity and need for high computation speeds would perhaps partially explain the reason why the use of polyspectra has been less popular in analysis of dynamical systems.
Nonlinear dynamical systems can exhibit a rich variety of states like periodic, quasi-periodic, intermittently chaotic, strange nonchaotic and chaotic dynamics hil00 ; pra01 . The problem of studying these dynamical behaviors becomes more acute if the dynamical system is evolving in a noisy environment lon03 ; sch85 ; bas15 . The presence of noise also limits the useful information one can derive from observational data or time series and may cast doubts on the conclusions drawn from any standard analysis. This is especially true when trying to quantify nonlinearity in the system cas91 ; ser07 . Moreover, establishing non-linearity based on techniques like D2 and Lyapunov exponents can be very difficult in the presence of noise, especially if it is colored han95 ; osb89 ; yan11 . The hypothesis testing using Fourier phase randomized surrogates often helps to rule out false positives but gives no further information about the underlying dynamical behavior. In this paper we advocate the use of bispectrum based techniques to analyze such time series to understand the underlying dynamical properties.
Bispectral analysis of univariate time series is very popular due to the inherent advantages it offers. For instance it retains the phase information, unlike the power spectrum which is phase blind. Further it does not differentiate between the different kinds of mean zero symmetrically distributed noises, whether white or colored tot15 . Due to these inherent advantages it has been widely used in a variety of applications like in EEG analysis, damping identification, CMBR analysis, analysis of Chua circuit etc. gaj98 ; haj00 ; fer09 ; elg93 .
In this work, we define a quantity, the main peak bicoherence (), which is just the bicoherence function associated with the maximal frequency in the power spectrum. We initially show how all the peaks in the quasi-periodic and strange nonchaotic power spectra appear significantly in . We show how this function acts as a filter to pick out true peaks from a noisy time series either from dynamical systems or from observational data. This implies that Fourier phase randomized surrogate testing that is popularly used in conjunction with standard nonlinear quantifiers like correlation dimension and entropy to distinguish linear stochastic processes, can be bypassed when using bispectral analysis to detect nonlinearity.
We show in Section 2 that a dynamical system, like Rössler, evolving in the presence of noise in the limit cycle region has a power spectrum similar to the chaotic noiseless Rössler, and hence can give false conclusions. Also the doubly driven pendulum, with an additive colored noise process, in the quasi-periodic regime, can be misrepresented as being strange nonchaotic as shown in Section 3. We illustrate how the bicoherence function can be used to unravel the actual dynamical behavior even in such cases.
In this context, as an important application to real world data, we consider variable stars in Section 4, which is an area where modeling using a dynamical systems approach has been largely successful reg06 . Many nonlinear models have been developed, that describe the intensity variations in these stars bak79 ; ste86 . Nonlinear time series analysis techniques have been used to detect deterministic chaos in some of them buc95 ; geo15 . Recently availability of high quality light curves from the Kepler space telescope has led to heightened interest in variable star astrophysics, with fascinating results reported like the detection of period doubling in RRabc Lyrae stars and strange nonchaotic behavior in RRc Lyrae stars sza10 ; mos15 ; lin15 . We use the full bicoherence function and the main peak bicoherence function to analyze both these phenomena. Apart from testing our analysis in a real world setting, the bicoherence also reveals interesting features about the stars’ dynamics that wouldn’t be apparent from other analyzes.
The paper is organized as follows. In Section 2 we use the bicoherence function to analyze the noisy limit cycles of the Rössler system. In Section 3 we define a main peak bicoherence function. We use it to filter the power spectral scaling behavior of a quasi-periodic time series with colored noise and a strange nonchaotic time series. In Section 4 we apply these techniques to analyze the light curves of variable stars. Section 4.1 analyses light curves of stars in the period doubled state. Section 4.2 analyses light curves of strange nonchaotic stars. Section 5 summarizes the contents of the paper and lists the advantages and disadvantages of the methods described.
2 Analysis of Noisy Limit Cycles
We start by considering how limit cycle oscillations in the presence of noise can be identified using bicoherence. For this we revisit the basic definitions. The bispectrum is defined as the Fourier transform of the three-point auto correlation function. This can be equivalently written as
| (1) |
where A(f) is the Fourier transform of the signal at frequency, f and A∗(f) is its complex conjugate tot15 ; rao12 For k segments of the time series, the normalized bispectrum (or bicoherence) is defined as
| (2) |
It is clear that the bicoherence function takes values between zero and one hay07 .
Due to the inherent symmetries, the bicoherence function of a real valued process can be completely defined in the triangular region given by tot15
| (3) |
where is the Nyquist frequency (or half of the sampling rate) of the time series pre07 .
As a standard nonlinear dynamical system in the periodic limit cycle regime, we study the Rössler equations evolving in the presence of noise. The equations are given by
| (4) | ||||
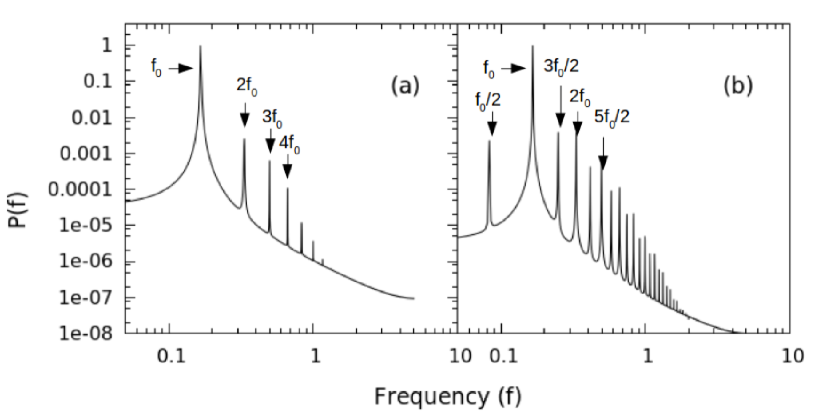
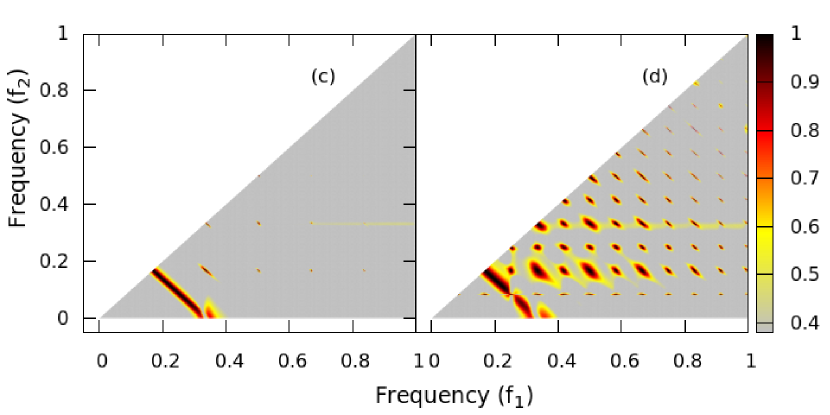
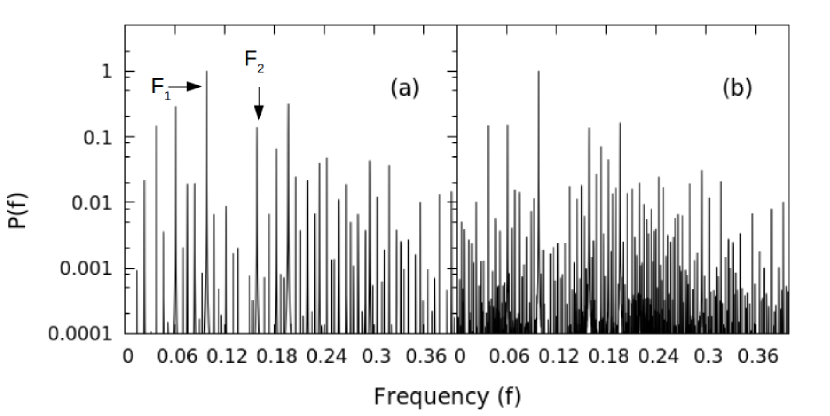
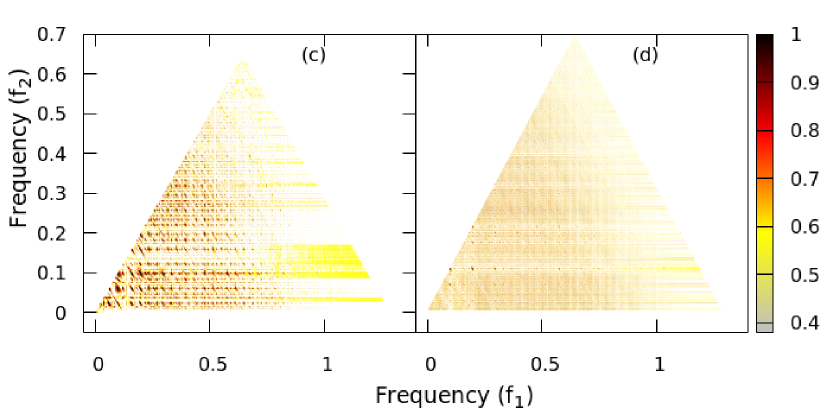
where a=0.1, b=0.1, c is varied for the regime under consideration and (t) is -correlated mean zero Gaussian white noise with the standard deviation set at 2.0 for periodic region(c=4, period 1 and c=6.2, period 2) and at 5.0 for chaotic regime (c=18). By integrating the system using the fourth order Runge Kutta algorithm for 217 time steps, we compute the power spectrum of the time series of the x variable for all the cases, by dividing it into 32 segments. For comparison, we also consider the power spectrum for period 1 and period 2 limit cycles of Rössler in the absence of noise in Figures 1 a and b. For this case bicoherence planes have already been reported earlier in literature but added here for completion in Figures 1 c and d pez90 . The islands of high bicoherence and straight lines are artifacts of finite widths of peaks because of the finite size of data. The bicoherence is only plotted for values above a 99 significance level, given by cha93 .
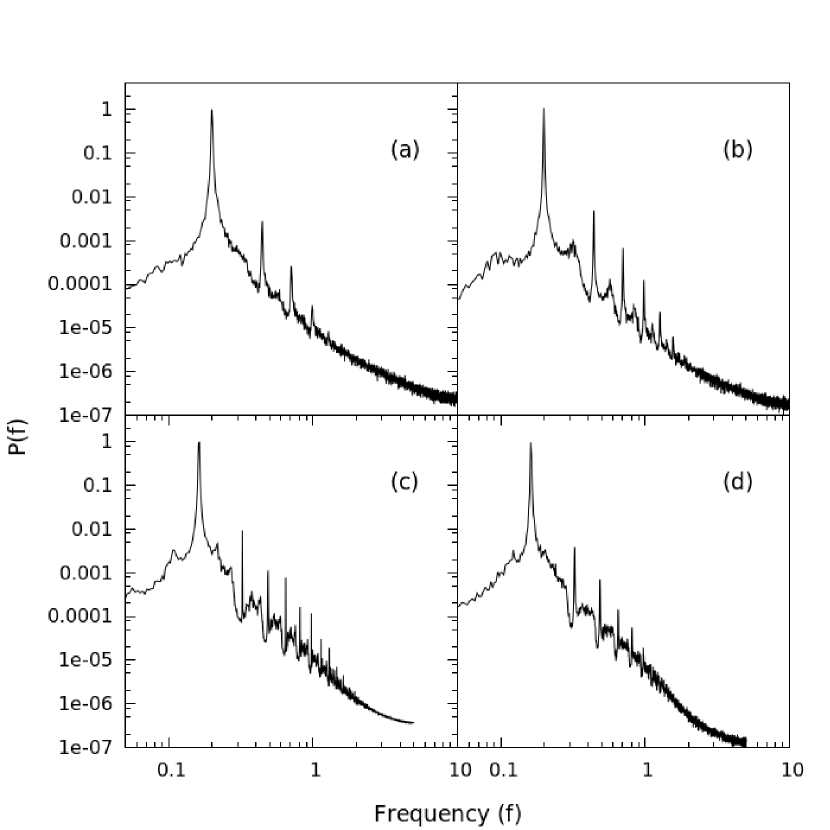
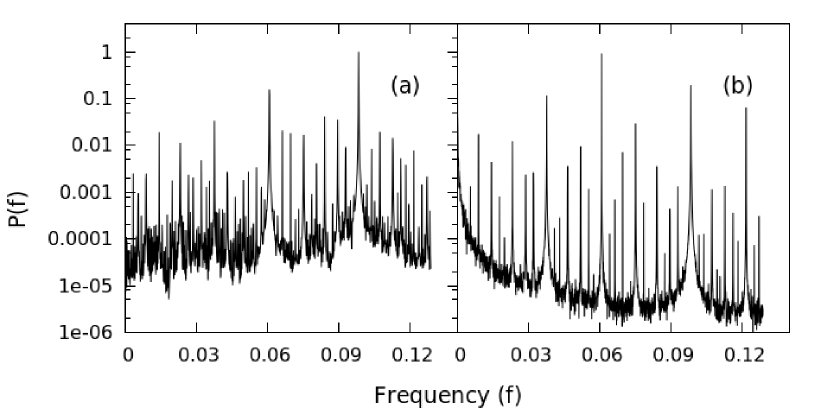
Unlike the power spectra for the noiseless Rössler limit cycles in Figure 1, the Rössler limit cycles evolved in the presence of noise, shows a continuum inter-peak power in Figures 2a and b. This continuum inter-peak power is the signature of chaotic behavior, as is evident from the spectrum of the noise free chaotic Rössler shown in Figure 2c. Further the fine features of the power spectrum of chaotic Rössler is lost when evolved with background noise as can be seen from Figure 2d. In this case, the power spectrum becomes increasingly similar to the noisy limit cycle power spectrum. Inferring whether the continuum inter-peak power is due to noise or chaos or a combination of both, is essential to deciphering the underlying dynamical behavior exhibited by the system and hence an important step in modeling it. We point out that without an a priori knowledge of the system, this is not apparent from the power spectrum alone.
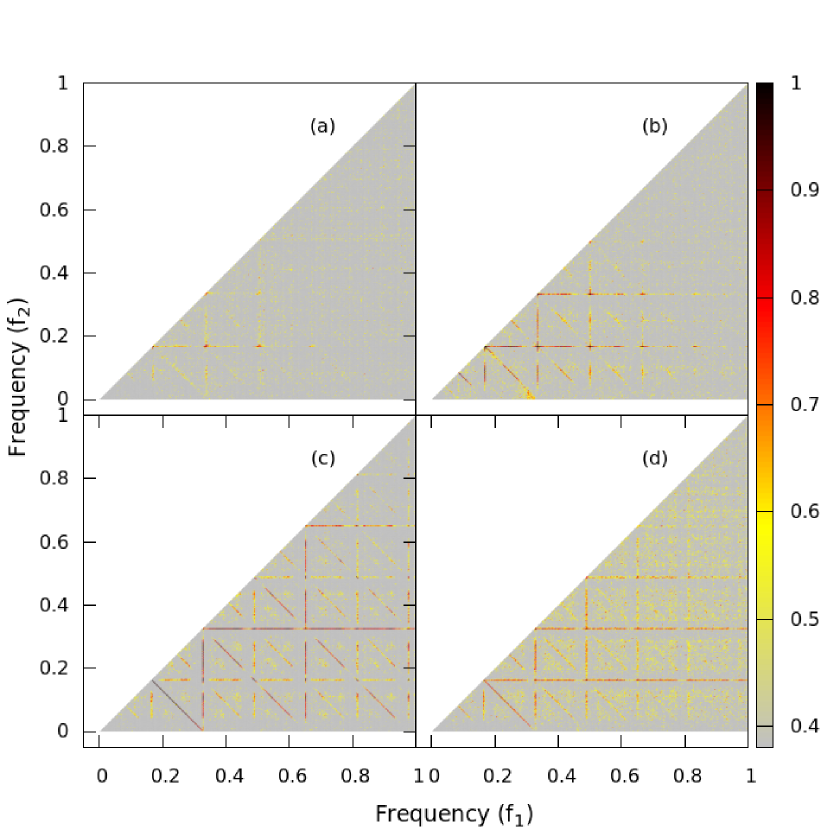
We present the bicoherence for all the above cases in Figure 3. As in Figure 1 the relevant part of the bicoherence plane is only up to around 1 Hz. Hence we zoom into this region in Figure 3. The bicoherence can see through the noise contamination that affects standard quantifiers and significant values of bicoherence can be seen only for the primary frequency and its harmonics in Figures 3a and b. The underlying limit cycle behavior can hence be clearly identified. The noiseless chaotic behavior remains distinctly different from the noisy limit cycle behavior in Figure 3. Moreover, the background noise contamination in the chaotic Rössler leaves the bicoherence function broadly unaffected.
3 Main Peak Bicoherence Function and Quasi-periodicity
Quasi-periodicity occurs in dynamical systems when there are two incommensurate frequencies and in the system. Then peaks at and and all the linear combinations of and are present in the corresponding power spectrum lak12 . From the definition of the bicoherence function (equation 2), we see that these peaks would result in a significant bicoherence at (,) and (,). Since all the major peaks in this case would come from the linear combinations of the two main frequencies, we introduce an index called main peak bicoherence function () defined as
| (5) |
where is the maximal peak in the power spectrum. Such quasi-periodic forcing in nonlinear systems can also lead to strange nonchaotic behavior pra01 . Systems exhibiting strange nonchaotic behavior have an attractor with fractal geometry but no exponential divergence of nearby trajectories, giving the peculiar combination of a non integer fractal dimension but a non positive maximal Lyapunov exponent. As mentioned earlier, in real data, effects like noise affect both these quantifiers han95 ; har09 .
To demonstrate both quasi-periodic and strange nonchaotic behaviors, we consider the standard system of a quasi-periodically forced pendulum, whose equations are given by,
| (6) |
where
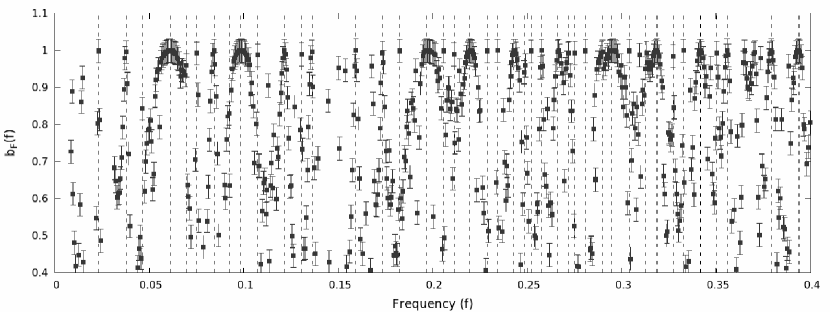
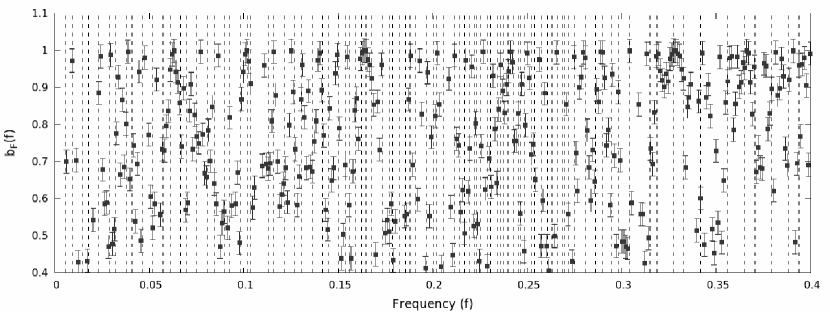
In this system quasi-periodicity is achieved for values =1.34, =0.55, =3.0, =2= and =2 =1.0 , and strange non chaotic behavior is achieved by changing to 1.33 rom87 . We integrate the system for time-steps in both regimes. The computed power spectrum of the time series of the variable signal(where ) and its full bicoherence graphs in the quasi-periodic and strange nonchaotic regimes, calculated for 32 segments of 16384 points, are shown in Figure 4. The two dynamical states are easily distinguishable both in power spectrum and bicoherence. We plot the corresponding vs in Figure 5(a). All the main peaks in the power spectrum also appear in . The vertical lines correspond to main peaks in the power spectrum (above .001). Figure 5(b) also shows that all the main peaks in the strange nonchaotic power spectrum also have significant bicoherence. The standard deviation on the bicoherence estimated from different Fourier transforms is mac02 .
3.1 Spectral scaling with bicoherence filter
One of the more popular methods to identify strange nonchaotic behavior in real data has been the spectral scaling of peaks in the power spectrum lin15 . This is done by resampling the time series at a time step equal to its primary period (strobing), followed by calculating its power spectrum (which is equivalent to taking a Poincare section of the data). The threshold power is then increased in steps and the number of peaks above that threshold is counted, in the power spectrum. This scaling of this number is shown to follow a power law, if the system exhibits strange nonchaotic behavior hea91 . We find however, that if we have a quasi-periodically forced system, that has an added colored noise process, the spectral scaling of peaks in the power spectrum of the Poincare section in the quasi-periodic region is similar to the scaling exhibited by the noise-free strange nonchaotic power spectrum.
To demonstrate this we add red noise with signal to noise ratio(ratio of standard deviations of signal to noise), 1.15 to the time series obtained from system.The time step for evolution is chosen as one tenth of the primary frequency, (). We strobe the variable signal(where ), along by picking every 10th point and then compute the power spectrum by dividing the time series into 32 segments. The power spectrum so computed is shown for all three cases in Figure 6. The scaling of the peaks is then calculated with increasing threshold power, after logarithmic binning to reduce statistical errors in the tail new05 . Here we define a peak as a local maximum in the power spectrum. This definition helps avoid coefficients that arise due to finite peak widths of the FFT. The log plots of number of peaks vs threshold power for the pendulum in the strange nonchaotic regime evolved in a noiseless environment and in the quasi-periodic regime with added red noise environment are shown in Figure 7. Since the total number of peaks in the strobed noiseless quasi-periodic spectrum is rather small, the scaling remains distinctly different from these two cases, and is not shown here rom87 . The scaling behavior for both noisy quasi-periodic and strange nonchaotic behaviors is similar. If one is to rely solely on spectral scaling without any a priori knowledge of the system, one could be mistaken into believing that the noisy quasi-periodic data is derived from a strange nonchaotic state.

We introduce a method of analysis using the main peak bicoherence defined above to detect the dynamics in such cases and check how many of these peaks are real. One of the main issues we see in using the previous definition of the main peak bicoherence function in this case, is the low Nyquist frequency of the strobed data. Hence if is the Nyquist frequency after strobing, and is the main peak in the power spectrum, we can only check for bicoherence upto -. This is not a problem for non strobed data, as most of the relevant frequencies lies below -. The main peak bicoherence function has significant values only for peaks of dynamical origin. We exploit this observation to filter the spectral scaling performed previously. In this filtering technique, we first count the number of peaks above a certain threshold. We then check how many of these peaks have a significant bicoherence. In cases where, + is greater than , we instead look for the significance of . We check the scaling behavior of this filtered number of peaks that have significant bicoherence values above the threshold. Then we see that the noisy quasi-periodic power spectrum shows a distinctly different scaling, where as the strange nonchaotic power spectrum continues to give the same scaling behavior. This is shown in Figure 8. The filter reduces the total number of peaks in the noisy quasi-periodic power spectrum, by a factor more than 7. The bicoherence filter hence removes the ambiguity between noise contaminated quasi-periodic behavior and strange nonchaotic behavior.
We note that this technique is useful in deciphering hidden quasi-periodicity in the presence of additive white noise and when the system evolves in the presence of noise. The scaling with additive white noise is distinctly different from the scaling in the strange nonchaotic state. When the system evolves with noise, the power spectrum changes according to the equations of the system. In both cases however one can confirm the true scaling by applying a bicoherence filter.
4 Bicoherence Analysis of Variable Stars
Nonlinear analysis has been used extensively in understanding the behavior of astrophysical objects mis06 ; zot13 . In this section we illustrate how the bicoherence techniques discussed above can be applied to understand the dynamical behavior of variable stars. We consider stars whose dynamical behavior has been analyzed in previous works using conventional methods sza10 ; lin15 . We concentrate on RRab Lyrae stars reported in the period doubled state and RRc Lyrae stars in strange nonchaotic state. Primarily we test our methods of analysis given in the previous sections in real world data. Second, we try to resolve the ambiguity between noisy quasi-periodic and strange nonchaotic behaviors by applying the filtering method suggested in Section 3. Finally, we look forward to the new information supplied by the bicoherence function about the coupling between the different modes of the star. In the light of our analysis in Sections 2 and 3 it becomes important to analyze the bicoherence function to determine if the peaks in a power spectrum are of stochastic or dynamical origin which is imperative in the context of modeling these stars.
4.1 Stars in Period Doubled States
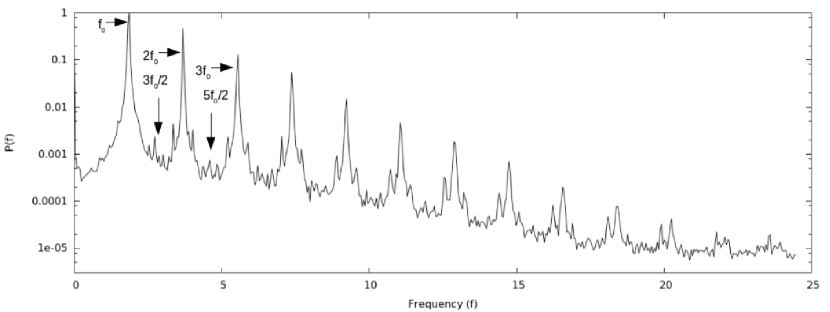
We initially present the analysis of the light curve of RRab Lyrae star KIC 4484128. Due to gaps in the data, we consider segments of continuous data, find the power spectrum and average over the different segments. We use 22 segments of 1024 points each, sampled at .0204 days. (The frequency units are in day-1.) The power spectrum (Figure 9) shows peaks at the main frequency, 1.87 day-1 and its integral multiples. The peak at half of the primary is overshadowed by the width the primary peak but the power spectrum shows peaks at 1.5 and 2.5 times the primary. It is hence evident that the star has undergone more than one period doubling bifurcation. Further we also see many other minor peaks in the power spectrum. As we mentioned in Section 2 one can find out if the minor peaks in the power spectrum are dynamically relevant only by a bicoherence analysis. This would help check if the less important peaks in the power spectrum are quadratically phase coupled.
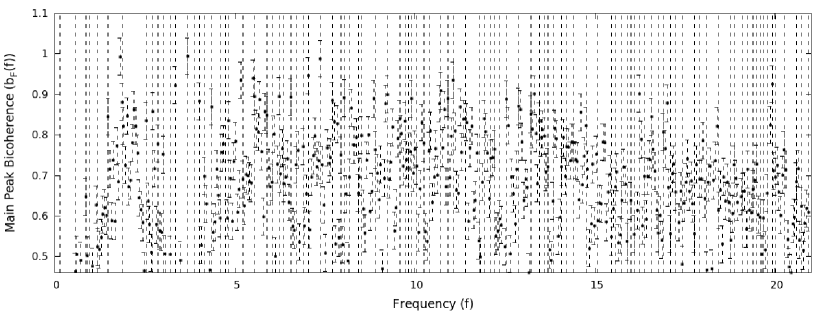
Our aim is to establish if the inter-peak continuum in the power spectrum is relevant to the dynamics of the star or is indicative of some stochasticity in the system. For this we present the main peak bicoherence in Figure 10. It has a large number of frequencies showing significant main peak bicoherence, suggesting that the minor peaks in the power spectrum are also of dynamical origin. The full bicoherence plane of the star, is shown in Figure 11. We see high bicoherence at a large number of frequency pairs, in addition to period doubled ones. This suggests that KIC 4484128 is on the period doubling route to chaos. Similar analysis for RR Lyrae star KIC 7505345 yields qualitatively similar results. These stars hence have richer dynamics beyond the limit cycle behavior that can be confirmed as chaos using additional tests from fractal dimension calculations.
4.2 Stars in strange nonchaotic state
In this section, we look at the bicoherence function for two RRc Lyrae stars reported as having strange nonchaotic dynamics, namely KIC 4064484 and KIC 5520878 lin15 . In the light of our discussion in Section 3, power law scaling alone does not guarantee strange nonchaotic dynamics. However using a bicoherence filter does successfully pick out true scaling behavior. Hence, we attempt to validate strange nonchaotic behavior in these stars, by looking at the main peak bicoherence function and subsequently re-validate the scaling behavior if need be. We mainly rely on the observation that power law scaling is observed for these stars even without strobing lin16 . We try to reproduce this power law scaling without a bicoherence filter. We restrain ourselves from strobing the data, as this would require interpolating between the different continuous segments. Earlier works suggest that interpolation may affect nonlinear quantification adversely geo15 .
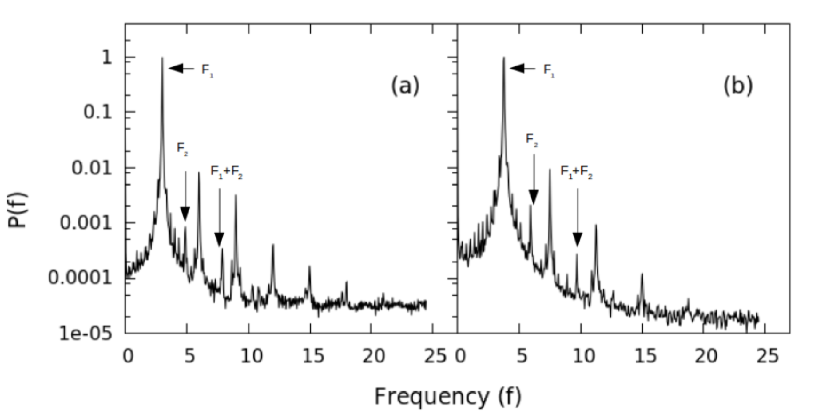
The power spectra for the stars are given in Figure 12. We see typical quasi-periodic behavior with peaks at the primary frequencies and their linear combinations. The primary and secondary peaks for KIC 4064484 are at 3.02 day-1 and 4.88 day-1; and are at 3.78 day-1 and 5.94 day-1 for KIC 5520878. The inter-peak continuum, can be indicative of dynamical noise, measurement noise, chaotic or strange nonchaotic behavior.
To distinguish between these possibilities, we take the main peak bicoherence of all four stars. This is shown in Figure 13.
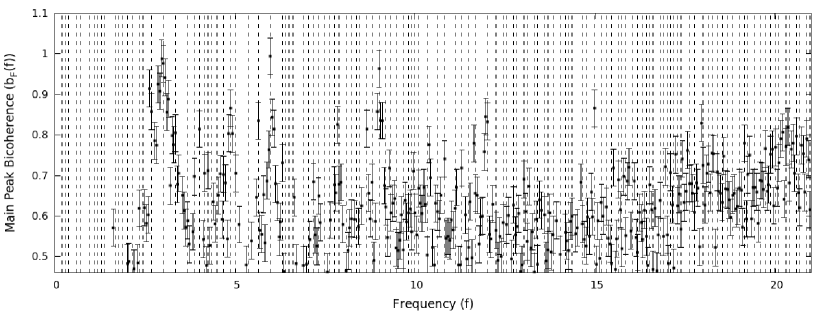
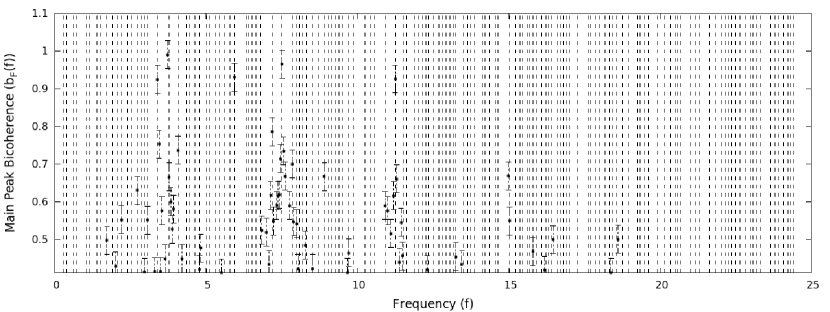
We see that there is a significant bicoherence for the stars KIC 4064484 for a large number of frequencies implying that even the minor peaks in the power spectrum are due to the dynamics of the underlying equations. It seem likely, therefore that it is indeed strange nonchaotic. We will consider the spectral scaling with a bicoherence filter to confirm this. For KIC 5520878 there is no significant bicoherence for the inter-peak continuum. Hence we may conclude that these peaks are not quadratically phase coupled to each other. The peaks may be due to the dynamical behavior of the underlying equations with a higher order coupling, or due to stochasticity present in the system or at the measurement end. For a preliminary test of the former, we consider the the tricoherence section at the primary frequency. No significant tricoherence was identified at the primary frequency, implying perhaps the minor peaks may indeed be of stochastic origin.
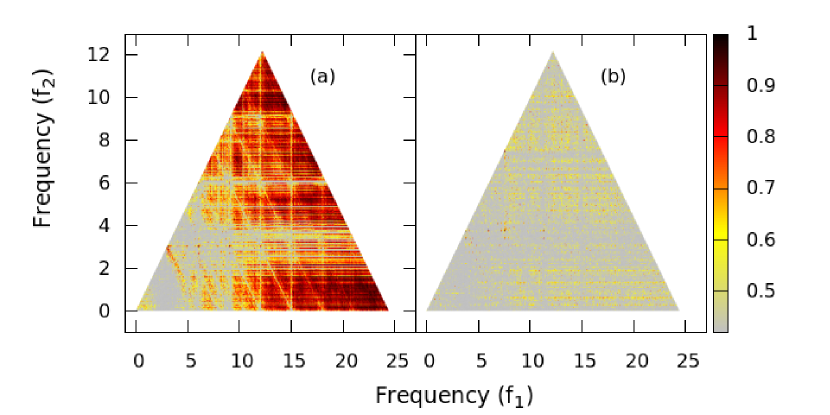
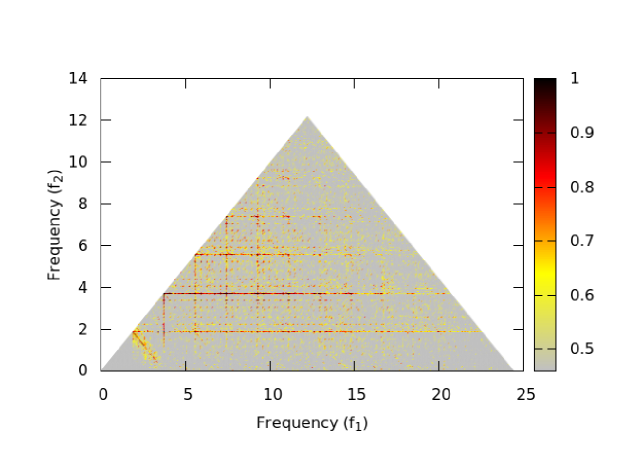
We then look at the full bicoherence plane to confirm whether there exists other frequencies that are quadratically coupled to each other. The full bicoherence planes for both stars are shown in Figure 14. We find that as we deciphered from the main peak bicoherence function, the minor peaks of KIC 5520878 are not quadratically coupled to each other.
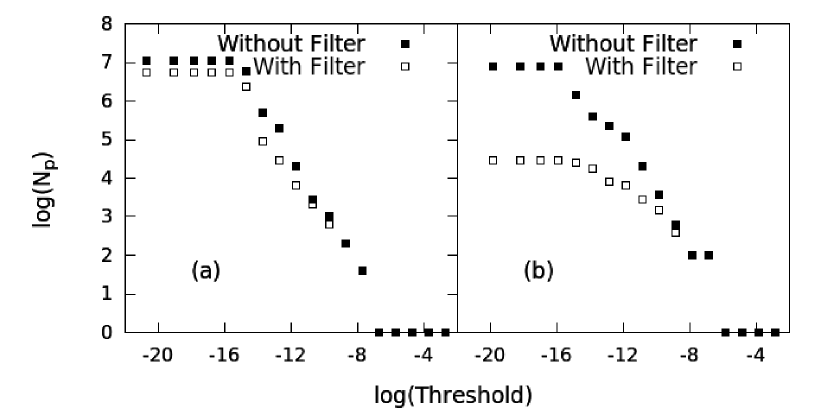
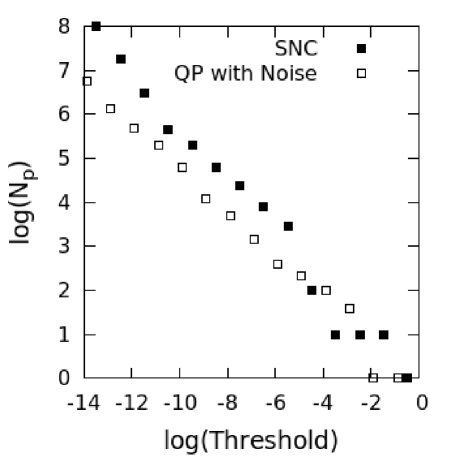
We now proceed to check how the scaling behavior for KIC 4064484 and KIC 5520878 change after the bicoherence filter is applied. This is shown in Figure 15.We see that the scaling behavior for KIC 4064484 is identical with and without the bicoherence filter, confirming that the peaks with significant bicoherence too have a power law like behavior. As expected, the scaling behavior for KIC 5520878 shows a marked change when the bicoherence filter is applied. This is shown in Figure 15. The persistent power law behavior in KIC 4064484 is indicative of strange nonchaotic behavior, as suggested by Linder et al. lin15 ; lin16 . Similar analysis was also conducted on the stars KIC 8832417 and KIC 9453114, reported as exhibiting strange nonchaotic behavior lin15 . The former showed bicoherence similar to KIC 5520878, while the latter showed bicoherence and bicoherence filtered spectral scaling similar to KIC 4064484, suggesting strange nonchaotic behavior. Thus we conclude from our analysis that the underlying dynamics of the stars KIC 4064484 and KIC 9453114 differ from KIC 5520878 and KIC 8832417.
5 Conclusions and Summary
We illustrate how the bicoherence function can be used to our advantage, for understanding the underlying dynamics of a system, especially in the presence of noise. The work presented is a study on the possibilities and methods of applying bicoherence function. We take the cases of limit cycle Rössler, chaotic Rössler, quasi-periodic driven pendulum and strange nonchaotic driven pendulum, as examples of standard systems to illustrate this. We also define the main peak bicoherence function and demonstrate its use as a quantifying technique for the latter two dynamical behaviors.
In general for detecting the underlying dynamics of a system from which the time series was derived, we often rely on a battery of tests, starting from linear quantifiers like the auto-correlation and power spectrum, to non-linear quantifiers like and multifractal spectrum. We advocate that this list is incomplete without the addition of the bicoherence function. We show that even when the system evolves in a stochastic background the bicoherence function picks out the related frequencies. This is especially useful in modeling a system, because the dynamical and stochastic parts are clearly distinguishable using the bicoherence function. In this context we claim that this method can bypass the conventional hypothesis testing using Fourier phase randomized surrogates, derived from data.
We also consider other dynamical states, like quasi-periodic and strange nonchaotic behaviors. Here we argue that the property of quasi-periodic systems to have peaks at linear combinations of the fundamental frequencies makes the bicoherence function a natural choice to examine them. We observe that the main peak bicoherence function will contain all the peaks that are present in the power spectrum. This is especially useful in the context of noise, when quantifiers like spectral scaling cannot clearly tell whether the data has been derived from a strange nonchaotic system or simply a noisy quasi-periodic one. In a real life scenario it is important to understand if the peaks in the power spectrum are indicative of chaotic or strange nonchaotic dynamics, or merely as a result of dynamical or measurement noise. We propose and successfully demonstrate the use of a bicoherence filter to pick out the true peaks in the power spectrum in the presence of noise, for the quasi-periodically forced pendulum.
As a useful and relevant application and to test our method on a real data set, we apply these techniques to the case of variable stars where period doubling and strange nonchaotic behavior were reported recently. We find the two stars KIC 4484128 and KIC 7505345, reported to have period doubling, exhibit many other frequencies that are of dynamical origin mos15 . This perhaps indicates that these stars are well into their period doubling route to chaos. We also consider the bicoherence for the reported strange nonchaotic stars KIC 4064484, KIC 5520878, KIC 8832417 and KIC 9453114 lin15 . We confirm that the peaks in the power spectrum are indeed of non stochastic origin for KIC 4064484 and KIC 9453114. The scaling behaviors for these stars persist even after we apply a bicoherence filter, thus confirming their strange nonchaotic behavior. KIC 5520878 and KIC 8832417 however, show no significant bicoherence for the peaks in between the main peaks, and the scaling behavior changes drastically when a bicoherence filter is applied. Hence we can conclude that their underlying dynamics is quasiperiodic in origin.
While the advantages of the bicoherence function in detecting the underlying non-linearity has been elaborated in the paper, it is imperative to note its limitations. The biggest, comes in the form the power of the dominant nonlinearity. It is well known that the bicoherence function will not characterize the system, if the power of the dominant nonlinearity is above 2. One can easily observe that if the power of the dominant nonlinearity is odd, the bicoherence function will be similar to that of noise. In such cases one has to look for higher order polyspectra like the trispectrum to characterize the system cha93 . Also the length of data required for a reliable estimate of the bicoherence function, is fairly large tot15 . Hence a bispectral analysis becomes impractical in cases where only short datasets are available. Further, the finite width of the peaks causes spread out regions of high bicoherence in the bicoherence plane. Another important drawback is the presence of data gaps in real-world data, which is known to have an adverse effect on the fast Fourier transform, while leaving quantifiers like D2 largely unaffected geo15 ; mun16 . This in turn would greatly affect the calculation of the bicoherence. These practical limitations might have contributed to the relative unpopularity of the bicoherence function among dynamical systems’ enthusiasts in the past. However, we have shown that the advantages offered by the bicoherence function far outweighs these issues, and should find its way into the pantheon of tests used to quantify chaos and nonlinearity in dynamical systems.
References
- (1) Baker, N., Gough, D.: Pulsations of model RR Lyrae stars. The Astrophysical Journal 234, 232–244 (1979)
- (2) Bashkirtseva, I., Ryashko, L., Slepukhina, E.: Order and chaos in the stochastic hindmarsh–rose model of the neuron bursting. Nonlinear Dynamics 82(1), 919–932 (2015). DOI 10.1007/s11071-015-2206-y.
- (3) Buchler, J.R., Serre, T., Kolláth, Z., Mattei, J.: A chaotic pulsating star: The case of R Scuti. Physical Review Letters 74(6), 842 (1995)
- (4) Casdagli, M., Eubank, S., Farmer, J.D., Gibson, J.: State space reconstruction in the presence of noise. Physica D: Nonlinear Phenomena 51(1), 52–98 (1991)
- (5) Chandran, V., Elgar, S., Pezeshki, C.: Bispectral and trispectral characterization of transition to chaos in the Duffing oscillator. International Journal of Bifurcation and Chaos 3(03), 551–557 (1993)
- (6) Elgar, S., Kennedy, M.P.: Bispectral analysis of Chua’s circuit. Journal of Circuits, Systems, and Computers 3(01), 33–48 (1993)
- (7) Evans, A.K., Nimmo, S.J., London, M.D.: Bispectra and Phase Correlations for Chaotic Dynamical Systems. Tech. rep., DTIC Document (2000)
- (8) Fergusson, J., Shellard, E.: Shape of primordial non-Gaussianity and the CMB bispectrum. Physical Review D 80(4), 043,510 (2009)
- (9) Franca, L.F.P., Savi, M.A.: Distinguishing periodic and chaotic time series obtained from an experimental nonlinear pendulum. Nonlinear Dynamics 26(3), 255–273 (2001). DOI 10.1023/A:1013029607482.
- (10) Gajraj, R., Doi, M., Mantzaridis, H., Kenny, G.: Analysis of the EEG bispectrum, auditory evoked potentials and the EEG power spectrum during repeated transitions from consciousness to unconsciousness. British Journal of Anaesthesia 80(1), 46–52 (1998)
- (11) George, S.V., Ambika, G., Misra, R.: Effect of data gaps on correlation dimension computed from light curves of variable stars. Astrophysics and Space Science 360(1), 1–11 (2015)
- (12) Hajj, M.R., Fung, J., Nayfeh, A.H., Fahey, S.O.: Damping identification using perturbation techniques and higher-order spectra. Nonlinear Dynamics 23(2), 189–203 (2000). DOI 10.1023/A:1008335522973.
- (13) Hanggi, P., Jung, P.: Colored noise in dynamical systems. Advances in Chemical Physics 89, 239–326 (1995)
- (14) Harikrishnan, K., Misra, R., Ambika, G.: Combined use of correlation dimension and entropy as discriminating measures for time series analysis. Communications in Nonlinear Science and Numerical Simulation 14(9), 3608–3614 (2009)
- (15) Hayashi, K., Tsuda, N., Sawa, T., Hagihira, S.: Ketamine increases the frequency of electroencephalographic bicoherence peak on the spindle area induced with propofol. British Journal of Anaesthesia 99(3), 389–395 (2007)
- (16) Heagy, J., Ditto, W.: Dynamics of a two-frequency parametrically driven Duffing oscillator. Journal of Nonlinear Science 1(4), 423–455 (1991)
- (17) Hilborn, Robert C: Chaos and nonlinear dynamics: an introduction for scientists and engineers. Oxford University Press (2000)
- (18) Lakshmanan, M., Rajaseekar, S.: Nonlinear dynamics: integrability, chaos and patterns. Springer Science & Business Media (2012)
- (19) Lindner, John F and Kohar, Vivek and Kia, Behnam and Hippke, Michael and Learned, John G and Ditto, William L: Strange nonchaotic stars. Physical Review Letters 114(5), 054,101 (2015)
- (20) Lindner, John F and Kohar, Vivek and Kia, Behnam and Hippke, Michael and Learned, John G and Ditto, William L: Simple nonlinear models suggest variable star universality. Physica D: Nonlinear Phenomena 316, 16–22 (2016)
- (21) Longtin, A.: Effects of noise on nonlinear dynamics. In: Nonlinear Dynamics in Physiology and Medicine, pp. 149–189. Springer (2003)
- (22) Maccarone, T.J., Coppi, P.S.: Higher order variability properties of accreting black holes. Monthly Notices of the Royal Astronomical Society 336(3), 817–825 (2002)
- (23) Misra, R., Harikrishnan, K., Ambika, G., Kembhavi, A.: The nonlinear behavior of the black hole system grs 1915+ 105. The Astrophysical Journal 643(2), 1114 (2006)
- (24) Moskalik, P., Smolec, R., Kolenberg, K., Molnár, L., Kurtz, D.W., Szabó, R., Benkő, J.M., Nemec, J.M., Chadid, M., Guggenberger, E., Ngeow, C.C., Jeon, Y.B., Kopacki, G., Kanbur, S.M.: Kepler photometry of rrc stars: peculiar double-mode pulsations and period doubling. Monthly Notices of the Royal Astronomical Society 447(3), 2348–2366 (2015). DOI 10.1093/mnras/stu2561.
- (25) Munteanu, C., Negrea, C., Echim, M., Mursula, K.: Effect of data gaps: comparison of different spectral analysis methods. Ann. Geophys 34, 437–449 (2016)
- (26) Newman, M.E.J.: Power laws, Pareto distributions and Zipf’s law. Contemporary Physics 46(5), 323–351 (2005)
- (27) Osborne, A.R., Provenzale, A.: Finite correlation dimension for stochastic systems with power-law spectra. Physica D: Nonlinear Phenomena 35(3), 357–381 (1989)
- (28) Pezeshki, C., Elgar, S., Krishna, R.: Bispectral analysis of systems possessing chaotic motion. Journal of Sound and Vibration 137(3), 357–368 (1990)
- (29) Pezeshki, C., Elgar, S., Krishna, R., Burton, T.: Auto and cross-bispectral analysis of a system of two coupled oscillators with quadratic nonlinearities possessing chaotic motion. Journal of Applied Mechanics 59(3), 657–663 (1992)
- (30) Prasad, A., Negi, S.S., Ramaswamy, R.: Strange nonchaotic attractors. International Journal of Bifurcation and Chaos 11(02), 291–309 (2001)
- (31) Press, W.H.: Numerical recipes 3rd edition: The art of scientific computing. Cambridge university press (2007)
- (32) Rao, T.S., Gabr, M.: An introduction to bispectral analysis and bilinear time series models, vol. 24. Springer Science & Business Media (2012)
- (33) Regev, O.: Chaos and complexity in astrophysics. Cambridge University Press (2006)
- (34) Romeiras, F.J., Ott, E.: Strange nonchaotic attractors of the damped pendulum with quasiperiodic forcing. Physical Review A 35(10), 4404 (1987)
- (35) Schimansky-Geier, L., Tolstopjatenko, A., Ebelin, W.: Noise induced transitions due to external additive noise. Physics Letters A 108(7), 329–332 (1985)
- (36) Serletis, A., Shahmoradi, A., Serletis, D.: Effect of noise on estimation of Lyapunov exponents from a time series. Chaos, Solitons & Fractals 32(2), 883–887 (2007)
- (37) Stellingwerf, R.: A simple model for coupled convection and pulsation. The Astrophysical Journal 303, 119–129 (1986)
- (38) Szabó, R., Kolláth, Z., Molnár, L., Kolenberg, K., Kurtz, D., Bryson, S., Benkő, J., Christensen-Dalsgaard, J., Kjeldsen, H., Borucki, W.J., et al.: Does Kepler unveil the mystery of the Blazhko effect? First detection of period doubling in Kepler Blazhko RR Lyrae stars. Monthly Notices of the Royal Astronomical Society 409(3), 1244–1252 (2010)
- (39) Totsky, A.V., Zelensky, A.A., Kravchenko, V.F.: Bispectral methods of signal processing: applications in Radar, telecommunications and digital image restoration. Walter de Gruyter GmbH & Co KG (2015)
- (40) Wang, W.J., Wu, Z.T., Chen, J.: Fault identification in rotating machinery using the correlation dimension and bispectra. Nonlinear Dynamics 25(4), 383–393 (2001). DOI 10.1023/A:1012985802317.
- (41) Yang, C., Wu, C.Q.: A robust method on estimation of lyapunov exponents from a noisy time series. Nonlinear Dynamics 64(3), 279–292 (2011). DOI 10.1007/s11071-010-9860-x.
- (42) Zotos, E.E.: Exploring the origin, the nature, and the dynamical behavior of distant stars in galaxy models. Nonlinear Dynamics 74(3), 831–847 (2013). DOI 10.1007/s11071-013-1008-3.