Phosphorus-bearing molecules in solar-type star forming regions: First PO detection.
Abstract
As part of the Large Program ASAI (Astrochemical Surveys At IRAM), we have used the IRAM 30m telescope to lead a systematic search for the emission of rotational transitions of P-bearing species between 80 and 350 GHz towards L1157-B1, a shock position in the solar-type star forming region L1157. We report the detection of several transitions of PN and, for the first time, of prebiotic molecule PO. None of these species are detected towards the driving protostar of the outflow L1157-mm. Analysis of the line profiles shows that PN arises from the outflow cavity, where SiO, a strong shock tracer, is produced. Radiative transfer analysis yields an abundance of and for PO and PN, respectively. These results imply a strong depletion () of Phosphorus in the quiescent cloud gas. Shock modelling shows that atomic N plays a major role in the chemistry of PO and PN. The relative abundance of PO and PN brings constraints both on the duration of the pre-shock phase, which has to be , and on the shock parameters. The maximum temperature in the shock has to be larger than , which implies a shock velocity of .
keywords:
physical data and processes: astrochemistry – ISM: jets and outflows-molecules-abundances – Stars:formation1 Introduction
Despite a rather low elemental abundance of (Asplund et al. 2009), Phosphorus is one of the main biogenic elements, present in all life forms on Earth. As such, phosphorus-bearing compounds, in particular their P–O bonds, play a key role in many biochemical and metabolic processes in living systems (see e.g. Macía et al. 2005 for a review). In our Solar System, the presence of Phosphorus has been recently reported in comet 67P/Churyumov-Gerasimeno (Altwegg et al. 2016), although the nature of the actual carriers remain to be identified. Phosphorus-bearing compounds appear to be rather ubiquitous in meteorites (Macía et al. 2005).
A theoretical study by Thorne et al. (1984) based on laboratory experiments predicted that Phosphorus monoxyde PO should be the most abundant P-bearing molecule in molecular clouds, hence the main reservoir of phosphorus in the gas phase. Phosphorus monoxyde PO was detected for the first time by Tenenbaum et al. (2007) towards the evolved star VY Cma. The P-bearing species HCP, PH3, CP, CCP radicals, PO, and PN have been identified around evolved stars IRC+10216 (see e.g. Agundez et al. 2007 for a review) and IK Tau (De Beck et al. 2013). PO was found as abundant as PN in the envelope of VY CMa, a fact which led the authors to propose that these species are formed from shocks in the circumstellar envelope; they also concluded that PO and PN are the main reservoir of Phosphorus in the gas phase.
PN was first detected towards a few high-mass star forming regions: Ori(KL) (Ziurys, 1987), W51M and SgrB2 (Turner & Bally 1987). A systematic search for PO by Matthews, Feldman & Bernath (1987) yielded only upper limits in the massive Star-Forming regions Ori(KL), SgrB2 and DR21(OH). Recently, Fontani et al. (2016) observed a sample of 26 massive cores at various evolutionary stages, from prestellar to ultra-compact HII regions and report detection of the PN =2–1 line in about 30% of the their sample. Rivilla et al. (2016) have reported the first detection of PO towards high-mass star forming regions and found that Phosphorus seems strongly depleted from the gas phase. The first evidence of P-bearing species in low-mass star forming regions was provided by Yamaguchi et al. (2011), who reported the tentative detection of the PN transition =2–1 towards the shock positions B1 and B2 in the outflow of the low-mass Class 0 protostar L1157-mm (d=250pc). This is the first and only P-bearing molecule tentatively detected in a solar-type star forming region until now.
Given the importance of Phosphorus for prebiotic chemistry and its presence in the early stages of our own Solar system, we have led a systematic search for the presence of phosphorus-bearing molecules in solar-type star forming regions, in the framework of the Large Program dedicated to Astrochemical Surveys At IRAM (ASAI; Lefloch & Bachiller, in prep), with the 30m telescope. In this Letter, we present the results of our study towards the outflow shock L1157-B1 and the driving protostar L1157-mm. No emission was detected towards the protostar. Towards L1157-B1, we have detected the emission of various rotational transitions of PN and of PO, for the first time. A search for more complex P-Bearing species (e.g. PH3) yielded only negative results. After presenting the observational results on our systematic search (Section 2), we derive the physical conditions and molecular abundances for both species, and discuss the implication on their formation and shock chemistry.
2 Observations
The observations of L1157-B1 and L1157-mm were acquired with the IRAM-30m telescope at Pico Veleta (Spain), during several runs in 2011 and 2012. The observed position of L1157-B1 and L1157-mm are 20 39 10.2, +68∘ 01′ 10′′ and 20 39 06.3, +68∘ 02′ 15′′.8, respectively. The survey was carried out using the broad-band EMIR receivers at 3 mm (80 – 116 GHz), 2 mm (128 – 173 GHz), 1.3 mm (200 – 272 GHz). Fast Fourier Transform Spectrometers were connected to the EMIR receivers, providing a spectral resolution of 195 kHz. The high-frequency part of the 1.3mm band (260–272 GHz) was observed with the WILMA autocorrelator, at 2 MHz resolution. The final kinematic resolution of the FTS data was degraded to . The observations were carried out in Wobbler Switching Mode, with a throw of , in order to ensure a flat baseline across the spectral bandwith observed (4 GHz to 8 GHz, depending on the receiver).
The data reduction was performed using the GILDAS/CLASS90 package111http://www.iram.fr/IRAMFR/GILDAS/. The line intensities are expressed in units of antenna temperature corrected for atmospheric attenuation and rearward losses (). For the ASAI data, the calibration uncertainties are typically 10, 15, and at 3mm, 2mm, and 1.3mm, respectively. For subsequent analysis, fluxes were expressed in main beam temperature units (). The telescope and receiver parameters (main-beam efficiency Beff, forward efficiency Feff, Half Power beam Width HPBW) were taken from the IRAM webpage222http://www.iram.es/IRAMES/mainWiki/Iram30mEfficiencies. We used in the following the CASSIS software333http://cassis.irap.omp.eu for the line identification.
We have summarized the spectroscopic properties and observational parameters of the lines detected in the Table 1. We show in Fig. 1 a montage of the PO and PN lines detected towards L1157-B1.
3 Results


3.1 PN
We used the spectroscopic parameters provided by CDMS for the phosphorus nitride molecule (Cazzoli et al. 2006). The four PN rotational transitions =2–1, 3–2, 5–4 and 6–5 fall into the ASAI bands (see Table 1). No emission at all was detected towards L1157-mm (see the =2–1 spectrum in red in the bottom panel of Fig. 2). On the contrary, all of them were detected towards L1157-B1, with a SNR between 4 and 10. We confirm the previous detection by Yamaguchi et al. (2011) of the =2–1 and report the detection of the transitions =3–2, 5–4 and 6–5, from levels with upper energy levels up to . The spectra display a linewidth in the range 4.5–, similar to the values measured for several other molecular species (see Codella et al. 2010), which testify of the shock origin of the emission.
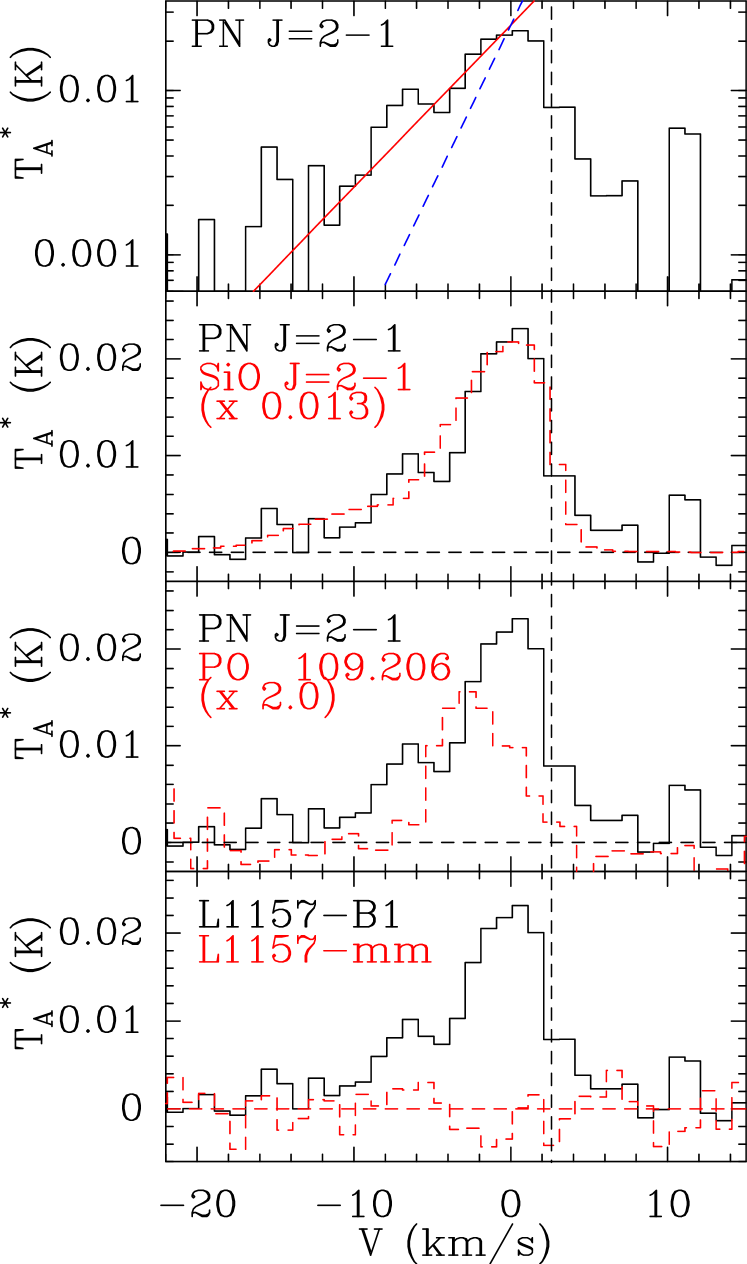
The =2–1 and 3–2 lines are detected with a typical intensity of 30 mK. The SNR in the wings of the =2–1 and =3–2 line profiles is high enough to constrain the slope of the intensity distribution as a function of velocity, following the approach of Lefloch et al. (2012) (see also Gómez-Ruiz et al. 2015). The intensity profile is well described by an exponential law with (see Fig. 2). As discussed by Lefloch et al. (2012) and Gómez-Ruiz et al. (2015), this slope is the specific signature of the outflow cavity associated with L1157-B1 (). A blueshifted wing is detected up to in the PN =2–1 line profile (see Fig. 2), and we find a very good match with the SiO =2–1 line profile obtained at a similar angular resolution of with the IRAM 30m telescope. This suggests that the PN and SiO spatial distributions are very similar, and that PN comes from the region where the impact of the shock on the surrounding material is violent, with velocities larger than . This provides us with an estimate for the size of the PN emitting region .
3.2 PO
We searched for all PO transitions in the ASAI bands. We used the spectroscopic parameters for phosphorus monoxide provided by the CDMS database (Kawaguchi et al. 1983, Bailleux et al. 2002). A grand total of twelve PO transitions have between 80 and 272 GHz. All the transitions fulfilling this criterion in the 3mm and 1.3mm bands were detected. This is the first detection of PO in a solar-type star forming region. Overall, lines are rather weak, with typical intensities of 5–8mK. In the 2mm bands, two line doublets have larger than . Unfortunately, the higher rms noise in that part of the spectrum (5 mK per interval of ) permits marginal detection of one doublet only. As a result, the flux of the 2mm transitions is rather uncertain, and we did not take them into account into the subsequent analysis to determine the excitation conditions of the PO gas. The large number of transitions detected (10) makes us confident in the identification of PO in the line spectrum of L1157-B1. The PO line emission peak is located close to , i.e. it is shifted from PN by – (see Fig. 2). The velocity difference between the PO and PN emission peaks implies that both species probably form in different regions of the shock. We note that the full width at zero intensity (FWZI) is approximately : it is narrower for PO than for PN ().
| Transition | Frequency | HPBW | Feff | Beff | |||||||
| (MHz) | (K) | () | (mK kms-1) | (kms-1) | (kms-1) | (mK) | |||||
| PN | |||||||||||
| 2 – 1 | 93979.7689 | 6.8 | 26.2 | 0.95 | 0.80 | 148(13) | –0.24(0.25) | 5.97(.70) | 23.3(3.0) | ||
| 3 – 2 | 140967.6921 | 13.5 | 17.5 | 0.93 | 0.74 | 186(13) | –0.67(0.23) | 6.27(.54) | 27.8(3.4) | ||
| 5 – 4 | 234935.2619 | 33.8 | 10.5 | 0.91 | 0.58 | 43(9) | –0.62(.48) | 4.31(.88) | 9.4(1.5) | ||
| 6 – 5 | 281914.2033 | 47.4 | 8.7 | 0.88 | 0.49 | 28(9) | –1.47(.97) | 4.61(2.05) | 5.6(2.5) | ||
| PO | |||||||||||
| J – (J – 1) | Parity | F–(F-1) | |||||||||
| 5/2 – 3/2 | e | 3 –2 | 108998.445 | 8.4 | 22.6 | 0.95 | 0.79 | 63.2(7.0) | –2.18(.37) | 7.38(.94) | 8.0(1.1) |
| 5/2 – 3/2 | e | 2 – 1 | 109045.040 | 8.4 | 22.6 | 0.95 | 0.79 | 38.5(7.0) | –3.19(.73) | 7.80(1.60) | 4.6(1.2) |
| 5/2 – 3/2 | f | 3 – 2 | 109206.200 | 8.4 | 22.5 | 0.95 | 0.79 | 27.3(6.0) | –2.34(.37) | 5.63(.84) | 7.9(1.3) |
| 5/2 – 3/2 | f | 2 – 1 | 109281.189 | 8.4 | 22.5 | 0.95 | 0.79 | 24.5(7.0) | 0.20(.63) | 5.18(1.90) | 4.5(1.1) |
| 7/2 – 5/2 | f | 4 – 3 | 152656.979 | 15.7 | 16.1 | 0.93 | 0.72 | 118.0(19) | –1.34(.26) | 5.60(.99) | 19.8(5.4) |
| 7/2 – 5/2 | f | 3 – 2 | 152680.282 | 15.7 | 16.1 | 0.93 | 0.72 | 66.6(17) | –1.95(1.04) | 5.60 (.00) | 11.2(5.0) |
| 7/2 – 5/2 | e | 4 – 3 | 152855.454 | 15.7 | 16.1 | 0.93 | 0.72 | <35 | – | – | <15.0 |
| 7/2 – 5/2 | e | 3 – 2 | 152888.128 | 15.7 | 16.1 | 0.93 | 0.72 | <35 | – | – | <15.0 |
| 11/2 – 9/2 | f | 6 – 5 | 239948.978 | 36.7 | 10.3 | 0.91 | 0.58 | 51.1(6.0) | –1.54(.30) | 5.06(.65) | 10.0(1.9) |
| 11/2 – 9/2 | f | 5 – 4 | 239958.096 | 36.7 | 10.3 | 0.91 | 0.58 | 47.1(6.5) | –1.45(.35) | 4.86(.79) | 9.1(1.9) |
| 11/2 – 9/2 | e | 6 – 5 | 240141.054 | 36.7 | 10.2 | 0.91 | 0.58 | 14.5(5.3) | –3.04(.43) | 2.25(.98) | 6.2(2.2) |
| 11/2 – 9/2 | e | 5 – 4 | 240152.530 | 36.7 | 10.2 | 0.91 | 0.58 | 28.5(9.0) | –4.89(.85) | 4.42(1.90) | 6.1(2.2) |
| PH3 | |||||||||||
| – | 266944.662 | 12.8 | 9.2 | 0.89 | 0.52 | <32 | - | - | <9.6(*) | ||
(*) per interval of 2 MHz ()
3.3 PH3
We used the spectroscopic parameters for PH3 provided by the CDMS database (Müller et al. 2013). All the rotational transitions of PH3 accessible in the ASAI bands are characterized by very low Einstein coefficients , typically less than and very high upper level energies (typically higher than ). The only transition with favourable excitation conditions is the – at 266.944662 GHz, which has an = and an of . We failed to detect this transition down to an rms of 3.2 mK () in an interval of 2 MHz. Adopting a typical linewidth of , we obtain a upper limit of 32 mKkms-1 (in ) for the line flux.
A search for other P-bearing molecules yielded only negative results.
4 Molecular abundances
Plateau de Bure observations by Gueth et al. (1998) indicate a typical, round size of for the SiO =2–1 line emission, centered close to the nominal position of L1157-B1. Observations with the IRAM Plateau de bure interferometer at resolution reveal an inhomogeneous structure with the presence of three compact clumps of gas in L1157-B1, named "B1a-b-c", with a typical size of (Benedettini et al. 2013). We have considered two cases in the derivation of the physical conditions and abundance of PO and PN: a) Phosphorus emission arises from the whole shock region detected in SiO =2–1 (size= ), as suggested in Sect.3.2; b) Phosphorus emission arises from one of the compact clumps present in the SiO shock region (size= ). We adopted a linewidth = , in good agreement with the value obtained from a gaussian fit to the PO and PN line profiles of the =2–1 and 3–2 transitions. The corresponding fluxes are listed in Table 1.
4.1 PN
We derived the physical conditions in the PN gas from an analysis in the Large Velocity Gradient (LVG) approximation with the radiative transfer code MADEX. We used the PN-He collisional coefficients from Tobola et al. (2007) and scaled by a factor of 1.37 to take into account the difference in mass of H2.
We first consider the case a) for the origin of PN emission. We find as best fit solution a gas temperature = , n(H2)= , and a source-averaged column density N(PN)= . The fit of the PN transitions is superposed in red on the line spectra in Fig. 1. A minimum analysis shows that best fitting solutions are obtained for N(PN)= ; the kinetic temperature is not well constrained and solutions in the range 40– are possible. On the contrary, the density is well constrained in the range (0.5-1.0). We note that these physical conditions are consistent with the gas kinetic temperature and the density previously determined in the L1157-B1 cavity, from a CO and CS multi-transition analysis (Lefloch et al. 2012; Gómez-Ruiz et al. 2015). Lefloch et al. (2012) estimated a CO gas column density of for the L1157-B1 outflow cavity. Adopting a standard abundance ratio [CO]/[H2]= , we derive the abundance of PN relative to H2 [PN]. This value is in reasonable agreement with the previous determination of Yamaguchi et al. (2011):(0.2-0.6).
We now consider the case b), i.e. the alternative situation where PN arises mainly from one of the shocked gas clumps reported by Benedettini et al. (2013). We then obtain solutions of the type N(PN)= , = , T=55K. This would result in a typical abundance [PN]. Such low densities are hard to reconcile with the overall density structure of L1157-B1, as derived by Gómez-Ruiz et al. (2015), or even the density estimates obtained towards the compact clumps reported by Benedettini et al. (2013). Our analysis favors case a): PN arises from an extended region in the shock, close to the apex of the outflow cavity, where efficient grain sputtering is taking place.
4.2 PO
Due to the absence of coefficients available for PO-H2 collisions, we carried out a simple LTE analysis using CASSIS. The column density and the excitation temperature were determined from a best fit analysis () on the 5/2–3/2 transitions at 3mm and 1.3mm. We could check a posteriori that the lines are optically thin.
Proceeding as above, we first assumed a size of for the PO emitting region. The best fit solution is obtained for a rotational temperature = and a source-averaged column density N(PO)= , resulting into a gas phase abundance [PO] . This is about 3 times the abundance of PN. The fit to the PO transitions is superposed in red on the line spectra in Fig. 1, with a fixed Full Width at Half Maximum (FWHM) of and of , with the above parameters.
Like for PN, we consider the case where the PO emitting region would arise from a compact shock region. Not surprisingly, a larger column density is required to account for the PO emission: typically and for a source size of and , respectively. This corresponds to a PO abundance [PO]= and , respectively.
4.3 PH3
We used CASSIS to obtain an upper limit on the abundance of phosphine from the non-detection of the ground transition – at 266944.662 GHz. We adopted a typical excitation temperature of , a linewidth of , and adopted a typical source size of . Taking into account the rms of 3mK, comparison with the ASAI data shows that N(PH3) has to be less than , which results into an upper limit of for the phosphine abundance in the gas phase.
As a conclusion, a careful determination of the abundance of P-bearing species in the gas phase shows that they contain only a few percent of the total elemental phosphorus.
5 Phosphorus chemistry in the L1157-B1 shock
In Section 3, we showed that the emission from PN and PO arises from the L1157-B1 outflow cavity, which can be described by a C-type shock (Lefloch et al. 2012; Holdship et al. 2016). We therefore investigate the origin of the PO and PN emission in this region by the use of the chemical gas-grain model UCL_CHEM (Viti et al. 2004a) coupled with the parametric C-shock model by Jiménez-Serra et al. (2008). We use the same approach as Viti et al. (2011) where we modelled the ammonia and water emission across the same region. We note that a similar approach was used by Aota & Aikawa (2012) to reproduce the previous observations of PN and PO performed by Yamaguchi et al. (2011) toward the same outflow cavity. We stress that our new observational constraints lead to different conclusions about the history of the region and the shock parameters. This point is more specifically addressed in Sect. 5.3.
We study the evolution of phosphorous-bearing species in a one dimensional C-shock, but with the specific aim of determining whether PO and PN are mainly formed and destroyed in the gas phase prior to the shock passage, on the grains, or during the shock event(s). Moreover, as in Viti et al. (2011), our model is able to determine whether the differences in line profiles discussed above may be explained by the differences in abundances at different velocities.
5.1 Modelling
A detailed description of UCL_CHEM coupled with the shock model can be found in Viti et al. (2011). Here we briefly summarize the main characteristics of the code. The code is run in two phases, where Phase I forms a dense core out of a diffuse medium, starting from an essentially atomic gas. We adopt an initial density of 100 cm-3 for the diffuse medium. During this phase, gas-phase chemistry, freezing on to dust particles and subsequent surface processing occur. The sticking efficiency for all species is assumed to be 100% but the rate of depletion is a function of density (in a similar manner as in Rawlings et al. 1992). The density at the end of Phase I is a free parameter, called from now on the pre-shock density. The second phase computes the time-dependent chemical evolution of the gas and dust during the passage of a shock. The model includes both thermal desorption, due to the dust being heated by the presence of the outflow, as well as sputtering of the icy mantles once the dynamical age across the C-shock has reached the "saturation timescales", as in Jimenez-Serra et al. (2008). The saturation timescale corresponds to the time when most of the ices have been injected into the gas phase, due to the passage of the shock (Jimenez-Serra et al. 2008). Such timescales are inversely proportional to the density of the gas and for pre-shock H2 densities of –, these times range between 10 and 100 years, i.e. factors 10-100 shorter than the typical dynamical ages of young molecular outflows (). Our chemical gas-phase network is taken from UMIST 12444http://udfa.ajmarkwick.net/and is augmented with updates from the KIDA database555http://kida.obs.u-bordeaux1.fr/. The surface network comprises mainly hydrogenation reactions. In particular we note that neither UMIST 12 nor KIDA contains a network for PH3. Rather than creating an ad hoc set of reactions for this species we made the assumptions that this species will be preferentially formed on the grains by hydrogenation and that therefore PH2 could act as a proxy for PH3. Of course this also means that we are assuming that the routes for gas phase destruction for PH3 and PH2 are similar. In all our figures we therefore present PH2 as a proxy for PH3.
We ran a small grid of models where we varied:
-
•
the pre-shock density; we have adopted two possible values for the total hydrogen nuclei density n(H+ H2)based on previous studies of this cavity: 104 and 10.
-
•
the shock velocity, from 20 to . From the pre-shock density and the shock velocity the maximum temperature of the neutral fluid attained within the shock is taken from Figures 8b and 9b in Draine et al. (1983).
-
•
the initial elemental abundance of phosphorous: while its abundance in the diffuse, warm ISM, is found to be solar (e.g. Jenkins, Savage & Spitzer 1986), all the studies so far of phosphorous-bearing species in star forming regions have found that the initial elemental abundance of phosphorous needs to be depleted by up to a factor of 100 in order to match the observations (Aota & Aikawa 2012; Fontani et al. 2016; Rivilla et al. 2016). We have therefore varied this parameter and adopted values of solar (2.5710-7) down to a depletion factor of 100.
-
•
the duration of the pre-shock phase (Phase I). We have considered a short-lived and a long-lived scenario, respectively, to investigate the impact of different initial gas compositions, as a result of different cloud ages. In the first case, the core is immediately subjected to the passage of a shock when it reaches the pre-shock density; in the second case, the core is allowed to remain static for about 2 million years.
5.2 Results
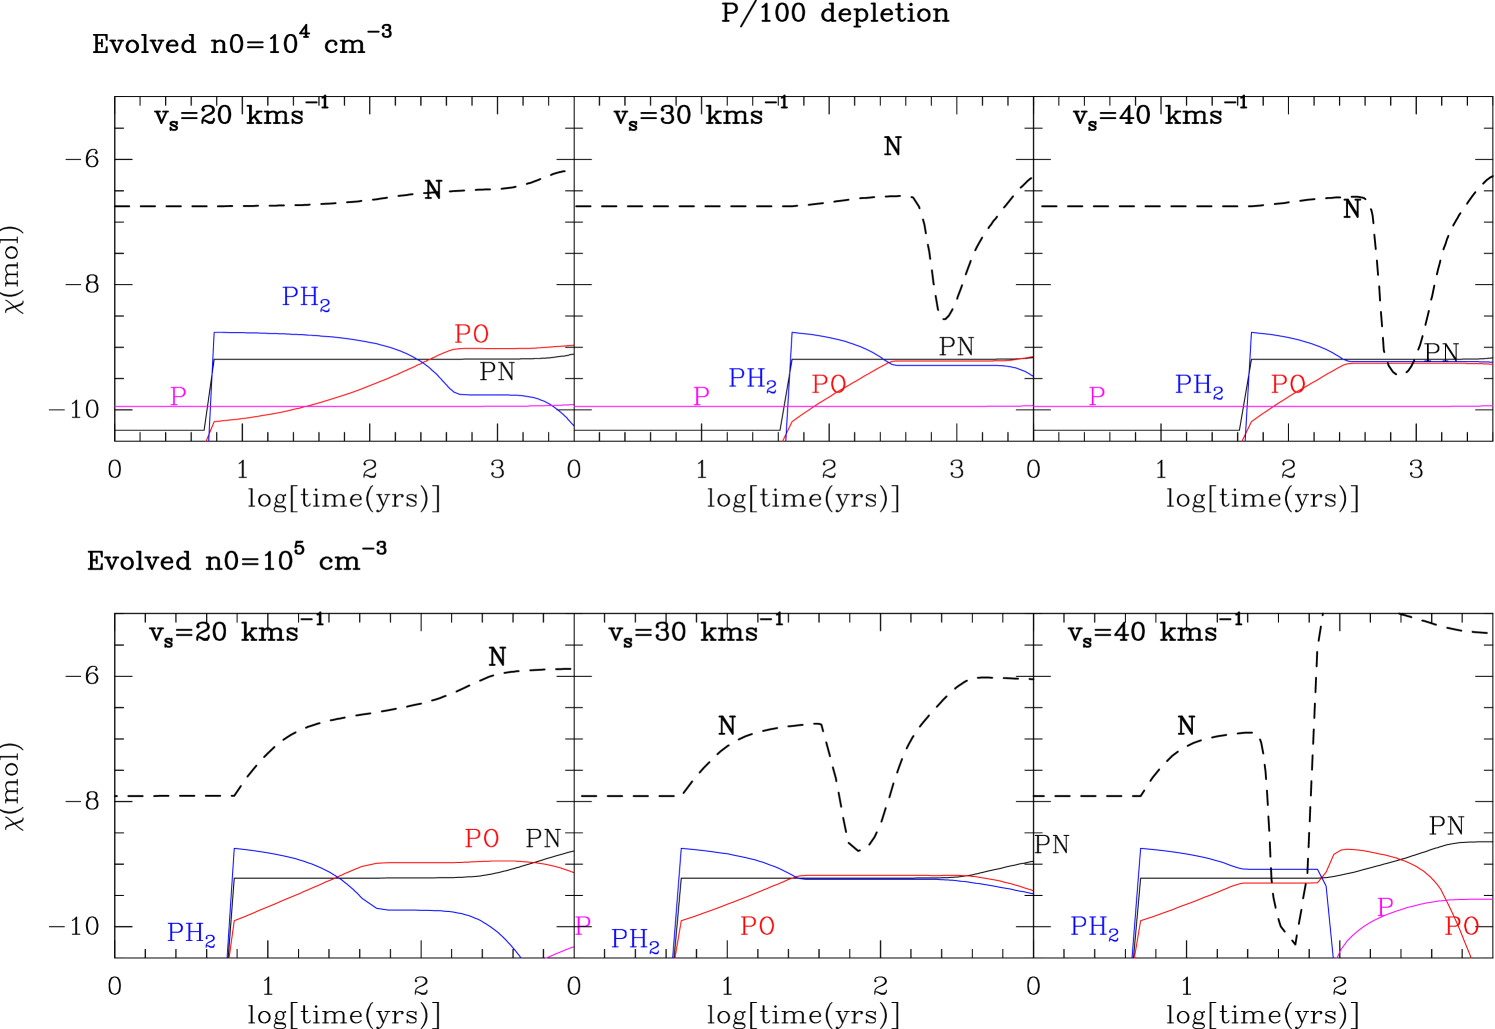
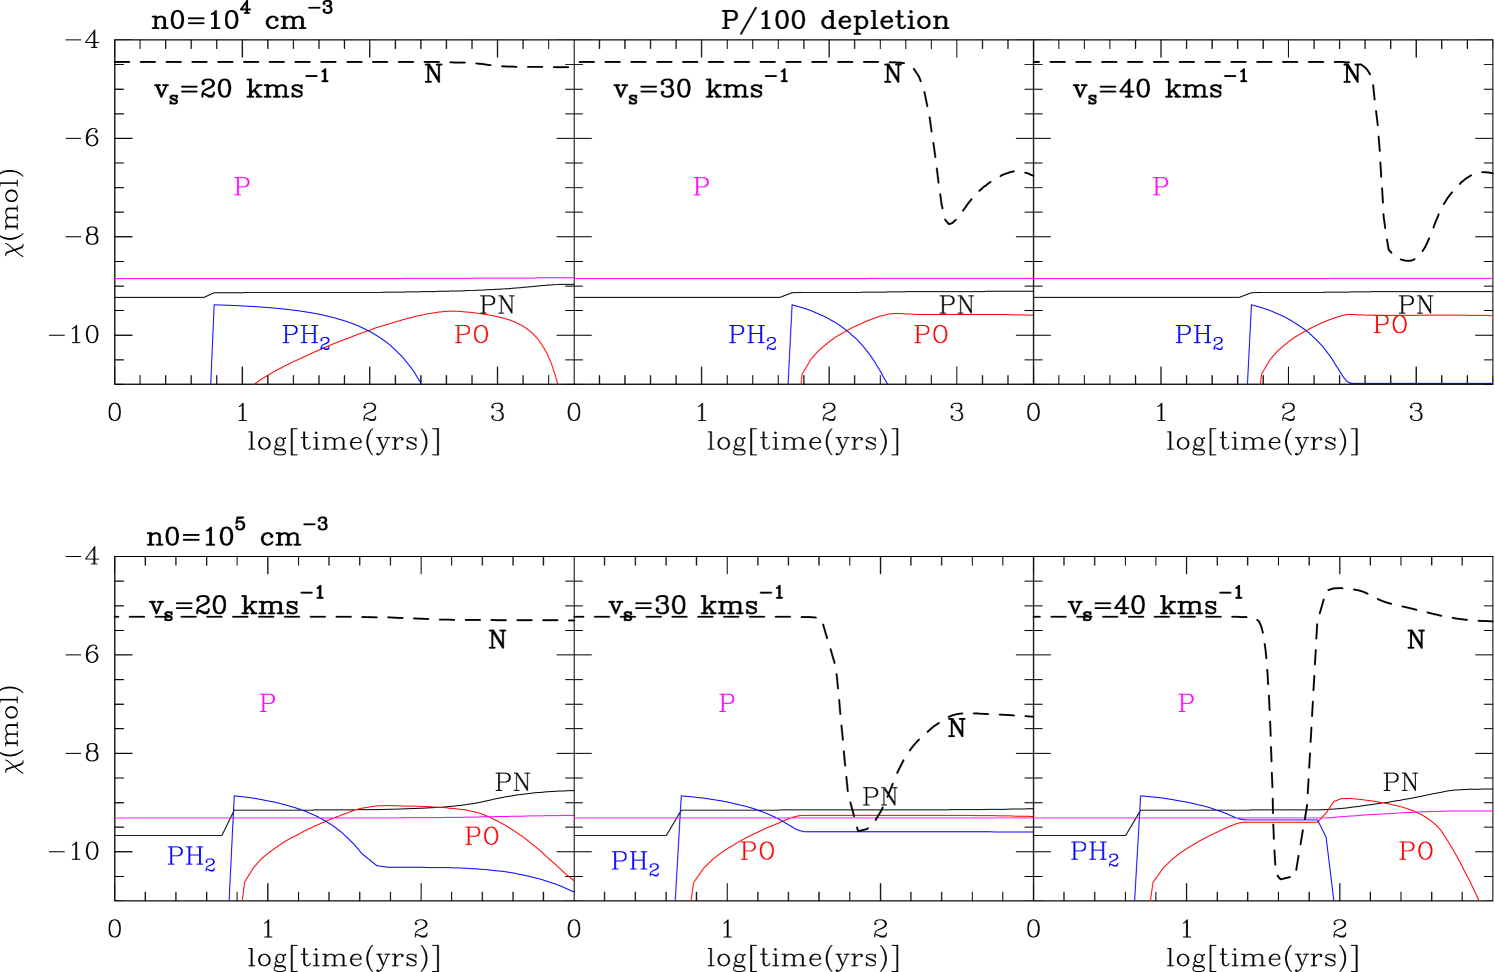
The observations yield abundance values for PO and PN of the order of 1–3, for a common source size of , with PO larger by a factor of 3 or so than PN. PH3 is undetected, and has an upper limit of 10-9. We present in Fig. 3 the evolution of phosphorous bearing species as well as nitrogen as a function of time during the passage of the shock (Phase II), when the initial elemental abundance of phosphorus is depleted by a factor of 100 and the pre-shock phase is long-lived. We show the result for three shock velocities (20,30, ), pre-shock densities of and , and long-/short-lived pre-shock phase in Figs. 3 and 4, respectively. We note that the magnitude of the depletion effect affects only the overall abundance of P-bearing species.
Our first result is that none of the models where phosphorous is solar can fit the observations, as all phosphorous bearing species are about two orders of magnitude higher than what is observed. Models where the total gas-phase phosphorous is are therefore favoured.
As can be seen in Fig. 3, we find that PH2 is immediately released in the gas phase, as a result of the grain mantle sputtering at the passage of shock. PN follows closely the evolution of PH2, while PO forms gradually and its abundance rises slowly in the shock. This is in agreement with our observations, where there is a clear shift toward more blue-shifted velocities for PO than for PN, which is consistent with a delay in the formation of PO in the gas phase with respect to PN.
If the pre-shock phase (Phase I) is short-lived (Fig. 4) we never reach a situation where PO is clearly larger than PN throughout the shock evolution. As explained below, this is due to the lack of significant depletion of atomic N for time-scales <1 Myr. Atomic phosphorus also remains abundant in the gas phase, at abundances of about , comparable to or larger than that of PN, depending on the pre-shock density. If the pre-shock phase (Phase I) is short-lived we never reach a situation where PO is clearly larger than PN throughout the shock evolution. This is the reason why Aota & Aikawa (2012) opted for a short-lived pre-shock phase to explain the upper limits of PO measured toward L1157-B1 by Yamaguchi et al. (2011). Given the uncertainties in the derivation of PO and PN abundances, we cannot discard a situation the PO/PN ratio is simply , however.
A chemical analysis on the formation and destruction of PO and PN shows that the key player in their chemistry is atomic nitrogen (as also found by Aota & Aikawa 2012), which in turn is mainly released from ammonia NH3 in the shock: for example, for the higher pre-shock densities () and weak shocks (), a significant fraction of atomic nitrogen is still present in the gas phase and hence PO is destroyed by the reaction
.
This reaction contributes to 85% to the total destruction of PO. When the shock velocity is higher, about , the temperature of the neutral fluid is also higher and favours the conversion of N into NH3, and therefore PO survives in the gas phase for longer. However, at higher velocities (), as also shown in Viti et al. (2011), NH3 is efficiently destroyed in the post-shock gas, liberating N into the gas phase and augmenting the destruction of PO via N (a route that here contributes to 100% of the PO destruction). This leads to a faster drop for PO. This process requires that the maximum temperature in the shock is larger than .
Because the amount of available nitrogen is key to the survival of PO, a higher pre-shock density favours it: for higher densities, more nitrogen is locked onto grains in the form of NH3. The atomic Nitrogen abundance decreases by when the pre-shock density increases from to (see e.g. Figs. 3–4). Since from previous discussion in Sect. 3.2, the terminal velocity of PO is smaller (about ) than the PN one (almost ), the model with a shock velocity of (bottom right of Fig. 3) is the best match, as PO is destroyed at the end of the post-shock region as a consequence of the destruction of NH3.
The best matching models are in fact those where the pre-shock phase is longer-lived (Fig. 3), again, because atomic nitrogen has more time to get locked in the icy mantles before the arrival of the shock. In all the models from Fig. 3, PN and PO are comparable for most of the dissipation length. The only model for which we find a sharp decrease in abundance in the postshock region is the model with pre-shock density of and a shock velocity of . Such a drop occurs at a time of and translates into lower terminal velocities of the PO line emission. Models with a shock velocity of and also indicate a PO abundance drop from the gas phase. This abundance drop occurs at a longer time however, once passed the dissipation length, which makes it difficult to quantify accurately based on our simple modelling. Because of this, and because similar shock velocities are also required to explain the different line profiles observed toward L1157-B1 for NH3 and H2O (Viti et al. 2011), we favour the scenario in which PN and PO are formed in a shock with a velocity of . Finally, we note that a high pre-shock density also favours the idea that dense clumps along outflows pre-exist the outflow event itself and are not in fact formed by compression due to the arrival of the shock (Viti et al. 2004b).
5.3 Comparison with previous results
Using the detection of the PN =2–1 line and the non-detection of PO by Yamaguchi et al. (2011) in L1157-B1, Aota & Aikawa (2012) modelled the phosphorous chemistry in the shocked region of L1157-B1 by using a chemical model coupled with the parametric shock model by Jimenez-Serra et al. (2008). These authors searched for shock solutions whereby PN was abundant while PO was not. The wider and richer spectral content of the ASAI data brings more robust constraints on the properties of P-bearing species PO, PN (and PH3) in L1157-B1, affecting some of their conclusions on the shock properties: their study favours a shock velocity of , while our results suggest that PN and PO are formed in a shock. In our model a maximum temperature of 4000 K is indeed required in the shock to liberate atomic N into the gas phase from NH3 and to destroy PO at higher velocities in the shock (as suggested by the observed different terminal velocities of PN and PO; Section 3.2). Our conclusions on the depletion of elemental phosphorus by a factor of 100 in molecular dark clouds, and of the importance of atomic N in the chemistry of PO and PN, agree with those of Aota & Aikawa (2012).
Recent studies of PN and PO towards the high-mass star forming regions W51 e1/e2 and W3(OH) by Fontani et al. (2016) and Rivilla et al. (2016) reach conclusions similar to ours: phosphorus appears to be depleted in quiescent molecular gas by more than one order of magnitude. The abundances they derive towards these massive sources are of the order , typically one order of magnitude less than towards the shock L1157-B1. Interestingly, they report similar PO/PN abundance ratios ( 2–3). Observations with the NOEMA array would permit more accurate determination of the depletion factor by resolving the size of the emitting region of PO and PN at a few arcsec scale. Mapping the relative spatial distribution of PO and PN as a function of velocity would permit confirmation of our conclusions on the shock parameters.
6 Conclusions
We report on a systematic search for P-bearing species towards the solar-type star forming region L1157. We have unambiguously detected emission from PN and, for the first time, from the pre-biotic molecule PO in the outflow shock region L1157-B1. No emission from P-bearing species was detected towards the envelope of the protostar L1157-mm. Spectral line profile analysis suggests that the emission originates from the same region as SiO, with a typical size of 15–. The abundances of PO and PN are found comparable, with values of 2.5 and , respectively.
A simple modelling using the C-shock code of Jimenez-Serra et al. (2006) coupled the chemical gas-grain model UCL_CHEM (Viti et al. 2004) allows us to reproduce the main features of PO and PN emission in the shock. Our main conclusions are as follows:
- Phosphorus is depleted by about a factor 100 in the gas phase.
- Atomic Nitrogen plays a key role in the formation and destruction routes of PO and PN
- The observed PO/PN abundance ratio is , and brings constraints on the duration of the pre-shock phase, which has to be larger than and the pre-shock density, of the order of .
- The maximum temperature in the shock has to be in order to account for the difference of terminal velocities between PO and PN.
Follow-up observations at arcsec scale with the NOEMA array would permit probing the model we propose for the formation of PO and PN in the shock. By resolving the size of the emitting region of PO and PN, it would possible to confirm that both species form in different regions of the shock, and to estimate more accurately the Phosphorus depletion factor in the gas phase.
Acknowledgements
Based on observations carried out as part of the Large Program ASAI (project number 012-12) with the IRAM 30m telescope. IRAM is supported by INSU/CNRS (France), MPG (Germany) and IGN (Spain). This work was supported by the CNRS program "Physique et Chimie du Milieu Interstellaire" (PCMI) and by a grant from LabeX Osug@2020 (Investissements d’avenir - ANR10LABX56). E. M. acknowledges support from the Brazilian agency FAPESP (grant 2014/22095-6 and 2015/22254-0). I.J.-S. acknowledges the financial support received from the STFC through an Ernest Rutherford Fellowship (proposal number ST/L004801/1).
References
- [] Altwegg, K., Balsiger, H., Bar-Nun, A., et al., 2016, Science Advances, 27 May 2016, 2, 160085,
- [] Aota,T., Aikawa, Y., 2012, ApJ, 761, 74
- [] Agundez, M., Cernicharo, J., Guélin, M., 2007, ApJ, 662, L91
- [] Asplund, M., Grevesse,N., Sauval, J., Scott, P., 2009, ARA&A, 47, 481
- [] Ceccarelli, C., Bacmann, A., Boogert, A., et al., 2010, A&A, 521, L22
- [] Benedettini, M., Viti, S., Codella, C., et al., 2013, MNRAS, 436, 179
- [] De Beck, E., Kamıński, T., Patel, N.A., et al., 2013, A&A, 558, 132
- [] Draine,B.T., Roberge, W.G., Dalgarno, A., 1983, ApJ, 264, 485
- [] Dufton, P.L., Keenan F.P., Hibbert, A., 1986, A&A, 164, 179
- [] Gómez-Ruiz, A., Codella, C., Lefloch, B., et al., 2015, MNRAS, 446, 3346
- [] Fontani, F., Rivilla, V.M., Caselli, P., et al., 2016, ApJ, 822, L30
- [] Gueth, F., Guilloteau, S., Bachiller, R., 1998, A&A, 333, 287
- [] Halfen,D.T., Ilyushin, V., Ziurys, L.M., 2011, ApJ, 743, 60
- [] Jenkins, E.B., Savage, B.D. , Spitzer, L., 1986, ApJ, 301, 355
- [] Jimenez-Serra, I., Caselli, P., Martin-Pintado, J., Hartquist, T.W., 2008, A&A, 482, 549
- [] Lefloch, B., Cabrit, S., Busquet, G., et al., 2012, ApJ, 757, L25
- [] Macia, E., 2005, Chem Soc. Rev., 34, 691
- [] Mendoza, E., Lefloch, B., Lopez-Sepulcre, A., et al., 2014, MNRAS, 445, 1151
- [] Matthews, H.E., Feldman, P.A., Bernath, P.F., 1987, ApJ, 312, 358
- [] Rawlings, J.M.C., Hartquist, T.W., Menten, K.M., Williams, D.A., 1992, MNRAS, 225, 471
- [] Rivilla, V.M., Fontani, F., Beltran, M.T., et al., 2016, astroph:arXiv:1605.06109v2
- [] Saladino, R., Botta, G., Pino, S., 2012, Chem. Soc. Rev., 41, 5526-5565
- [] Tenenbaum, E.D., Woolf, N.J., Ziurys, L.M., 2007, 666, L29
- [] Tobola, R., Klos, J., Lique, F., et al., 2007, A&A, 468, 1123
- [] Turner, B.E., Bally, J., 1987, ApJ, 321, L75
- [] Viti, S., Collings, M.P., Dever, J.W., 2004a, MNRAS, 354, 1141
- [] Viti, S., Codella, C., Benedettini, M., Bachiller, R., 2004, MNRAS, 350, 1029
- [] Viti, S., Jimenez-Serra, I., Yates, J.A., et al., 2011, ApJ, 740, L3
- [] Yamaguchi, T., Takano, S., Sakai, N., et al., 2011, PASJ, 63, L37
- [] Ziurys, L., 1987, ApJ, 321, L81