HST imaging of the dusty filaments and nucleus swirl in NGC4696 at the centre of the Centaurus Cluster
Abstract
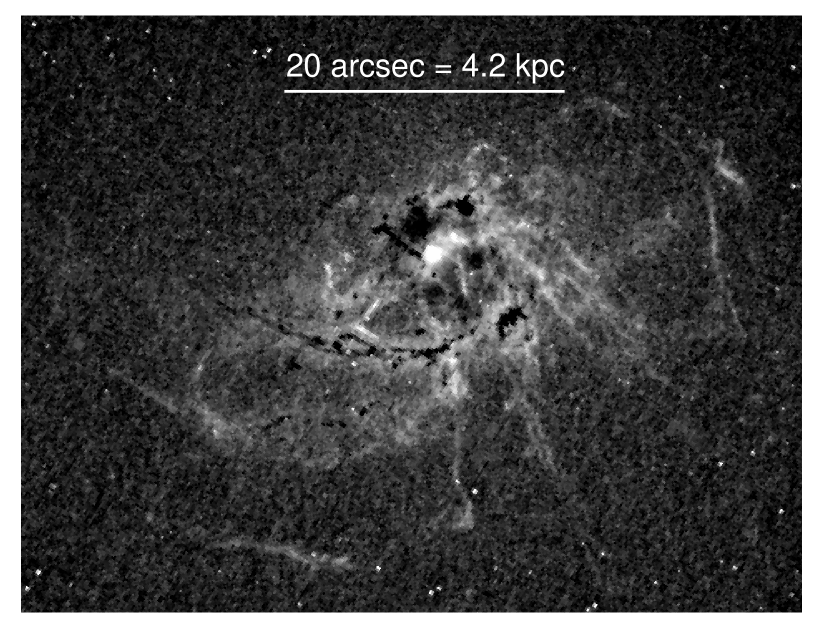
Narrow-band HST imaging has resolved the detailed internal structure of the 10 kpc diameter H+[NII] emission line nebulosity in NGC4696, the central galaxy in the nearby Centaurus cluster, showing that the dusty, molecular, filaments have a width of about 60pc. Optical morphology and velocity measurements indicate that the filaments are dragged out by the bubbling action of the radio source as part of the AGN feedback cycle. Using the drag force we find that the magnetic field in the filaments is in approximate pressure equipartition with the hot gas. The filamentary nature of the cold gas continues inward, swirling around and within the Bondi accretion radius of the central black hole, revealing the magnetic nature of the gas flows in massive elliptical galaxies. HST imaging resolves the magnetic, dusty, molecular filaments at the centre of the Centaurus cluster to a swirl around and within the Bondi radius.
keywords:
black hole physics: accretion, X-rays: galaxies, clusters1 Introduction
The Brightest Cluster Galaxy (BCG), NGC4696, in the nearby Centaurus cluster, Abell 3526, has a system of dusty H filaments (Fabian et al. 1982; Sparks et al. 1989, Crawford et al 2005) connecting the hot intracluster medium (ICM) with its Active Galactic Nucleus (AGN). The low star formation rate () means that energy feedback into the ICM via the AGN-powered radio source has stifled almost all complete radiative cooling in the hot gas for billions of years, despite a central cooling time (Sanders et al. 2008, 2016) of only . The details of how feedback is so successful and the operation of key ingredients such as the heating of the hot gas, the behaviour of the cold gas, the lack of star formation, and the fuelling of the central back hole are unclear (Fabian 2012). The filaments provide diagnostic information on the distribution and morphology of cold gas and its velocity field (Canning et al 2010) in the region where much of the central action takes place. The Centaurus system is important since it is the nearest BCG with detected, extended, molecular gas. Here we present Hubble Space Telescope (HST) H images of the filaments which show that they are likely to be magnetically-supported in the hot gas, similar to the situation for the spectacular filament system around NGC1275 in the more distant Perseus cluster (Fabian et al 2008). The images also reveal an intriguing swirl in the cold gas at the Bondi radius of the black hole.
The temperature of the hot gas in the central 20 kpc radius of the Centaurus cluster drops from 3 keV down to a mean of about 0.5keV. Chandra observations show that the gas is multiphase within 10kpc with a 0.5 keV component extending over the 5 kpc radius region where the optical filaments are seen (Sanders et al 2016). XMM-Newton Reflection Grating Spectrometer data reveal strong FeXVII emission lines from the 0.5 keV gas indicating that any complete cooling flow, which would be about if no heating took place, is reduced to below at temperatures below 0.4 keV (Sanders et al 2008). The filaments consist of both an atomic component giving rise to the H emission, as well as [NII], [OII], OI, [SiII] characteristic of lowly-ionized gas, significant masses of cold gas indicated by [CII] emission (Mittal et al 2011) and a molecular component is seen in H2 rotational lines with Spitzer (Johnstone et al 2007).
The low-ionization optical and near infrared emission spectrum of the filaments strongly indicates that energetic particles are responsible for heating and excitation of the cold gas (Ferland et al 2009). These are either due to penetration of the cold gas by the surrounding hot gas (Fabian et al 2011) or internal particles energised by magnetic reconnection as the filaments move around (Churazov, Ruszkowski & Schekochihin 2013). If it is by penetration then the filaments are growing at the expense of the hot gas at a few . Unlike the filaments in NGC1275, those in NGC4696 contain dust lanes, first reported by Shobbrook (1963), which contrasts with the NGC1275 filaments for which no dust lanes have been detected. Dust has also been detected in emission with Spitzer (Kaneda et al 2007) and Herschel (Mittal et al 2011) with a total cold dust mass of . In comparison with the total molecular mass, the dust-to- gas ratio appears to be normal. Comparison of the dust extinction in the R and V bands shows (Sparks et al 1989) that to be normal also.
The redshift of NGC 4696 is 0.0104 and we adopt
2 Filament Properties
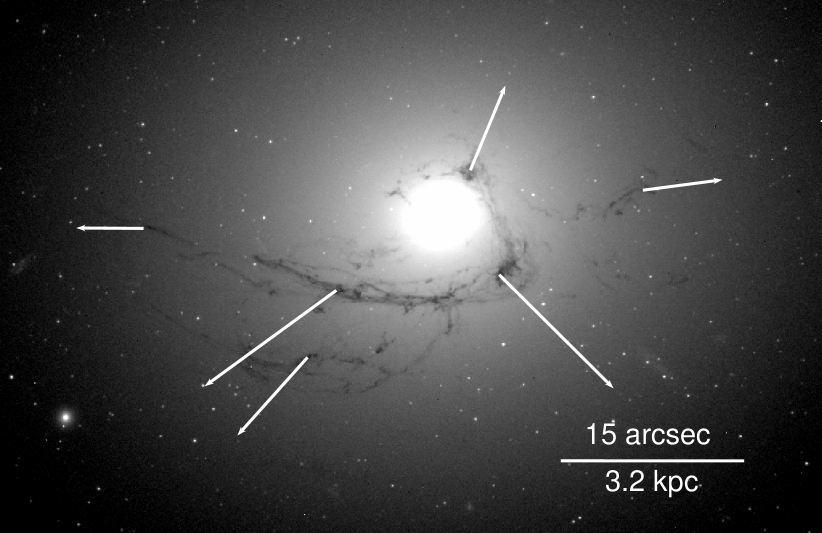
10.5 HST orbits were obtained with Wide Field Camera 3 (WFC3) using redshifted H filter F665N. This filter includes the H and [NII] emission lines with [NII] being the stronger component: for simplicity we refer to the combined emission as H. The images were drizzled together and a smoothed galaxy continuum model subtracted to give Fig. 1. The filaments are resolved with a width of about 60 pc (Fig. 2). More details of the reduction of the data are given in the Appendix.
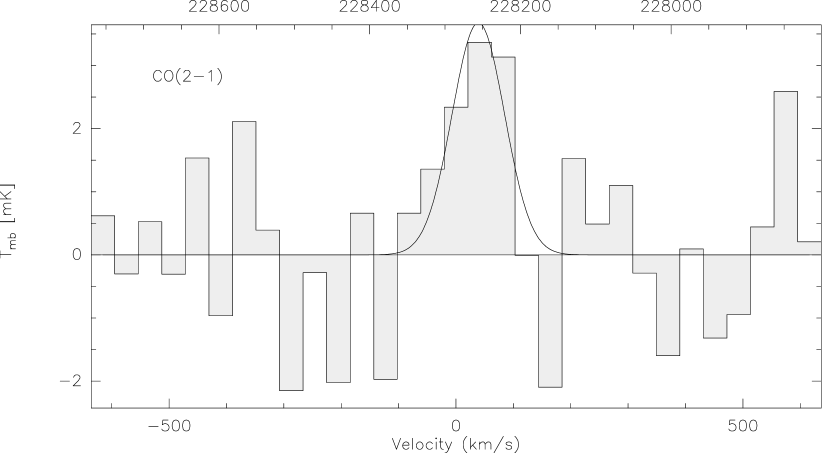

A detection of CO emission has been made using the Atacama Pathfinder EXperiment (APEX, Fig. 3). Using a Milky Way conversion factor (Bolatto et al 2013) we obtain a molecular mass of about . The ratio of total H luminosity (Canning et al 2011) of to CO luminosity is similar to that of other BCG systems (Edge et al 2001; Salomé & Combes 2003).
Assuming that this ratio is constant over the NGC4696 filament system, we find from the H surface brightness that the linear mass density of the filaments is about . The mean density of a filament then corresponds to about 3 protons cm-3 which is about 10 times denser than the surrounding hot gas. Of course the density of the molecular gas within a filament must correspond to much higher values: the thermal pressure is about so the CO component is plausibly denser than . The filaments are not continuous cold structures but must contain smaller dense structures or threads (Fabian et al 2008).
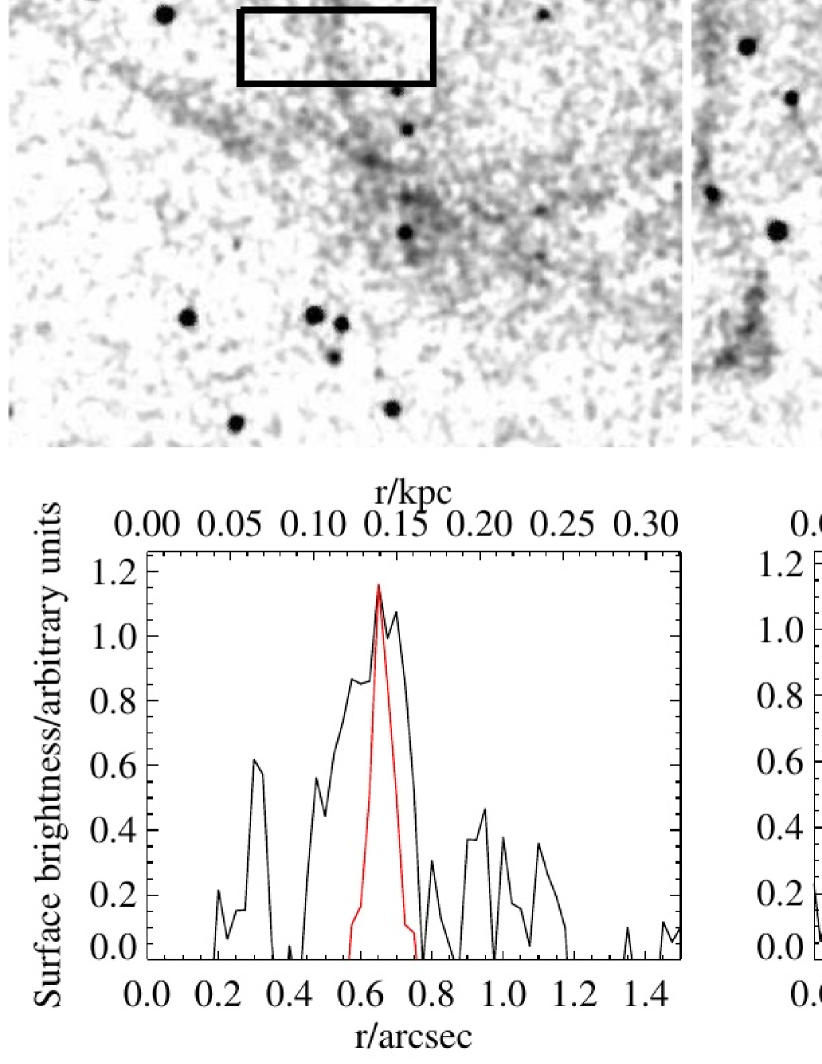
Inspection of the outer filaments suggests that they have similar surface brightness. This is confirmed using half-arcsec wide bins placed along the filaments, giving the peaked surface brightness histogram shown in Fig. 4. This is consistent with the ICM particle heating model (Fabian et al 2011) where heating and excitation is the result of the uniform flux of hot ICM particles, provided that the covering fraction of a filament is high, despite the low volume filling factor.
The shape of the filaments to the E strongly suggests that they are being drawn outward by the outflowing hot gas as part of the bubbling cycle. Consider the bright filament arc 19 arcsec to the ESE of the nucleus, just outside the Western bubble (Fig. 5), which has radius, and thickness . Assuming that the hot gas, density , dragging the arc out at velocity is balanced by an internal magnetic field , then
| (1) |
from which we deduce that , which equals the thermal pressure (Sanders et al 2016), assuming a reasonable value for the drag velocity (Canning et al 2011) of corresponds to the X-ray measured value (Sanders et al 2016) at that radius of 0.3 particles cm-3. We can also consider the magnetic support of a radial filament of length against tidal force to give a further value (Fabian et al 2008) of ,
| (2) |
We obtain using the value of the gravitational acceleration from Sanders et al (2016). This value is similar to that found (Fabian et al 2008) for the filaments in NGC1275.
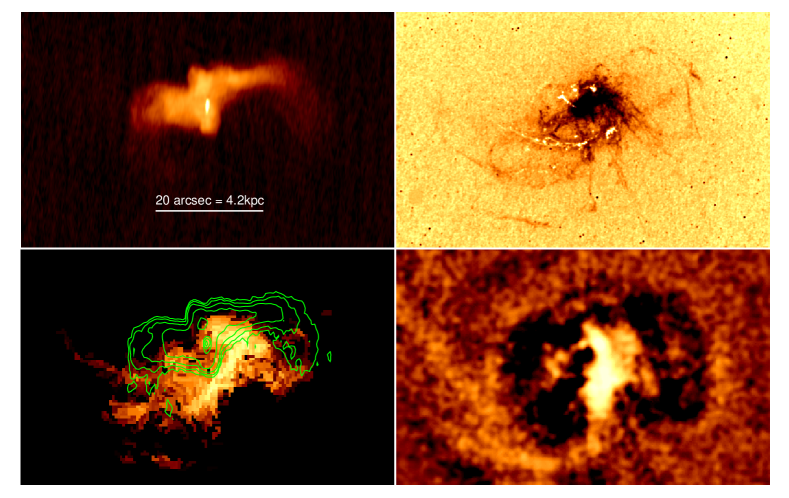
The strong Faraday Rotation seen in the radio source (Fig. 5) is interpreted as due to a mean line-of-sight magnetic field, , in the component of the inner hot gas (Taylor et al 2007). This corresponds to a magnetic pressure about 10 per cent of the thermal pressure. Filaments are thus magnetised structures embedded in a less magnetised ICM. Note that if hot gas at fixed temperature is clumped so that its volume filling factor is , then the value of deduced from Faraday Rotation scales as .
We have used the depth of dust absorption in the filaments to make a rough assessment of their location along the line of sight (Gillmon et al 2004). The starlight of the galaxy will fill in the absorption if the filaments are close to the centre. Fig. 6 displays the radius from the centre of NGC4696 at which the lowest flux in a dust patch matches the flux in that band from the galaxy. Most of the prominent outer filaments are then situated 4-5 kpc from the nucleus. We presume that the filaments without any obvious dust absorption are on the other side of the galaxy.
An abundance drop is seen in Chandra X-ray spectral imaging of the centre of NGC4696 with iron peaking at at a radius of 15 kpc and dropping inward to in the innermost (Panagoulia, Fabian & Sanders 2013). This can be explained if iron and many other metals injected by stellar mass-loss in the central region are locked up in grains which contribute to the filamentary nebula. The quasi-continuous bubbling process drags the filaments outward and dumps them beyond 10 kpc where they mix and join the ICM. An approximate steady state is reached if about 10 per cent of the dusty filament mass is dragged out every cycle (Panagoulia et al 2013), which corresponds to a mean outflow rate of .
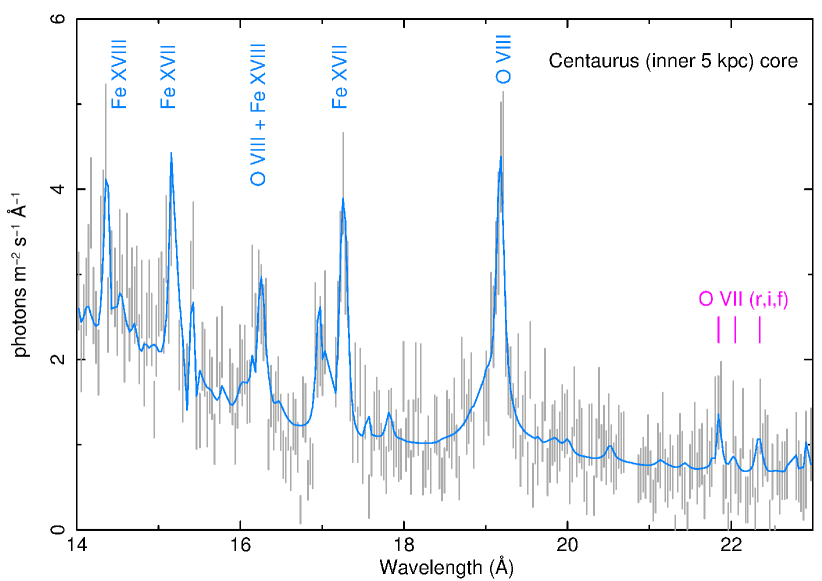
In Fig. 7, we show the XMM RGS spectrum from the inner region of the cluster core of width 5 kpc. Emission lines from FeXVII, characteristic of gas at 0.5 keV temperature are seen as well as a 3 detection of the OVII triplet near 22 A from gas at 0.2 keV. The latter corresponds to a radiative cooling rate of over the temperature range 0.3 to 0.05 keV, assuming Solar abundances. We have no clear evidence that the gas is cooling but note that the radiative cooling time of the 2 MK component is only . The gas may however be part of the mixing interface between the cold filaments and the hot surrounding medium (Chatzikos et al 2015).
A filament is therefore a quasi-linear aggregation of dense cold knots having a combined covering factor of unity over a width of about 60 pc, linked together by strong magnetic fields, permeated and surrounded by a volume-filling hot component at about . The hot component is itself magnetized but to a lesser level than the embedded filaments.
3 The Nuclear Region
It is interesting to compare the mass of cold gas with that of the surrounding hot gas. The electron density of the hot gas in the central 30 kpc is approximately (Sanders et al 2016) . The (projected) H emission scales as so, assuming that the cold gas mass scales similarly, the region within 0.5 kpc of the nucleus is dominated by cold gas.
The Bondi radius for accretion, , onto the central black hole is 70 pc if we assume that the volume-filling component is the cooler X-ray emitting gas at and use a black hole mass . The mass of the central black hole in NGC4696 has not yet been measured directly, but this is the mass deduced using the measured stellar velocity dispersion (Bernardi et al 2002) applied to the relation (McConnell & Ma 2013). The proximity and likely high mass of the black hole in NGC4696 mean that its accretion radius is one of very few in an active system which is currently resolvable.
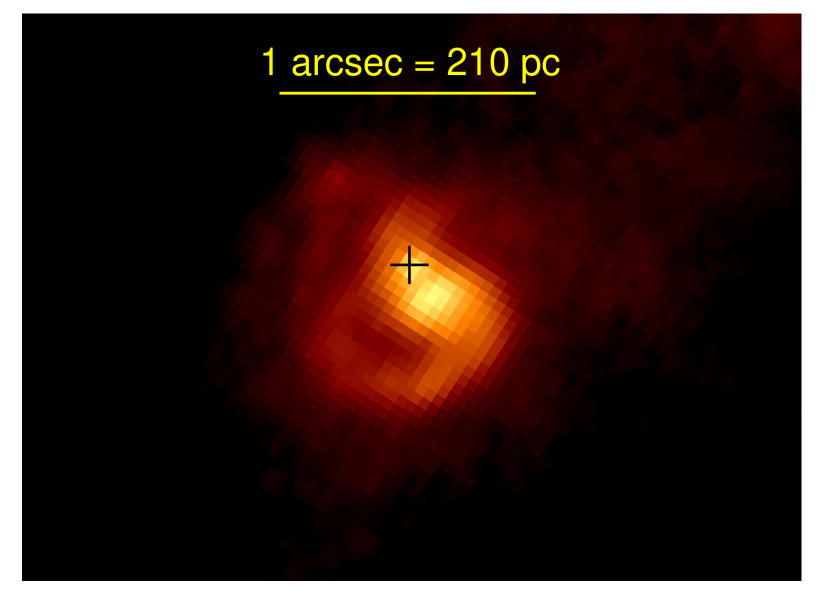
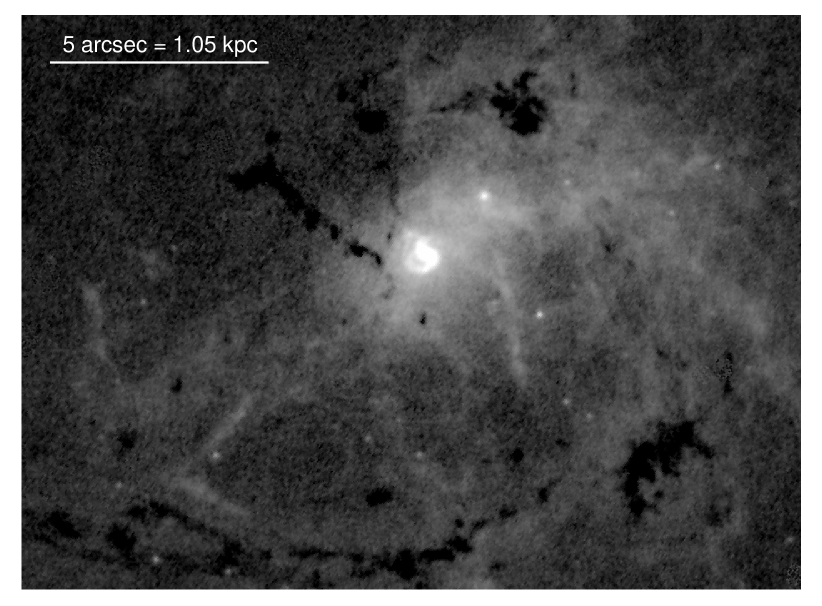
The HST imaging shows that the H emission peaks near the nucleus coincident with a swirling S-shape or total diameter 1 arcsec (210 pc), which presents a similar aspect to that of the much larger filament system (Fig. 8). Most of the swirl lies just outside or within the Bondi radius and presumably indicates that the flow proceeds as a connected structure, rather than a chaotic rain of cold blobs (see Gaspari, Brighenti & Temi 2015) for hydrodynamic simulations of a blobby inflow). The total mass of gas in the stream, assuming a constant H to gas mass ratio, is about which must accrete slowly to match the accretion rate required by the radio source of about , where is the radiative efficiency in units of 0.1. (The free-fall time from the Bondi radius is about .) There is again the old problem (Fabian & Canizares 1988) of “why is the nucleus of many local massive ellipticals dead?” when there is sufficient gas to make them as active as quasars. This time it involves cold rather than hot gas.
The swirling structure strongly indicates that the gaseous atmosphere around the Bondi radius is slowly rotating and the filamentary appearance means that magnetic fields remain important. Angular momentum may stem the inflow at radii smaller than resolved here. It is possible that the hot phase in the inner few 100 pc participates in a giant advection-dominated accretion flow (ADAF: Narayan & Fabian 2011). Estimating the accretion rate when the gas is highly multiphase is difficult, but the region is not starved of cold gas, which forms the dominant component
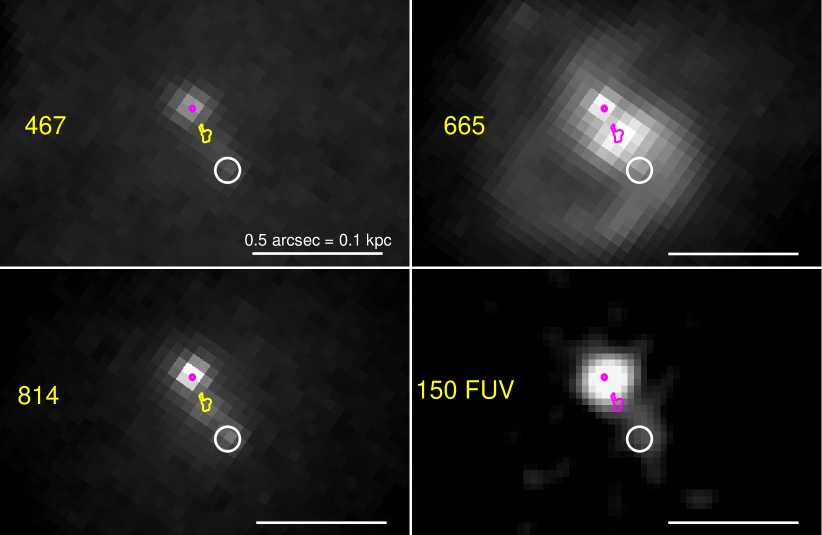
The H brightest patch coincides with a radio knot imaged by the VLBA (Fig. 9; Taylor et al 2006) and could be where the outgoing jet passes close to the gas stream. A continuation outward along the jet leads to a FUV source, which could be a synchrotron knot or hotspot in the jet. The jet structures explain the “double nucleus” reported earlier (Laine et al 2003) and the emission attributed to central star formation Tremblay et al (2015).
It should be possible to map the velocity of the swirling cold gas with the full array of ALMA or in the optical/IR band with adaptive optics or HST spectroscopy.
4 Discussion
HST imaging has resolved the dusty molecular filaments in NGC4696 to be about 60 pc in width, slightly less than the filaments around NGC1275 in the Perseus cluster. The surface brightness of the outer filaments appears to be constant on a half arcsec scale. The filaments near the centre appear brighter, possibly due to the overlap of filaments along our line of sight. Estimates of the magnetic field required to support the filaments as they are drawn out with the hot gas and against tidal forces indicate that they are in rough equipartition with the hot gas. Magnetic fields in the hot gas compatible with Faraday rotation measures from the extended radio source are about one third of this value.
The lack of star formation is probably due to the strong internal magnetic field (Fabian et al 2008). The critical surface density for gravitational instability in the presence of a magnetic field is given (Zweibel et al 1993) by ; for G this requires for collapse. The transverse column density in a filament is about 1.5 orders of magnitude lower than this value, so the filaments should be stable against gravitational collapse and subsequent star formation.
The hot gas in the central few kpc (Fig. 10) is multiphase with components detected around 1 keV, 0.5 keV and also 0.2 keV, by XMM spectroscopy and Chandra imaging. The ratios of the components are not compatible with a simple cooling flow, although a sporadic flow of a few may occur. There is however no sign of any star formation.
The HST imaging has resolved the Bondi radius of the central black hole where we find a large 100 pc radius swirl of gas. The surroundings of the swirl are also filamentary, suggesting that magnetic fields are dynamically important in the cold gas at all radii. The behaviour of the inner gas of this massive elliptical galaxy, and probably many other such galaxies, is mediated by strong magnetic fields in both the hot gas and the embedded cold, molecular, filaments.
Acknowledgements
ACF, SAW and HRR acknowledge support from ERC Advanced Grant FEEDBACK, 340442. The work is based on observations made with the NASA/ESA Hubble Space Telescope, obtained at the Space Telescope Science Institute, which is operated by the Association of Universities for Research in Astronomy, Inc., under NASA contract NAS 5-26555. These observations are associated with program 13821.
References
- [1] Bernardi M. et al, 2002, AJ, 123, 2990
- [2] Bolatto A.D., Wolfire M., Leroy A.K., ARAA. 51 207
- [3] Canning R.E.A. et al, 2011, MNRAS, 417, 3080
- [4] Chatzikos M. et al, 2015, MNRAS, 446, 1234
- [5] Crawford C.S., Hatch N.A., Fabian A.C., Sanders J.S., MNRAS, 353, 216
- [6] Churazov E., Ruszkowski M., Schekochihin A., 2014, MNRAS, 436, 526
- [7] Edge A.C., 2001, MNRAS, 328, 762
- [8] Fabian A.C., 2012, ARAA, 50, 455
- [9] Fabian A.C., Nulsen P.E.J, Atherton P.D., Taylor K., 1982, MNRAS, 201, 17
- [10] Fabian A.C, Canizares C.R., 1988, Nature, 333, 829
- [11] Fabian A.C. et al, 2008, Nature, 454, 968
- [12] Fabian A.C. et al, 2011, MNRAS, 417, 172
- [13] Ferland G.J. et al, 2009, MNRAS, 392, 1475
- [14] Gaspari M., F. Brighenti F., Temi P., 2015, A&A, 579, 62
- [15] Gillmon K., Sanders J.S., Fabian A.C., 2004, MNRAS, 348, 159.
- [16] Johnstone R.M. et al, 2007, MNRAS, 382, 1246
- [17] Kaneda H., Onaka T., Kitayama T., Okada Y., Sakon I., 2007, PASJ, 59
- [18] Laine S. et al, 2003, AJ, 125, 478
- [19] McConnell N.J., Ma G-P., 2013, ApJ, 764, 184
- [20] McKee C.F., Zweibel E.G., Goodman A.A., Heiles C., 1993, Protostars and Planets III, Eds E. H. Levy, J. I. Lunine; Univ.Arizona Press, 327
- [21] Mittal R. et al, 2011, MNRAS, 418, 2386)
- [22] Narayan R., Fabian A.C., 2011, MNRAS, 415, 3721
- [23] Panagoulia E.K., Fabian A.C., Sanders J.S., 2013, MNRAS, 433, 3290
- [24] Pinto C., et al., 2014, A&A, 572, L8 .
- [25] Salome P., Combes F., 2003, A&A, 412, 657
- [26] Sanders J.S. et al, 2008, MNRAS, 385, 1186
- [27] Sanders J.S. et al, 2016, MNRAS, 457, 82
- [28] Shobbrook R.R., 1963, Obs., 83, 36
- [29] Sparks W.B., Macchetto F., Golombek D., 1989, ApJ, 345, 153
- [30] Taylor G.B. et al, 2007, MNRAS, 382, 67
- [31] Taylor G.B., Sanders J.S., Fabian A.C., Allen S.W., 2006, MNRAS, 365, 705
- [32] Tremblay G.R. et al, 2015, MNRAS., 451, 3768
5 Appendix
5.1 HST Data reduction and Analysis
Fourteen observations of NGC 4696 were taken with HST, and these are listed in Table 1. We obtained 10.5 orbits using the redshifted H filter F665N, 2 orbits using the blue filter F467M, and half an orbit using the red filter F814W.The observations were all aligned using DrizzlePac 2.0 (drizzlepac.stsci.edu), which uses the positions of the stars in the images identified by TweakReg to match their coordinates. The 11 H images were then mosaicked together using astrodrizzle to produce the total H images. The two red band images were mosaicked in the same way.
We then removed the galaxy continuum from the H image to maximise the contrast of the H filaments. This was achieved by scaling a heavily-smoothed red band image (smoothing with a Gaussian kernel with a FWHM of 40 pixels) and subtracting it from the H image. Point sources were removed from the red band image before doing this, and replaced with random pixel values from neighbouring locations to ensure a smooth shape, matching the galaxy continuum shape in the H images to give Fig. 1.
| Dataset | Target Name | RA | Dec | Obs date | Exp time | Filter | Central Wavelength |
|---|---|---|---|---|---|---|---|
| ICLE02030 | NGC-4696 | 12:48:49.270 | -41:18:39.01 | 2015-04-27 | 2684.000 | F467M | 4682.594 |
| ICLE02020 | NGC-4696 | 12:48:49.270 | -41:18:39.01 | 2015-04-27 | 1155.000 | F814W | 8026.814 |
| ICLE02010 | NGC-4696 | 12:48:49.270 | -41:18:39.01 | 2015-04-27 | 1134.000 | F665N | 6655.850 |
| ICLE02040 | NGC-4696 | 12:48:49.270 | -41:18:39.01 | 2015-04-27 | 2684.000 | F467M | 4682.594 |
| ICLE01010 | NGC-4696 | 12:48:49.270 | -41:18:39.01 | 2015-06-24 | 2572.000 | F665N | 6655.850 |
| ICLE01020 | NGC-4696 | 12:48:49.270 | -41:18:39.01 | 2015-06-24 | 2684.000 | F665N | 6655.850 |
| ICLE01030 | NGC-4696 | 12:48:49.270 | -41:18:39.01 | 2015-06-24 | 2684.000 | F665N | 6655.850 |
| ICLE01050 | NGC-4696 | 12:48:49.270 | -41:18:39.01 | 2015-06-24 | 2684.000 | F665N | 6655.850 |
| ICLE01040 | NGC-4696 | 12:48:49.270 | -41:18:39.01 | 2015-06-24 | 2684.000 | F665N | 6655.850 |
| ICLE03030 | NGC-4696 | 12:48:49.270 | -41:18:39.01 | 2015-08-04 | 2684.000 | F665N | 6655.850 |
| ICLE03020 | NGC-4696 | 12:48:49.270 | -41:18:39.01 | 2015-08-04 | 2684.000 | F665N | 6655.850 |
| ICLE03040 | NGC-4696 | 12:48:49.270 | -41:18:39.01 | 2015-08-04 | 2684.000 | F665N | 6655.850 |
| ICLE03010 | NGC-4696 | 12:48:49.270 | -41:18:39.01 | 2015-08-03 | 2572.000 | F665N | 6655.850 |
| ICLE03050 | NGC-4696 | 12:48:49.270 | -41:18:39.01 | 2015-08-04 | 2684.000 | F665N | 6655.850 |
5.2 APEX CO
The observations used 2 hr of allocated time (about half on source) with an averaged system temperature of 200 K and primary beam size of 27 arcsec. We estimate a molecular mass assuming a luminosity distance of 44.3 Mpc and an CO(2-1)/CO(1-0) ratio of 0.7, using the following fit parameters (errors): Area 421.6 (123.0) mK km s-1; Line centre 39.0( 17.8) km s-1; Width 107.7 ( 33.1) km s-1; 3.68 mK.
The mass was derived by using a Milky Way conversion factor of (K km s-1 pc (Bolatto et al 2013).
5.3 XMM-Newton/RGS data reduction and modelling
The XMM-Newton RGS camera consists of two similar detectors, which have high spectral resolution between 6 and 38 Å. The data for observation ID=0406200101, which is the longest ( ks) on-axis pointing of NGC 4696 were reduced with the XMM-Newton Science Analysis System (SAS) v13.5.0 using the latest calibration files. Contamination from soft-proton flares was corrected following the XMM-SAS standard procedures. We processed the RGS data with the SAS task rgsproc and the MOS 1 data with emproc, respectively, in order to produce event files, spectra, and response. The total clean time was about ks s. The first-order RGS 1 and 2 spectra were extracted in a cross-dispersion region of 0.4 arcmin width centred on the emission peak (corresponding to 5 kpc). This was done within rgsproc by setting the xpsfincl mask to include 66 per cent of point-source events inside the spatial source extraction mask. The model background spectrum was created by rgsproc.
We fit the RGS 8-27 A (0.46-1.55 keV) spectra with the SPEX package; outside this energy band, the S/N ratio is too low. We bin the RGS spectra in channels equal to 1/3 of the PSF, and use C-statistics, because it provides the optimal spectral binning and avoids over-sampling.
The hot gas in NGC 4696 is multiphase and we first fit the RGS spectra with a combination of two components of gas in collisional ionization (two cie models in SPEX with and , i.e. and , respectively), both absorbed by Galactic absorption ( and corrected by redshift (). The emission-line broadening due to the spatial extent of the source was corrected by convolving the emission components by the lpro model in SPEX, which takes as input the MOS 1 source spatial profile.
We search for cooler gas through the O VII line triplet near 22A, which was recently discovered in a sample of nearby, bright, elliptical galaxies (Pinto et al 2014). This was done in two alternative ways: at first we add a third cie component (, i.e. ) to fit any line from cool gas including the O VII resonant (21.6A), intercombination (21.8A), and forbidden (22.1A) lines, also convolved by the spatial broadening (see Fig. 7). Alternatively, we tested two delta lines at the position of the O VII stronger (21.6A and 22.1A) lines, also convolved by the spatial broadening, but coupling their normalization to the value given by collisionally-ionized gas (R 21.6A/ 22.1A ). In both cases we obtain a detection significance above 3. The O VII lines can also be fitted with a cooling flow model providing a cooling rate of about . In all the spectral fits the abundances of N, O, Ne, Mg, Ca, Fe, and Ni were free to vary but coupled between the cie components; they range between 0.4x and 1.3x solar.