Micro-bubbles and Micro-particles are Not Faithful Tracers of Turbulent Acceleration
Abstract
We report on the Lagrangian statistics of acceleration of small (sub-Kolmogorov) bubbles and tracer particles with Stokes number St 1 in turbulent flow. At decreasing Reynolds number, the bubble accelerations show deviations from that of tracer particles, i.e. they deviate from the Heisenberg-Yaglom prediction and show a quicker decorrelation despite their small size and minute St. Using direct numerical simulations, we show that these effects arise due the drift of these particles through the turbulent flow. We theoretically predict this gravity-driven effect for developed isotropic turbulence, with the ratio of Stokes to Froude number or equivalently the particle drift-velocity governing the enhancement of acceleration variance and the reductions in correlation time and intermittency. Our predictions are in good agreement with experimental and numerical results. The present findings are relevant to a range of scenarios encompassing tiny bubbles and droplets that drift through the turbulent oceans and the atmosphere. They also question the common usage of micro-bubbles and micro-droplets as tracers in turbulence research.
Heavy and light particles caught up in turbulent flows often behave differently from fluid tracers. The reason for this is usually the particle’s inertia, which can drive them along trajectories that differ from those of the surrounding fluid elements Squires and Eaton (1991); Eaton and Fessler (1994); Toschi and Bodenschatz (2009); Bourgoin and Xu (2014). Due to their inertia, measured by the Stokes number St111Stokes number, , where is the particle response time, and is the Kolmogorov time scale of the flow., such particles depart from fluid streamlines and distribute nonhomogeneously even when the carrier flow is statistically homogeneous Wood et al. (2005); Mercado et al. (2010); Volk et al. (2008); Fiabane et al. (2012); Calzavarini et al. (2008a); Toschi and Bodenschatz (2009); Lohse (2008); Tanaka and Eaton (2008)). Numerical studies have captured several interesting effects of particle inertia through point-particle simulations in homogeneous isotropic turbulence Prakash et al. (2012); Volk et al. (2008); Cencini et al. (2006); Salazar and Collins (2012). For instance, with increasing inertia, light particles showed an initial increase in acceleration variance (up to a value times the tracer value) followed by a decrease, while heavy particles showed a monotonic trend of decreasing acceleration variance Calzavarini et al. (2009). Such modifications of acceleration statistics arose primarily from the slow temporal response of these inertial particles, i.e when St was finite Calzavarini et al. (2008b, a); Parishani et al. (2015); Ireland et al. (2015); Jung et al. (2008). In comparison, a lower limit of inertia can be imagined (St ), when the particles respond to even the quickest flow fluctuations and, hence, are often deemed good trackers of the turbulent flow regardless of their density ratio Toschi and Bodenschatz (2009); Calzavarini et al. (2009); Calzavarini et al. (2008b); Bec et al. (2006). The widespread use of small bubbles and droplets in flow visualization and particle tracking setups (e.g. Hydrogen bubble visualization and droplet-smoke-generators) is founded on this one assumption that St 1 renders a particle responsive to the fastest fluctuations of the flow Douady et al. (1991); Smith and Paxson (1983); Lu and Smith (1985); Holzner et al. (2008); Mercado et al. (2012).
In many practical situations, particles are subjected to body forces, typically gravitational or centrifugal Mazzitelli and Lohse (2004). This can be the case for rain droplets and aerosols settling through clouds, and tiny air bubbles and plankton drifting through the oceans Falkovich et al. (2002); Falkowski (2012). The effects of gravitational settling were first brought to light through numerical studies using random and cellular flow fields Maxey and Corrsin (1986); Maxey (1987a, b, 1990); Gustavsson et al. (2014). Their findings were instrumental in highlighting the role of gravity on the clustering and the enhancement of settling velocities of heavy particles in a flow. More recently, inertial effects on settling particles were analysed using direct numerical simulations of fully developed homogeneous isotropic turbulence Bec et al. (2014); Good et al. (2014); Chang et al. (2015); Parishani et al. (2015); Ireland et al. (2015). These revealed that gravity can lead to major modifications of particle clustering, relative velocity and pair statistics, which could be characterized as a function of St and the ratio of turbulent to gravitational acceleration: .
While the effects of gravity on particle settling velocity and clustering were shown to be significant Bec et al. (2014); Gustavsson et al. (2014), another crucial observable of Lagrangian turbulence is the particle’s acceleration statistics (variance, correlation and intermittency). Acceleration is important because its variance and time correlation are tightly linked to the energy dissipation rate, a quantity central to characterizing turbulent flows. Yet another feature unique to turbulent flows is the high level of intermittency, or deviations from Gaussian statistics. Acceleration flatness is key to quantifying this for turbulent flows. Therefore, a generic description of these quantities for rising and settling particles of arbitrary density is desirable.
In this Letter, we present the Lagrangian acceleration statistics of small air-bubbles and neutrally buoyant tracer particles in a turbulent water flow where the Taylor-Reynolds number Reλ is varied in the range . At decreasing Reλ the bubble accelerations show deviations compared to tracer particles, which occur despite their very small St (0.004 – 0.017) and small particle size. To explain these, we conduct DNS of particles in homogeneous isotropic turbulence, which reveals that the deviations arise due to the drift of these particles through the turbulent flow. We develop a generic theory that predicts these gravity-induced deviations for an arbitrary density particle, with the ratio St/Fr or equivalently the ratio of particle drift velocity to Kolmogorov velocity, as the relevant parameter controlling the deviations from ideal tracer behavior. Further, we provide insight into the modification of intermittency of particle acceleration arising due to gravity.
| Reλ | 134 | 153 | 188 | 263 | 301 |
|---|---|---|---|---|---|
| St | 0.004 | 0.005 | 0.008 | 0.011 | 0.017 |
| 0.0016 | 0.0026 | 0.0044 | 0.0072 | 0.0141 | |
| St/Fr | 4.899 | 4.159 | 3.498 | 2.953 | 2.363 |
The experiments were performed in the Twente Water Tunnel facility (TWT), in which an active grid generated nearly homogeneous and isotropic turbulence in the measurement section Mathai et al. (2015). The turbulent flow was characterized using hot-film anemometry technique at different Reλ (see Table 1). Small bubbles (m) were generated by blowing pressurized air through a porous ceramic plate. The particles were imaged using a high-speed camera (Photron PCI-1024) at a recording rate of 1000 fps. The camera moved on a traverse system, and illumination was provided using a 100 W Pulsed Laser (Litron LDY-303HE) (see Fig. 1 in supplemental material supplemental material available at URL. (2016)). Similar moving camera setups have been used with heavy particles in a wind tunnel Ayyalasomayajula et al. (2006), however, the tracking duration was short in those experiments. In the present case, we introduce a novel experimental modification, which allows for long particle trajectories to be recorded. We placed a mirror inside the tunnel at 45∘ inclination with the horizontal (see Fig. 1 in supplemental material supplemental material available at URL. (2016)). The laser beam was expanded into a volume, which was reflected vertically by the mirror. Obtaining the acceleration from position data requires accurate determination of higher derivatives. We have here combined the conventional Gaussian-kernel smoothening method with a smoothing-spline based technique Brown et al. (2009); Mathai et al. (2016) which eliminated biases due to a priori choice of filter windows and ensured reliable estimates of the acceleration.
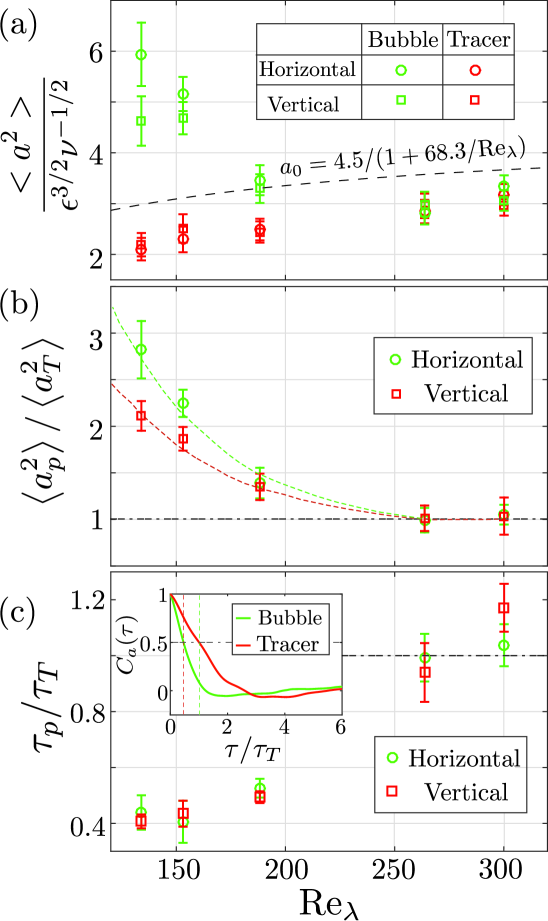
We first address the question of how the bubble accelerations compare to that of similar-sized neutrally buoyant particles at different Reλ. According to the prediction by Heisenberg and Yaglom La Porta et al. (2001), the single-component variance of acceleration should follow the relation , where is the dissipation rate, and the kinematic viscosity. In Fig 1(a), we plot the Heisenberg-Yaglom constant for bubbles along with that for tracer particles. At high Reλ, the bubbles behave similarly to tracers, with comparable . However, at low Reλ the bubbles show deviations from tracers, with an elevated . The horizontal acceleration shows the greatest deviation, with , while for the vertical component, at Re. For neutrally buoyant tracer particles, is lower, 2.1 at Re, and shows a marginal increase with Reλ. Thus, the horizontal component of the acceleration variance for bubbles is almost three times that of the tracer value at the lowest Reλ (see Fig. 1(b)). This is also reflected in the correlation time for bubbles (Fig. 1(c) & Inset), which is shorter compared to that of tracers. These deviations are surprising, since the lowest Reλ corresponds also to the smallest St in our experiments (see Table. 1).
From Fig 1(b), we also note that the vertical component of acceleration is consistently lower as compared to the horizontal one. This anisotropy is not inherent in the carrier flow Poorte and Biesheuvel (2002) and therefore suggests the role of gravity Maxey (1987a). We note that with decreasing Reλ, the ratio of turbulent to gravitational acceleration, , decreases in our experiments (Table. 1). In order to investigate this effect in a systematic way, we perform DNS of homogeneous isotropic turbulence at Re in the presence of gravity. For the particles, we use a model considering a dilute suspension of passively advected point-spheres acted upon by inertial and viscous (Stokes drag) forces (see supplemental material supplemental material available at URL. (2016)). We neglect lift, history and finite-size Faxén forces, since these are verified to be negligible in the point particle limit Calzavarini et al. (2009, 2012). The model equation of motion for a small inertial particle advected by a fluid flow field, (), may be written as:
| (1) |
where and are the fluid and particle mass densities, respectively, is the particle diameter, and is the unit vector in the direction of gravity. The particles under consideration are buoyant () and have very small Stokes number (). We vary the gravity intensity for these particles, resulting in a range of values for , according to the Froude number definition in Bec et al. (2014); Ireland et al. (2015). We first address the case of bubbles ( in Fig. 2) at various strengths of . With increasing , we recover the trends observed in our experiments, i.e. the bubble acceleration variance increases. Gravity enhances the acceleration in both vertical and horizontal directions, and this is accompanied by a decrease in correlation time (see supplemental material supplemental material available at URL. (2016)).
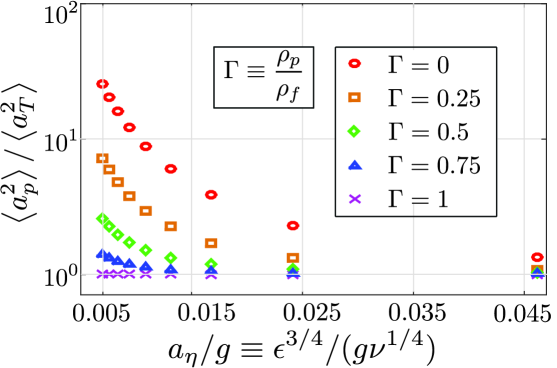
Fig. 2 clearly demonstrates the role of gravity in enhancing the particle’s acceleration variance. At the same time, we note that the degree of enhancement diminishes with growing even at fixed . Also, the effect of gravity on appears more pronounced in our simulations (see Fig. 1(b)) and Table 1). Thus, the Froude number, if defined as Bec et al. (2014); Ireland et al. (2015), can only give a qualitative prediction of the gravity effect. An exact prediction for an arbitrary-density particle is missing.
For a better appreciation of the contribution of gravity to the particle dynamics, we non-dimensionalize eq. (1) in terms of the Kolmogorov length and time scales . We obtain
| (2) |
where St is the Stokes number and is a buoyancy-corrected Froude number that takes the particle density, through , into account. In this situation, two important small-Stokes limits may be considered Maxey (1987a); Parishani et al. (2015). At high turbulence intensities (Fr ), the third term on the right-hand-side of eq. (2) may be neglected. This leads to the well known result for particle acceleration, where is the fluid tracer acceleration. However, for small Fr, the small St limit leads to the result for particle acceleration. By employing results from homogeneous isotropic turbulence (see supplemental material supplemental material available at URL. (2016)), one obtains the following relations linking the acceleration variance of particles to that of the fluid tracer:
| (3) | |||||
| (4) |
where and are the horizontal and vertical accelerations, respectively, for an arbitrary-density particle, is the tracer particle acceleration, and and represent the horizontal and vertical directions, respectively.
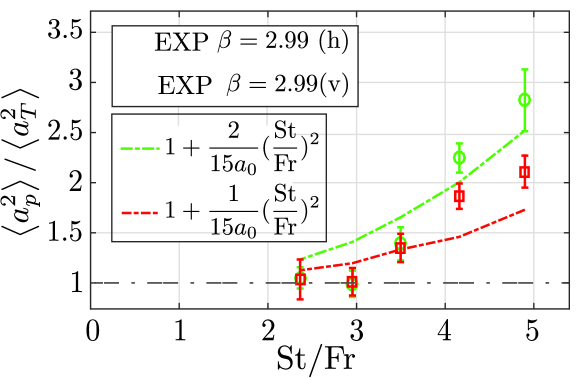
In Fig. 3, we compare the normalized acceleration variance vs St/Fr from experiment with our theoretical predictions (eq. (3) & (4)). The dashed lines show the theoretical predictions using the from the present experiments (Fig. 1(a)). The experimental data-points are in reasonable agreement with our predictions. Therefore, the apparent Reλ dependence that was seen in our water tunnel experiments (Fig. 1) is in fact a St/Fr effect, since the St/Fr increases with decreasing Reλ in our experiments (see Table 1).
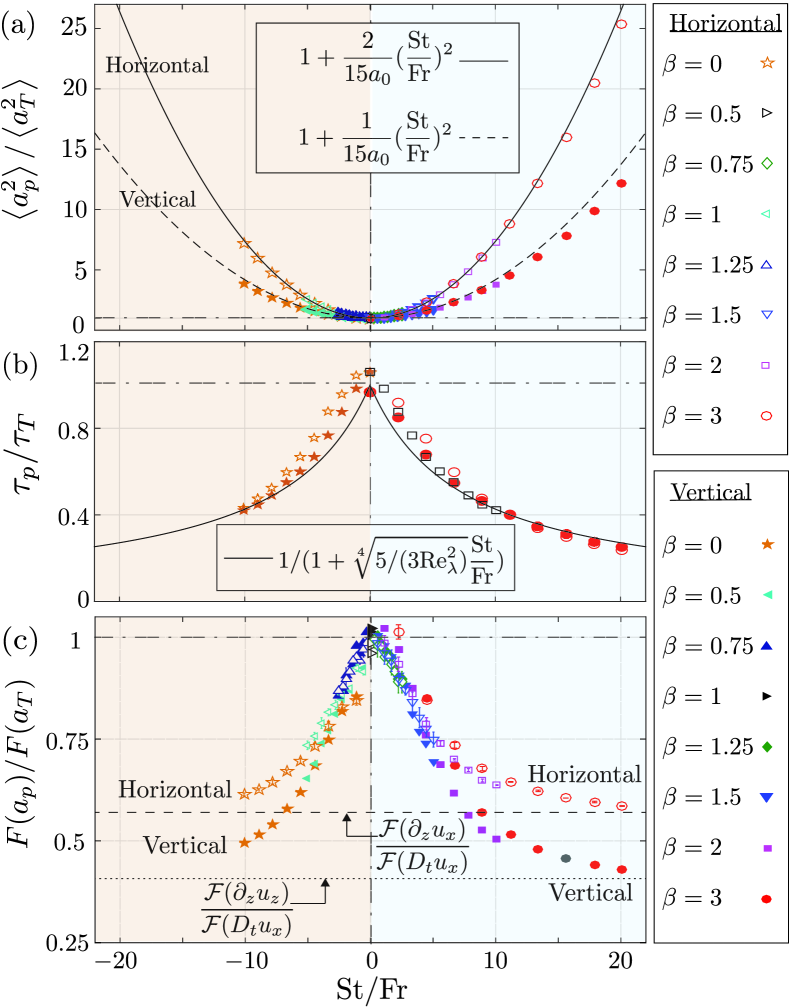
The present bubble-tracking experiments cover a narrow range of at fixed density-ratio (), while eq. (3) & (4) should be valid for arbitrary density-ratio. To test this, we compare the results of DNS for an extended range of density-ratios and . In Fig. 4(a), the left half () points to heavy particles, and the right one (), to buoyant particles. The predicted quadratic dependence on St/Fr and even the pre-factors and for the horizontal and vertical components, respectively, are in agreement with our simulations. We note that for sufficiently large Reynolds numbers, is practically constant La Porta et al. (2001), and the ratio St/Fr becomes the sole control parameter governing the enhancement of acceleration variance. Therefore, our results have broad applicability, to even large Reλ atmospheric and oceanic flows. In Fig. 4(b), we present the numerical results for the tracer-normalized correlation time in the presence of gravity. We propose a model for the correlation time based on the time a particle takes to cross an energetic eddy of the flow (see supplemental material supplemental material available at URL. (2016)). The model predicts a behavior of the form , where . The numerical results are in reasonable agreement with our predictions. Small deviations are noticeable in the small St/Fr range. In this range, the fluid acceleration dominates over the the velocity gradient . This explains the slower decline than what is predicted by our model in the small St/Fr range (see supplemental material supplemental material available at URL. (2016)). We also notice that the horizontal component (hollow symbols) is slightly higher that the vertical one (solid symbols) in the small St/Fr range. This is because the transverse velocity gradients are longer correlated than the longitudinal velocity gradients (see supplemental material supplemental material available at URL. (2016)).
While the effects of gravity on acceleration variance and correlation time have been comprehensively demonstrated, its role on the intermittency of particle acceleration is not clear. Intermittency, i.e. the observed strong deviations from Gaussianity, can be characterized in terms of the flatness of acceleration . Assuming statistical independence between and , we obtain the tracer-normalized flatness of the particle acceleration, , as a decreasing function of St/Fr (see supplemental material supplemental material available at URL. (2016)). At large St/Fr, we asymptotically approach the limits
| (5) | |||||
| (6) |
It is verified that Ishihara et al. (2007). This leads to the prediction , i.e. vertical acceleration is less intermittent as compared to the horizontal one. In Fig. 4(c), we present the normalized flatness factor from our simulations for an extended () range. decreases for both buoyant and heavy particles, and the curves asymptotically reach the limits suggested by eq. (5) & (6). The present findings showcase the first evidence of intermittency reduction even for small St particles in turbulence.
Our results show that acceleration statistics (variance, correlation, and intermittency) is very sensitive to the ratio St/Fr. To explain the origin of these in physical terms, we consider the case of a particle drifting through a turbulent flow. As the particle drifts through the flow, it meets different eddies. Owing to its short response time, the particle readjusts to the velocity of these eddies. The rate at which the particle readjusts to the new eddies is linked to the spatial velocity gradients of the turbulent flow. As a consequence, the particle experiences accelerations that the regular fluid element does not experience, thereby increasing its fluctuations (variance). The effect becomes prominent when the drifting time of the particle past the most energetic eddies (Taylor micro-scale eddies) becomes shorter than the timescale of these eddies of the flow, or when . This explains the scaling of the decorrelation time in Fig. 4(b) (see supplemental material supplemental material available at URL. (2016) for details).
The same physical mechanisms could explain the decline in intermittency of particle acceleration. A drifting particle, instead of probing the accelerations of fluid elements, begins to sample the spatial gradients of the flow. An interesting analogy may be drawn to the intermittency of acceleration recorded by a hot-wire probe placed in a high-speed wind/water tunnel flow, where the probe effectively registers only the spatial gradients Sandborn (1976). For a turbulent flow, the intermittency of the spatial gradients of velocity is lower as compared to the intermittency of the fluid element acceleration Ishihara et al. (2009); Toschi and Bodenschatz (2009). Hence the observed decline in intermittency, which asymptotically approaches the expressions given by eq. (5) and (6) in the limit of large St/Fr. This gravity effect will be important even for moderate Stokes number particles, and the same qualitative trends may be expected. However, a moderate St particle responds slower to the turbulent eddies it drifts through. Hence, we expect the gravity effect to be less prominent than that for the particles we presented here, and this will be the focus of a future investigation.
In summary, the acceleration statistics of small Stokes number particles in turbulence is greatly modified in the presence of gravity. We report three major effects: an increase in acceleration variance, a decrease in correlation time, and a reduction of intermittency for buoyant and heavy particles. The ratio governs the extent of this modification, as confirmed by our experiments using tiny air bubbles in water. Our theoretical predictions have broad validity – to particles of arbitrary density and even at large Reynolds numbers. Thus, a tiny bubble or droplet is not necessarily a good tracer of turbulent acceleration. This can be important for bubbles and droplets that drift through the turbulent oceans () and clouds () Devenish et al. (2012). On the practical side, our findings point to an important consideration when choosing bubbles or droplets for flow visualization and particle tracking in turbulent flows Douady et al. (1991).
We gratefully acknowledge A. Prosperetti, S. S. Ray, G. D. Jin, S. Wildeman, and S. Maheshwari for insightful discussions. We thank S. Huisman, X. Zhu, P. Shukla and V. N. Prakash for comments which helped improve our manuscript. We thank the two anonymous referees for comments which helped improve our manuscript.
References
- Squires and Eaton (1991) K. D. Squires and J. K. Eaton, Phys. Fluids A 3, 1169 (1991).
- Eaton and Fessler (1994) J. K. Eaton and J. Fessler, Int. J. Mult. Flow 20, 169 (1994).
- Toschi and Bodenschatz (2009) F. Toschi and E. Bodenschatz, Annu. Rev. Fluid Mech. 41, 375 (2009).
- Bourgoin and Xu (2014) M. Bourgoin and H. Xu, New J. Phys. 16, 085010 (2014).
- Wood et al. (2005) A. Wood, W. Hwang, and J. Eaton, Int. J. Mult. Flow 31, 1220 (2005).
- Mercado et al. (2010) J. M. Mercado, D. C. Gomez, D. Van Gils, C. Sun, and D. Lohse, J. Fluid Mech. 650, 287 (2010).
- Volk et al. (2008) R. Volk, E. Calzavarini, G. Verhille, D. Lohse, N. Mordant, J.-F. Pinton, and F. Toschi, Physica D: Nonlinear Phenomena 237, 2084 (2008).
- Fiabane et al. (2012) L. Fiabane, R. Zimmermann, R. Volk, J.-F. Pinton, and M. Bourgoin, Phys. Rev. E 86, 035301 (2012).
- Calzavarini et al. (2008a) E. Calzavarini, M. Cencini, D. Lohse, and F. Toschi, Phys. Rev. Lett. 101, 084504 (2008a).
- Lohse (2008) D. Lohse, Physics 1, 18 (2008).
- Tanaka and Eaton (2008) T. Tanaka and J. K. Eaton, Phys. Rev. Lett. 101, 114502 (2008).
- Prakash et al. (2012) V. N. Prakash, Y. Tagawa, E. Calzavarini, J. M. Mercado, F. Toschi, D. Lohse, and C. Sun, New J. Phys. 14, 105017 (2012).
- Cencini et al. (2006) M. Cencini, J. Bec, L. Biferale, G. Boffetta, A. Celani, A. Lanotte, S. Musacchio, and F. Toschi, J. Turbulence p. N36 (2006).
- Salazar and Collins (2012) J. P. Salazar and L. R. Collins, Phys. Fluids 24, 083302 (2012).
- Calzavarini et al. (2009) E. Calzavarini, R. Volk, M. Bourgoin, E. Leveque, J. F. Pinton, and F. Toschi, J. Fluid Mech. 630, 179 (2009).
- Calzavarini et al. (2008b) E. Calzavarini, M. Kerscher, D. Lohse, and F. Toschi, J. Fluid Mech. 607, 13 (2008b).
- Parishani et al. (2015) H. Parishani, O. Ayala, B. Rosa, L.-P. Wang, and W. Grabowski, Phys. Fluids 27, 033304 (2015).
- Ireland et al. (2015) P. J. Ireland, A. D. Bragg, and L. R. Collins, arXiv preprint arXiv:1507.07022 (2015).
- Jung et al. (2008) J. Jung, K. Yeo, and C. Lee, Phys. Rev. E 77, 016307 (2008).
- Bec et al. (2006) J. Bec, L. Biferale, G. Boffetta, A. Celani, M. Cencini, A. Lanotte, S. Musacchio, and F. Toschi, J. Fluid Mech. 550, 349 (2006).
- Douady et al. (1991) S. Douady, Y. Couder, and M. Brachet, Phys. Rev. Lett. 67, 983 (1991).
- Smith and Paxson (1983) C. R. Smith and R. D. Paxson, Exp. Fluids 1, 43 (1983).
- Lu and Smith (1985) L. J. Lu and C. R. Smith, Exp. Fluids 3, 349 (1985).
- Holzner et al. (2008) M. Holzner, A. Liberzon, N. Nikitin, B. Lüthi, W. Kinzelbach, and A. Tsinober, J. Fluid Mech. 598, 465 (2008).
- Mercado et al. (2012) J. M. Mercado, V. N. Prakash, Y. Tagawa, C. Sun, and D. Lohse, Phys. Fluids 24, 055106 (2012).
- Mazzitelli and Lohse (2004) I. M. Mazzitelli and D. Lohse, New J. Phys. 6, 203 (2004).
- Falkovich et al. (2002) G. Falkovich, A. Fouxon, and M. Stepanov, Nature 419, 151 (2002).
- Falkowski (2012) P. Falkowski, Nature 483, S17 (2012).
- Maxey and Corrsin (1986) M. Maxey and S. Corrsin, J. Atm. Sci. 43, 1112 (1986).
- Maxey (1987a) M. Maxey, J. Fluid Mech. 174, 441 (1987a).
- Maxey (1987b) M. Maxey, Phys. Fluids 30, 1915 (1987b).
- Maxey (1990) M. Maxey, Phil. Trans. Royal Soc. London 333, 289 (1990).
- Gustavsson et al. (2014) K. Gustavsson, S. Vajedi, and B. Mehlig, Phys. Rev. Lett. 112, 214501 (2014).
- Bec et al. (2014) J. Bec, H. Homann, and S. S. Ray, Phys. Rev. Lett. 112, 184501 (2014).
- Good et al. (2014) G. Good, P. Ireland, G. Bewley, E. Bodenschatz, L. Collins, and Z. Warhaft, J. Fluid Mech. 759, R3 (2014).
- Chang et al. (2015) K. Chang, B. J. Malec, and R. A. Shaw, New J Phys. 17, 033010 (2015).
- Ni et al. (2012) R. Ni, S.-D. Huang, and K.-Q. Xia, J. Fluid Mech. 692, 395 (2012).
- Mathai et al. (2015) V. Mathai, V. N. Prakash, J. Brons, C. Sun, and D. Lohse, Phys. Rev. Lett. 115, 124501 (2015).
- supplemental material available at URL. (2016) supplemental material available at URL. (2016).
- Ayyalasomayajula et al. (2006) S. Ayyalasomayajula, A. Gylfason, L. R. Collins, E. Bodenschatz, and Z. Warhaft, Phys. Rev. Lett. 97, 144507 (2006).
- Brown et al. (2009) R. D. Brown, Z. Warhaft, and G. A. Voth, Phys. Rev. Lett. 103, 194501 (2009).
- Mathai et al. (2016) V. Mathai, M. W. Neut, E. P. van der Poel, and C. Sun, Exp. Fluids 57, 1 (2016).
- La Porta et al. (2001) A. La Porta, G. A. Voth, A. M. Crawford, J. Alexander, and E. Bodenschatz, Nature 409, 1017 (2001).
- Poorte and Biesheuvel (2002) R. Poorte and A. Biesheuvel, J. Fluid Mech. 461, 127 (2002).
- Calzavarini et al. (2012) E. Calzavarini, R. Volk, E. Leveque, J. F. Pinton, and F. Toschi, Physica (Amsterdam) 241D, 237 (2012).
- Ishihara et al. (2007) T. Ishihara, Y. Kaneda, M. Yokokawa, K. Itakura, and A. Uno, J. Fluid Mech. 592, 335 (2007).
- Sandborn (1976) V. Sandborn, AIAA Journal 14, 400 (1976).
- Ishihara et al. (2009) T. Ishihara, T. Gotoh, and Y. Kaneda, Annu. Rev. Fluid Mech. 41, 165 (2009).
- Devenish et al. (2012) B. Devenish, P. Bartello, J.-L. Brenguier, L. Collins, W. Grabowski, R. IJzermans, S. Malinowski, M. Reeks, J. Vassilicos, L.-P. Wang, et al., Quart. J. Royal Met. Soc. 138, 1401 (2012).