20xx Vol. 9 No. XX, 000–000
22institutetext: NAOC-TU Joint Center for Astrophysics, Lhasa 850000, China 33institutetext: \vs\noReceived [year] [month] [day]; accepted [year] [month] [day]
A multiwavelength study of the star forming HII region Sh2-82
Abstract
Based on a multiwavelength study, the interstellar medium and young stellar objects (YSOs) around the HII region Sh2-82 have been analyzed. Two molecular clumps were found from the archival data of the Galactic Ring Survey, and using the Two Micron All-Sky Survey catalog, we found two corresponding young clusters embedded in the molecular clumps. The very good relations between CO emission, infrared shells and YSOs suggest that it is probably a triggered star formation region from the expansion of Sh2-82. We further used the data from the Galactic Legacy Infrared Mid-Plane Survey Extraordinaire from Spitzer to study the YSOs within the two clumps, confirming star formation in this region. By spectral energy distribution fits to each YSO candidate with infrared access, we derived the slope of the initial mass function. Finally, comparing the HII region’s dynamical age and the fragmentation time of the molecular shell, we discard the “collect and collapse” process as being the triggering mechanism for YSO formation. Sh2-82 can be a mixture of other processes such as radiative-driven implosion and/or collisions with pre-existing clumps.
keywords:
ISM: clouds - nebulae: HII region - individual: Sh2-82 - stars: formation1 INTRODUCTIONS
Given that our own solar system probably formed in a massive cluster (Hester et al. 2004), knowledge of triggered star formation is necessary for understanding our own formation. Massive stars can strongly influence their surrounding environment via stellar winds, ionizing radiation and the expansion of HII regions. Since Elmegreen & Lada (1977) presented a mechanism for the sequential star formation of OB subgroups in molecular clouds, a number of mechanisms by which massive stars can affect the subsequent star formation around HII regions have been proposed. Two of the most studied mechanisms for triggering star formation in HII regions are “radiatively driven implosion” (RDI) (e.g. Lefloch & Lazareff 1994; Miao et al.2006; Miao et al. 2009) and “collect and collapse” (C&C) (Elmegreen & Lada 1977). In the RDI model, pre-existing molecular clumps in the cloud become surrounded on all sides by high-pressure ionized gas heated by UV radiation, leading to the formation of a cometary globule (Bertoldi & McKee 1990). A dense core will form in the cometary globule where star formation will finally take place. In the C&C model, a slow-moving D-type ionization front has an associated shock front that precedes the ionization front. Dense gas may pile up between the two fronts. Over a long time the compressed shocked layer becomes gravitationally unstable and fragments into dense clumps.
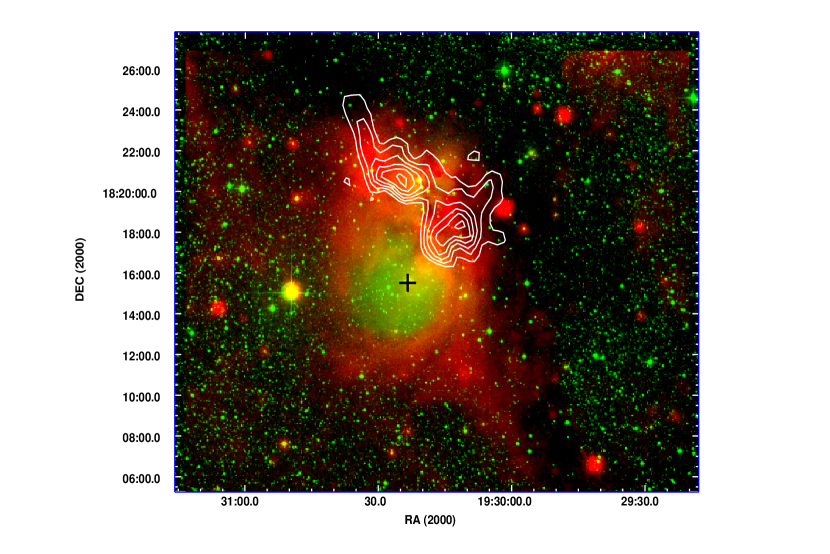
With the aim of increasing the observational evidence of triggered star formation in the surroundings of HII regions, we present a multiwavelength study of the molecular environment and YSOs of the HII region Sh2-82. Sh2-82 is ionized by HD 231616, a B0V/III star with a mass of 18 M⊙ (Hunter Massey 1990) (Fig.1). The distance of Sh2-82 can be estimated in several ways. Based on UBVRI photoelectric photometry, Lahulla (1985) derived a mean distance of 1.58 kpc, with the data ranging from 1.40 kpc to 1.80 kpc. From simulated B and V photometry formed through IIDS spectra of star(s), Hunter Massey (1990) derived the distance of the ionizing star in Sh2-82 to be 1.7 Kpc. According to the Galactic rotation model of Brand Blitz (1993) (with R⊙=8.2 kpc and ⊙=220 km s-1 ), we obtain a kinematic distance of either 2.1 kpc or 8.5 kpc. This ambiguity arises because we are studying a region in the first Galactic quadrant, where a given velocity may be associated with two possible distances. Considering that distances derived by photometry are more accurate than the other two methods, we use a distance of 1.8 0.4 kpc for Sh2-82 in the following discussion.
2 DATA SETS, REDUCTIONS, AND RESULTS
2.1 GRS
We analyzed the radio emission of 13CO (1-0) in the region of Sh2-82 using the Galactic Ring Survey (GRS; Jackson et al. 2006). The survey used the SEQUOIA multi pixel array on the Five College Radio Astronomy Observatory’s 14 m telescope to cover a longitude range of = 18∘55.7∘ and a latitude range of b 1∘, fully sampled with a pixel size of 22 arcsec from 1998 to 2005. The survey’s velocity coverage is -5 to 135 km s-1 for Galactic longitudes 40∘and -5 to 85 km s-1 for Galactic longitudes 40∘. The spectral resolution for both velocity ranges is 0.21 km s-1. The data cube was reduced with IDL procedures.
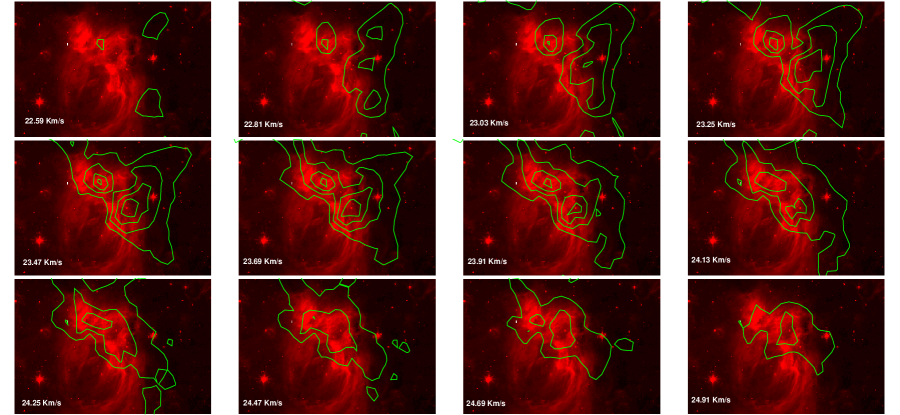
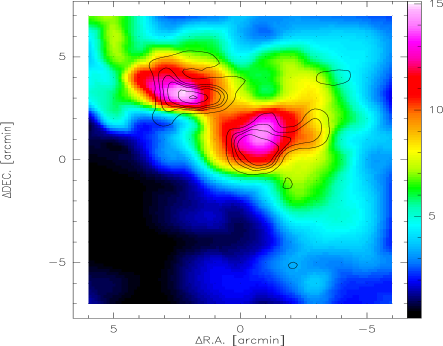
Figure 1 shows a distinctive ring morphology in the MSX A band detection. The 8.3m emission is dominated by intense line emission from polycyclic aromatic hydrocarbons (PAHs), arising at the interface between ionized gas in the HII region and the surrounding molecular material. We inspected the molecular gas around Sh2-82 from the GRS data in the whole velocity range and found an interesting feature around 24 km s-1 (figure 2). Two molecular clumps are evident on the northern photo dominated region (PDR) bordering Sh2-82. The very good correspondence between the HII region border traced by the IR emission and the molecular gas, strongly suggests that the observed molecular gas is associated with Sh2-82. We used the central velocity of the molecular gas to infer its kinematic distance.
Using the 13CO (1-0) line and under the assumption of local thermodynamic equilibrium (LTE), the H2 column density and the masses of the two clumps can be estimated. We use
| (1) |
to obtain the column density, where is the optical depth. We assume that the 13CO emission is optically thin, the excitation temperature Tex=20K and the solar abundance ratios [H2]/ [12CO] =104 and [CO]/ [13CO] =89(Wilson & Rood 1994). The molecular masses were obtained from
| (2) |
where D is the distance in pc and A is the solid angle in steradians. The masses we derived were 2400M⊙ and 8600M⊙, respectively, for the two clumps.
2.2 2MASS point sources
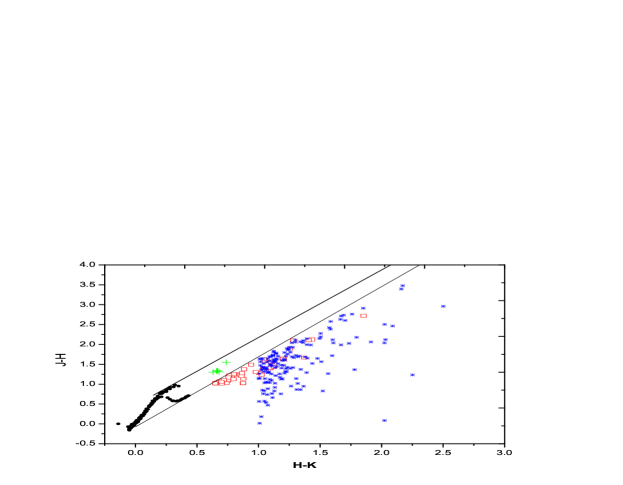
We searched the environment of Sh2-82 for IR star clusters to locate sites of recent star formation. Based on a sample of YSOs having low and intermediate masses, Kerton et al. (2008) inferred color criteria to analyze the presence of star formation activity in the surroundings of the HII region KR 140. Kerton et al. (2008) divided their YSO candidates into four groups (P1, P1+, P2, P3) according to different photometric qualities and the adopted color criteria. P1 sources have valid photometry in all three bands (i.e. ph qual values = A, B, C or D). The colour criteria are (J-H)1 and (J-H)-1.7(H-K)+0.0750. This approach selects stars lying below the reddening vector associated with an O6V star. P1+ sources also have valid photometry in all three bands. The color criteria are 1.3(J-H)1.6, (J-H)-1.7(H-K)+0.0750, (J-H)-1.7(H-K)-0.38050 and K14.5. This method selects YSOs lying in the overlapping region of T Tauri and main sequence stars. The P2 group has not been detected in the J band. Thus the actual position of P2 sources in the (J-H) axes should be towards higher values. The P2 color criteria are (J-H)-1.7(H-K)+0.0750 and (H-K)1.0. Sources belonging to the P3 group have J and H magnitudes that are lower limits, so their color (J-H) cannot be considered. The P3 color criterion is (H-K)1.0. Following such criteria, we searched for tracers of stellar formation activity in the 2MASS catalog, finding two YSO clusters associated with each molecular clump (Fig 4).
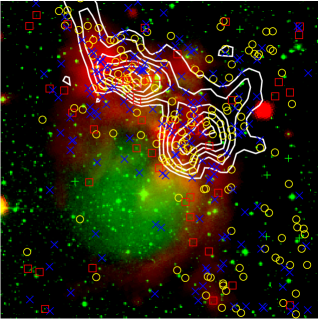
Figure 3 shows the color-color diagram for the YSO candidates. The two parallel lines are reddening vectors, assuming the interstellar reddening law of Rieke & Lebofsky (1985) (AJ / AV = 0.282; AH / AV = 0. 175; AK / AV = 0.112). Figure 4 shows the two young clusters embedded in the two molecular clumps.
2.3 Spitzer Data
The Galactic Legacy Infrared Mid-Plane Survey Extraordinaire (GLIMPSE I; Benjamin et al. 2003) covered the Galactic plane (10∘65∘, b1∘) with the four mid-IR bands (3.6, 4.5, 5.8, 8.0m) of the Infrared Array Camera (IRAC; Fazio et al. 2004) on the Spitzer Space Telescope. IRAC has a resolution of 1.5′′-1.9′′ (3.6-8.0m). In this region we used the highly reliable GLIMPSE I Catalogue with the sources detected in four bands (The highly reliable GLIMPSE I, II and 3D catalogs consists of point sources that are detected at least twice in one band with S/N 5, and at least once in an adjacent band). The GLIMPSE I Catalog also tabulates JHKS flux densities from the 2MASS point source catalogs (Skrutskie et al. 2006) for all GLIMPSE sources with 2MASS identifications.
MIPSGAL (Carey et al. 2005) is a legacy program covering the inner Galactic plane 10∘65∘, b1∘ at 24 and 70m with the Multiband Imaging Photometer on Spitzer (MIPS; Rieke et al. 2004). It has a resolution of 6′′ at 24m and 18′′ at 70m. MIPSGAL point-source catalogs were not yet available at the time of this study. For the 24m band, we used the APEX 1-Frame routines and the point response function (PRF) provided on the Spitzer Science Center’s web site to perform point-source PRF-fitting photometry. If an archive source was located within 2.4′′ of a 24m source, it was considered to have a 24m detection. For sources that APEX failed to detect automatically, we used the user list option in APEX to supply the coordinates for these sources to successfully derive a PSF fit.
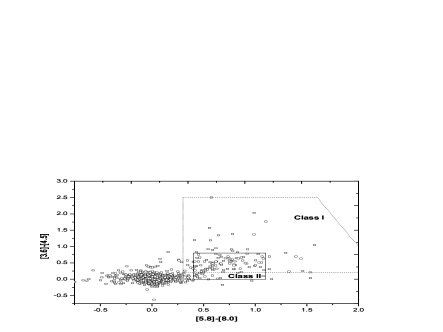
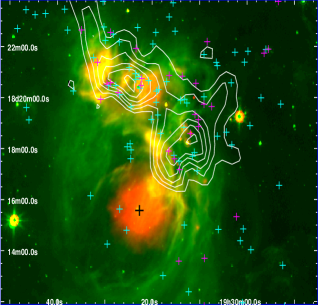
With highly reliable infrared detections, we can distinguish YSOs from normal stars, i.e. main-sequence, giant and supergiant stars, from their excess IR emission, as they are enshrouded in dust that absorbs stellar UV and optical radiation. The regions in the left image of figure 5 indicate stellar evolutionary stages based on the criteria described by Allen et al. (2004): Class I sources are protostars with interstellar envelopes and Class II sources are disk-dominated objects. However, background galaxies and evolved stars such as asymptotic giant branch (AGB) stars can also be red sources. In order to make a more pure YSO candidate sample, we removed star-formation (PAH) galaxies and weak-line AGNs via a series of cuts in the four-band IRAC color-color diagrams using the procedure developed by Gutermuth et al. (2008). The color criteria for both AGB stars and extragalactic contaminants from Harvey et al. (2006) were also used to filter our sample.
Figure 5 right image) shows the final distributions of both the Class I (magenta pluses) and Class II (cyan pluses) point sources around Sh2-82. It can be noted that most YSOs prefer to be located on the northwest corner of Sh2-82, and nearly all Class I sources are projected onto the molecular clumps. Since molecular clouds are birth places of stars, we expect some of these sources to be YSOs whose formation could have been triggered by the expansion of Sh2-82. We also perform a fitting of these YSO candidates in the IRAC and 2MASS bands to derive their spectral energy distribution (SED). We limit our study to the sources superimposed on the two molecular clumps. Briefly, the SED-fitting tool works as a regression method to find the SEDs within a specified 2 from a large grid of models after fitting the input data points. The grid of models contains stellar masses, disk masses, mass accretion rates, and line-of-sight (LOS) inclinations. The grid of the YSO models was computed by Robitaille et al. (2006) using the 20 000 two-dimensional radiation transfer models from Whitney et al. (2003a, 2003b, 2004). Each YSO model has SEDs for 10 viewing angles (inclinations), so the total YSO grid consists of 200 000 SEDs. Observations from the J-band to 24m are fitted using a 2-minimization technique. We consider sources with 2/Ndata 4 to be well fitted. Our results are listed in table 1.
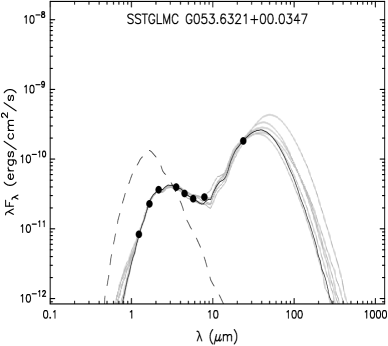
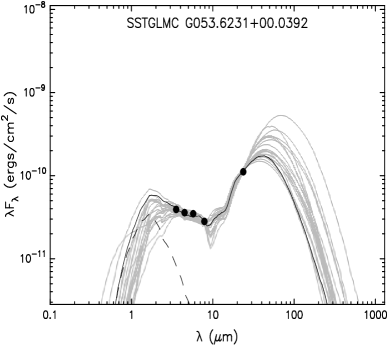
Figure 6 shows two examples of the SED fitting results. From these fits, we can see that there is a large infrared excess, which is inferred to be a planetary disk around the central stars (Wang & Hu, 1994). None of the selected YSO candidates were better fitted by a pure stellar photosphere model, confirming our YSO color selection criteria for this region.
| Source name | R.A.(J2000) | DEC(J2000) | M(M⊙) | 2 (total) | M(disk)(M⊙) | env(M⊙/yr) |
|---|---|---|---|---|---|---|
| SSTGLMC G053.6168+00.0448 | 292.5866 | 18.34431 | 3.72 | 5.65 | 2.15 10-4 | 0.00 |
| SSTGLMC G053.6209+00.0406 | 292.5926 | 18.34584 | 1.82 | 5.04 | 6.52 10-3 | 9.96 10-6 |
| SSTGLMC G053.6172+00.0377 | 292.5934 | 18.34121 | 7.49 | 18 | 4.52 10-2 | 5.56 10-5 |
| SSTGLMC G053.6160+00.0361 | 292.5942 | 18.33941 | 7.29 | 17.65 | 1.24 10-2 | 3.04 10-5 |
| SSTGLMC G053.6231+00.0392 | 292.595 | 18.34714 | 2.21 | 2.6 | 9.16 10-2 | 4.49 10-6 |
| SSTGLMC G053.6180+00.0352 | 292.596 | 18.34073 | 4.89 | 16.52 | 7.06 10-2 | 1.32 10-4 |
| SSTGLMC G053.6404+00.0458 | 292.5976 | 18.36544 | 1.22 | 0.5 | 9.16 10-4 | 9.01 10-6 |
| SSTGLMC G053.6227+00.0360 | 292.5977 | 18.34522 | 4.56 | 3.35 | 7.01 10-4 | 2.21 10-5 |
| SSTGLMC G053.6260+00.0374 | 292.5981 | 18.34881 | 1.22 | 8.03 | 1.25 10-2 | 1.1 10-5 |
| SSTGLMC G053.6089+00.0238 | 292.602 | 18.32729 | 3.36 | 5.58 | 1.28 10-3 | 1.06 10-5 |
| SSTGLMC G053.6321+00.0347 | 292.6036 | 18.35283 | 3.37 | 11.8 | 2.38 10-3 | 8.12 10-6 |
| SSTGLMC G053.6508+00.0357 | 292.6122 | 18.36969 | 1.41 | 9.20 | 6.95 10-4 | 1.86 10-5 |
| SSTGLMC G053.6222+00.0188 | 292.6134 | 18.33653 | 3.84 | 6.19 | 5.68 10-4 | 9.85 10-6 |
| SSTGLMC G053.6272+00.0194 | 292.6153 | 18.34119 | 4.63 | 13.93 | 1.10 10-3 | 1.43 10-7 |
| SSTGLMC G053.6576+00.0337 | 292.6175 | 18.37475 | 3.15 | 3.61 | 2.76 10-6 | 0.00 |
| SSTGLMC G053.6309+00.0165 | 292.6199 | 18.34309 | 5.43 | 9.91 | 4.47 10-4 | 4.15 10-4 |
| SSTGLMC G053.6300+00.0140 | 292.6217 | 18.34109 | 2.92 | 6.00 | 6.80 10-2 | 1.24 10-6 |
| SSTGLMC G053.6316+00.0134 | 292.6231 | 18.34215 | 0.17 | 3.56 | 1.81 10-2 | 4.73 10-6 |
| SSTGLMC G053.6572+00.0259 | 292.6245 | 18.37064 | 1.77 | 3.12 | 6.33 10-3 | 1.46 10-6 |
| SSTGLMC G053.6654+00.0291 | 292.6258 | 18.37940 | 1.32 | 5.81 | 3.84 10-4 | 7.25 10-8 |
| SSTGLMC G053.6253+00.0040 | 292.6285 | 18.33213 | 0.34 | 0.6 | 1.72 10-4 | 5.60 10-6 |
| SSTGLMC G053.6479+00.0133 | 292.6314 | 18.35639 | 5.3 | 6.99 | 3.08 10-2 | 3.46 10-4 |
| SSTGLMC G053.6520+00.0118 | 292.6349 | 18.35930 | 1.87 | 1.49 | 1.69 10-2 | 2.76 10-5 |
| SSTGLMC G053.6411-00.0133 | 292.6527 | 18.33765 | 1.83 | 8.47 | 1.38 10-3 | 5.63 10-5 |
| SSTGLMC G053.5813+00.0781 | 292.5379 | 18.32906 | 3.43 | 0.57 | 1.18 10-3 | 0.00 |
| SSTGLMC G053.5854+00.0803 | 292.5379 | 18.33374 | 0.27 | 1.12 | 2.89 10-3 | 5.78 10-6 |
| SSTGLMC G053.5706+00.0670 | 292.5427 | 18.31441 | 1.2 | 2.63 | 9.84 10-2 | 1.31 10-5 |
| SSTGLMC G053.5745+00.0690 | 292.5428 | 18.31878 | 0.52 | 3.13 | 2.70 10-3 | 3.86 10-6 |
| SSTGLMC G053.5790+00.0683 | 292.5457 | 18.32236 | 0.13 | 0.48 | 1.50 10-4 | 8.59 10-7 |
| SSTGLMC G053.5573+00.0559 | 292.5463 | 18.29744 | 1.31 | 5.07 | 4.79 10-2 | 1.79 10-6 |
| SSTGLMC G053.5560+00.0533 | 292.548 | 18.29500 | 2.09 | 9.22 | 2.261 10-3 | 5.19 10-6 |
| SSTGLMC G053.5888+00.0659 | 292.5529 | 18.32982 | 2.01 | 0.84 | 2.88 10-2 | 7.35 10-4 |
| SSTGLMC G053.5918+00.0654 | 292.5549 | 18.33224 | 2.16 | 2.85 | 5.10 10-4 | 2.73 10-5 |
| SSTGLMC G053.5760+00.0562 | 292.5554 | 18.31393 | 6.5 | 28 | 2.56 10-6 | 0.00 |
| SSTGLMC G053.5928+00.0622 | 292.5584 | 18.33156 | 2.49 | 2.43 | 1.33 10-2 | 8.37 10-6 |
| SSTGLMC G053.5535+00.0397 | 292.5593 | 18.28632 | 2.95 | 1.51 | 4.21 10-3 | 0.00 |
| SSTGLMC G053.5586+00.0419 | 292.5599 | 18.29182 | 3.21 | 2.00 | 1.45 10-1 | 1.13 10-4 |
| SSTGLMC G053.5640+00.0400 | 292.5643 | 18.29563 | 5.63 | 0.23 | 3.60 10-2 | 7.73 10-5 |
| SSTGLMC G053.5685+00.0375 | 292.5689 | 18.29842 | 5.65 | 2.23 | 2.62 10-3 | 1.25 10-5 |
| SSTGLMC G053.6090+00.0578 | 292.5707 | 18.34370 | 0.28 | 1.32 | 6.74 10-4 | 5.05 10-6 |
| SSTGLMC G053.5818+00.0372 | 292.5759 | 18.30991 | 3.34 | 8.59 | 2.34 10-3 | 2.55 10-5 |
| SSTGLMC G053.6078+00.0492 | 292.578 | 18.33848 | 1.03 | 5.36 | 2.11 10-4 | 6.46 10-6 |
| SSTGLMC G053.5935+00.0409 | 292.5784 | 18.32195 | 2.69 | 4.17 | 1.73 10-2 | 4.65 10-5 |
| SSTGLMC G053.6077+00.0474 | 292.5796 | 18.33759 | 0.42 | 2.27 | 2.05 10-2 | 1.93 10-4 |
| SSTGLMC G053.6014+00.0437 | 292.5799 | 18.33025 | 4.96 | 9.44 | 7.44 10-5 | 5.05 10-6 |
| SSTGLMC G053.5935+00.0347 | 292.5841 | 18.31903 | 4.02 | 16.71 | 6.17 10-3 | 3.40 10-8 |
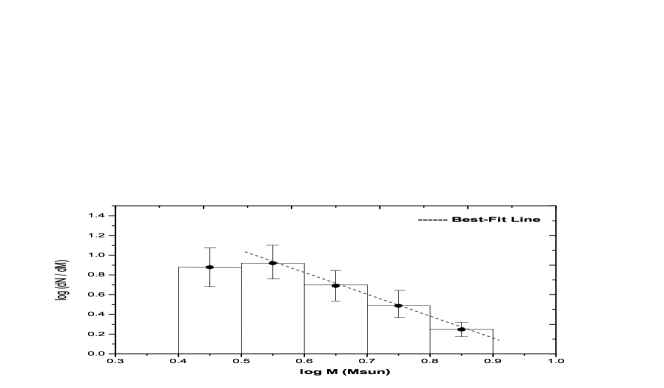
If we assume the following form of a mass function:
| (3) |
The distribution of masses of YSOs in Sh2-82 can be estimated. By studying M17, Povich et al. (2009) found that the GLIMPSE Point Source Archive recovers essentially all YSOs above 3M⊙ toward those regions. As is also apparent in figure 7, the deviation from a single power law becomes progressively worse in lower mass bin. Using the highest four mass bins (from 3.16M⊙ to 8M⊙) yields a slope of =2.21 0.45, which is approximately consistent with the classical value of 2.35 derived by Salpeter (1955) for the mass range 0.4M/M⊙10.
3 Discussion
Although Sh2-82 is seen at the edge of the pulsar wind nebula (PWN) G54.1+0.3, it is not related to the PWN, the center of which has a distance of at least 5kpc (Weisberg et al. 2008). G54.1+0.3 is likely to be at a distance of kpc due to the morphological association of the PWN with a CO molecular cloud at a velocity of km s-1, as revealed by high-resolution 13CO images(Leahy et al. 2008). We now discuss the likelihood of triggering star formation in Sh2-82. According to the model of Elmegreen & Lada (1977), a thin layer of compressed neutral material forms between a shock front and a slow-moving D-type ionization front. This may be the configuration observed in Sh2-82. In the triggering star-formation scenario, the ages of the ionizing star(s) must be older than the ages of the second generation stars plus the shock front traveling time. However, a problem with Elmegreen & Lada’s model concerns the ages and sizes of the HII regions.
Using the model described by Dyson Williams (1980), we calculate the dynamical age of the HII region at a given radius R as
| (4) |
where cs is the sound velocity in the ionized gas (cs=10 km s-1) and Rs is the radius of the Strömgren sphere given by Rs= (3Nuv/4n20B )1/3, where Nuv represents the Lyman continuum photons emitted by the ionizing star per second, and B = 2.6 10-13 cm3 s-1 is the hydrogen recombination coefficient. Sh2-82 is excited by a B0V star, which emits 1.251048 ionizing photons per second (Vacca et al. 1996; Schaerer de Koter 1997). The present radius of Sh2-82 could be calculated to be 2.20.5pc at a distance of 1.7 0.4kpc. We derived a dynamical age of between 0.25 and 0.48 Myr, assuming an original ambient density of (1 0.5) 103cm-3.
Whitworth et al. (1994,; hereafter W94) presented an analytical treatment of the collect-and-collapse process. A shock front forms and gathers material until it is able to fragment and collapse to form stars. The fragmentation time and radius can be calculated as:
| (5) |
| (6) |
where a0.2 is the sound speed inside the shocked layer in units of 0.2 km s-1, L49 is the central source ionizing flux in units of 1049photons s-1, and n3 is the initial gas number density in units of 103cm-3. Since we cannot calculate an appropriate value for a0.2 from our current data sets, we adopt a value of 1.0 as Koenig et al.(2008) did in the analysis of W5. We find that the fragmentation process in the periphery of Sh2-82 should occur between 1.6 and 5.3 Myr after its formation, a later point in time than its dynamical age derived above. We thus discard the so-called collect and collapse as being the mechanism responsible for YSO formation. Other processes such as radiative-driven implosions and/or collisions with pre-existing molecular core(s) may operate; we can see from figure 1 that the CO emission overlaps the densest part of the MSXA shell, which may be evidence of the radiation driven. Sh2-82 is not the only object; HII regions like Sh2-235 (Kirsanova et al. 2008), Sh2-217 and Sh2-219 (Deharveng et al. 2003) also show such physical processes of sequential star formation.
4 Summary
The interstellar medium and its young stellar objects around the HII region Sh2-82 have been analyzed. Two molecular clumps were found from the archival data of GRS. We found two young corresponding clusters with 2MASS embedded in the two molecular clumps. By using spectral energy distribution fitting to each of the YSO candidates with infrared access, we derived the mass function slopes in this region. Comparing the HII region dynamical age and the fragmentation time of the molecular shell, we discarded the so-called collect and collapse as being the triggering process for YSO formation. Sh2-82 can be a mixture of other processes such as radiative-driven implosion and/or collisions with pre-existing clumps. More numerical studies and deeper observations should be carried out in the future to reveal an even clearner picture of triggered star formation in HII regions.
Acknowledgement
This publication makes use of molecular line data from the Boston University-FCRAO Galactic Ring Survey (GRS). The GRS is a joint project between Boston University and the Five College Radio Astronomy Observatory, funded by the National Science Foundation under grants AST-9800334, AST-0098562, AST-0100793, AST-0228993, & AST-0507657. We are also grateful to the anonymous referee for whose constructive suggestions.
References
- Blitz et al. (1982) Allen, L. E., Calvet, N., D’Alessio, P., et al. 2004 ApJS, 154, 363
- Blitz et al. (1982) Benjamin, R. A., et al. 2003, PASP, 115,953
- Blitz et al. (1982) Bertoldi, F., McKee, C. F., 1990, ApJ, 354, 529
- Blitz et al. (1982) Brand, J., Blitz, L., 1993, A&A, 275,67
- Blitz et al. (1982) Carey, S. J., et al. 2005, in American Astronomical Society Meeting Abstracts, Bulletin of the American Astronomical Society, vol. 37, 1252
- Blitz et al. (1982) Deharveng, L., et al. 2003, A&A, 399, 1135
- Blitz et al. (1982) Dyson, J. E., Williams, D. A., 1980, The Physics of the Interstellar Medium (Manchester: Manchester Univ. Press)
- Blitz et al. (1982) Fazio, G. G., et al. 2004, ApJS, 154, 10
- Blitz et al. (1982) Gutermuth, R.A., et al. 2008, ApJ, 674, 336.
- Blitz et al. (1982) Harvey, P.M., et al. 2006, ApJ, 644, 307
- Blitz et al. (1982) Hester, J. J., Desch, S. J., Healy, K.R., Leshin, L. A. 2004, Science, 304, 1116
- Blitz et al. (1982) Hunter, D.A., Massey, P. 1990, AJ, 99, 846
- Blitz et al. (1982) Jackson, J. M., Rathborne, J. M., Shah, R. Y, et al. 2006, ApJS, 163,145
- Blitz et al. (1982) Kerton, C. R., Arvidsson K., Knee, L. B. G., Brunt, C., 2008, MNRAS, 385, 995
- Blitz et al. (1982) Kirsanova, M.S., Sobolev, A.M., Thomasson, M., et al. 2008, MNRAS, 388, 729
- Blitz et al. (1982) Koening, X. P., Allen, L. E., et al. 2008, ApJ, 688, 1142
- Blitz et al. (1982) Lahulla, J. F., 1985, A&AS, 61, 537
- Blitz et al. (1982) Leahy, D. A. Tian, W., Wang, Q. D., 2008. AJ, 136, 1477
- Blitz et al. (1982) Lefloch, B., Lazareff, B., 1994, A&A, 289, 559
- Blitz et al. (1982) Miao, J., White, G.J., Nelson, R., Thompson, M., Morgan, L., 2006, MNRAS, 369, 143
- Blitz et al. (1982) Miao, J., White, G.J., Thompson, M., Nelson, R., 2009, ApJ, 692,382
- Blitz et al. (1982) Povich, M. S., Churchwell, Ed., Bieging, J. H., et al. 2009, ApJ, 696, 1278
- Blitz et al. (1982) Rieke, G. H., et al. 2004, ApJs, 154, 25
- Blitz et al. (1982) Rieke, G. H., Lebofsky, M. J., 1985, ApJ, 288, 618
- Blitz et al. (1982) Robitaille, T. P., Whitney, B. A., Indebetouw, R., Wood, K., Denzmore, P., 2006, ApJS, 167, 256
- Blitz et al. (1982) Salpeter, E. E. 1955, ApJ, 121, 161
- Blitz et al. (1982) Schaerer, D., de Koter, A. 1997, A&A, 322, 598
- Blitz et al. (1982) Skrutskie, M. F., Cutri, R. M., Stiening, R., et al. 2006, AJ, 131, 1163
- Blitz et al. (1982) Vacca, W. D., Garmany, C. D., Shull, J. M., 1996, ApJ, 460, 914
- Blitz et al. (1982) Wang, J.J., Hu, J. Y., 1994, Chinese Astronomy and Astrophysics, 18, 67
- Blitz et al. (1982) Weisberg, J. M., et al. 2008, ApJ, 674, 286
- Blitz et al. (1982) Whitney, B. A., Indebetouw, R., Bjorkman, J.E., Wood, K., 2004, ApJ, 617, 1177
- Blitz et al. (1982) Whitney, B. A., Wood, K., Bjorkman, J. E., Cohen, M., 2003a, ApJ, 598, 1079
- Blitz et al. (1982) Whitney, B. A., Wood, K., Bjorkman, J. E., Wolff, M. J., 2003b, ApJ, 591, 1049
- Blitz et al. (1982) Whitworth, A. P., Bhattal, A. S., Chapman, S. J., Disney, M. J., Turner, J. A., 1994, MNRAS, 268, 291
- Blitz et al. (1982) Wilson,T.L., Rood, R.1994, ARA&A, 32,191