20xx Vol. 9 No. XX, 000–000
22institutetext: NAOC-TU Joint Center for Astrophysics, Lhasa 850000, China 33institutetext: \vs\noReceived [year] [month] [day]; accepted [year] [month] [day]
A multi-transition molecular line study of infrared dark cloud G331.71+00.59
Abstract
Using archive data from the Millimeter Astronomy Legacy Team Survey at 90 GHz (MALT90), carried out by Mopra 22-m telescope, we made a first multi-transition molecular line study of infrared dark cloud (IRDC) MSXDC G331.71+00.59. Two molecular cores were found embedded in this IRDC. Each of these cores is associated with a known ``extended green object" (EGO), indicating places of massive star formation. The HCO+ (1-0) and HNC (1-0) transitions show prominent blue or red asymmetric structures, suggesting outflow and inflow activities of young stellar objects (YSOs). Other detected molecule lines include H13CO+ (1-0), C2H (1-0), HC3N (10-9), HNCO(40,4-30,3), SiO (2-1) typical of hot cores and outflows. We regard the two EGOs are evolving from IRDC to hot cores. Using public GLIMPS data, we investigate the spectral energy distribution of EGO G331.71+0.60, supporting this EGO is a massive young stellar object (MYSO) driving outflow. G331.71+0.58 may be at an earlier evolutionary stage.
keywords:
stars: formations - ISM: outflows - ISM: molecules.1 INTRODUCTIONS
Infrared dark clouds (IRDCs) were first discovered in the mid 1990s by the two infrared satellites ISO (Perault et al. 1996) and MSX (Egan et al. 1998) as silhouettes against the bright mid-infrared Galactic background. Simon et al. (2006) identified 10931 candidate IRDCs based on the MSX 8 m data of the Galactic plane from = 0-360∘ and b 5∘. IRDCs are predominantly found in the first and fourth Galactic quadrants and near the Galactic mid-plane (Jackson et al. 2008), where the mid-infrared background is greatest. Molecular line and dust continuum studies of IRDCs have shown that they are cold (25 k), dense (n(H2) 105 cm-3, N(H2) 1022 cm-2), and massive ( 102 - 105 M⊙) structures with sizes of 1.15 pc. However, only small samples of the IRDCs originally published by Simon et al. (2006) have been investigated.
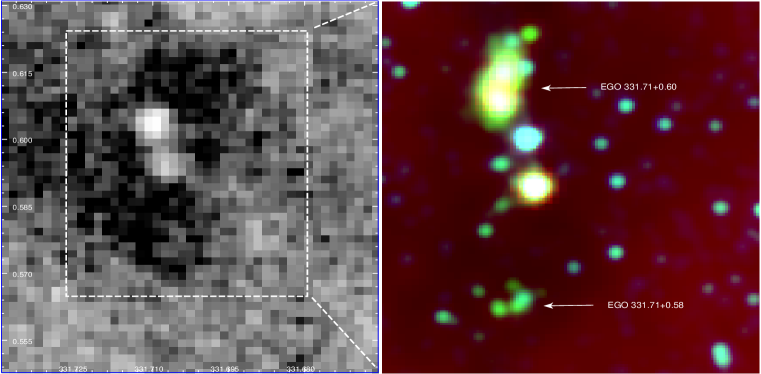
Cyganowski et al. (2008) identified more than 300 Galactic extended 4.5 m sources, naming extended green objects or ``green fuzzies'' for the common color coding of the 4.5 m band as green in Spitzer Infrared Array Camera (IRAC) three-color images. They have suggested that the 4.5 m IRAC band offers a promising new approach for identifying MYSOs with outflows as it is supposed to be due to H2 ( = 0-0, S (9, 10, 11)) lines and CO ( = 1-0) band heads (Reach et al. 2006). The majority of EGOs are associated with IRDCs. The infrared dark cloud MSXDC G331.71+00.59 (Fig.1) has almost never been studied even after it was found to be associated with two EGOs: G331.71+0.58 G331.71+0.60 (hereafter G0.58 G0.60). We here present the first molecular line study of this source. The distance of G331.71+00.59 is still unknown. According to the Galactic rotation model of Fich et al. (1989) (with R⊙=8.2 kpc and ⊙=220 km s-1 ), we obtain a kinematic distance of either 4.26 kpc or 10.70 kpc. This ambiguity arises because we are studying a region in the fourth Galactic quadrant, where a given velocity may be associated with two possible distances. As IRDCs are silhouettes against the Galactic background, we use the near distance of 4.26 kpc in the following analysis.
2 DATA
The Millimeter Astronomy Legacy Team 90 GHz survey is a large international project aimed at characterizing the sites within our Galaxy where high-mass stars will form. The survey covers a Galactic longitude range of -60 to 15∘ and Galactic latitude range of -1 to +1 ∘. The observations were carried out with the newly upgraded Mopra Spectrometer (MOPS). The full 8 GHz bandwidth of MOPS was split into 16 zoom bands of 138 MHz each providing a velocity resolution of 0.11 km s-1. The angular resolution of Mopra is about 38 arcsec, with beam efficiency between 0.49 at 86 GHz and 0.42 at 115 GHz (Ladd et al. 2005). The central frequencies of transitions we selected to study in the paper are shown in Table 1. More information about this survey can be found through the MALT90 website (http://malt90.bu.edu). The data processing was conducted using Gildas and line parameters (peak intensity, central velocity, FWHM) are obtained by Gaussian fitting.
To complement the molecular data we used data from Galactic Legacy Infrared Mid-Plane Survey Extraordinaire (GLIMPSE) survey of Spitzer to study young stellar object (YSO) in the region.
| Species | Transition | (GHz) | Primary Information Provided |
|---|---|---|---|
| HCO+ | (1-0) | 89.189 | High column density, kinematics |
| H13CO+ | (1-0) | 86.754 | High column density, optical depth |
| HNC | (1-0) | 90.663 | High column density, cold gas |
| HC3N | (10-9) | 91.200 | Hot core |
| HNCO | (40,4-30,3) | 87.925 | Hot core |
| C2H | (1-0) | 87.317 | Photodissociation region |
| SiO | (2-1) | 86.847 | Shock/outflow |
3 results and discussions
Figure 1 (left) shows MSX A band image of MSXDC G331.71+00.59. The locations of two EGOs are displayed on the right composite image of Spitzer: 3.6 m in blue, 4.5 m in green, 8.0 m in red. G0.60 shows a larger size than G0.58.
3.1 molecular lines
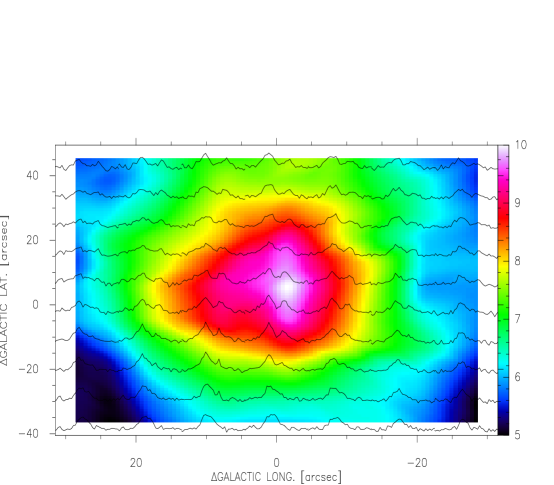
Figure 2 shows the molecular line spectra obtained towards G0.60 and G0.58 respectively. It is worth noting that a single-gaussian fit is insufficient for the optically thick molecular lines of HCO+ and HNC in the two sources that show prominent blue or red asymmetric structures. Blue asymmetric structure, named ``blue profile'', a combination of a double peak with a brighter blue peak or a skewed single blue peak in optically thick lines (Mardones et al. 1997)has been found in HCO+ lines. This blue line asymmetry in an optically thick tracer such as HCO+ is often suggestive of infall(i.e., Sun et al. 2008). Surely blue profile may also be caused by rotation and outflow. However, infall motion is the only process that would produce consistently the blue profile. Outflow and rotation only produce a blue asymmetric line profile along a particular line of sight to a source (Sun et al. 2008). Figure 4 shows mapping observation of HCO+ of G0.58. The mapping observation allows us to believe inflow activities in this region. G0.60 has the similar image and is omitted to be displayed here. Detections of optically thin line of H13CO+ help us to determine the central velocity referred to as the Local Standard of Rest, VLSR. The parameters determined from Gaussian fitting of these lines are presented in table 2. To quantify the blue profile, we further use an asymmetry parameter V defined as the difference between the peak velocity of an optically thick line V(thick) and an optically thin line V(thin) in units of the optically thin line FWHM (Full Width at Half Maximum) dV(thin): V = . Mardones et al. (1997) adopted a criterion V -0.25 to indicate blue profile. Our calculations demonstrate blue profile caused by inflow in this IRDC.


| Source | Emission | Tmb (K) | VLSR (km s-1) | FWHM (km s-1) |
|---|---|---|---|---|
| G0.60 | HCO+ | 3.07 0.08 | -69.66 0.06 | 2.38 0.16 |
| 1.52 0.05 | -64.96 0.13 | 2.88 0.31 | ||
| H13CO+ | 0.97 0.12 | -66.32 0.30 | 5.30 0.61 | |
| HNC | 3.18 0.06 | -69.06 0.05 | 2.66 0.13 | |
| 2.23 0.09 | -65.10 0.07 | 2.70 0.22 | ||
| C2H | 1.15 0.12 | -67.71 0.17 | 3.77 0.52 | |
| HC3N | 1.51 0.08 | -67.43 0.09 | 2.80 0.22 | |
| HNCO | 0.86 0.05 | -67.23 0.22 | 3.22 0.47 | |
| G0.58 | HCO+ | 2.62 0.40 | -69.56 0.10 | 3.87 0.34 |
| 2.06 0.20 | -65.41 0.11 | 2.14 0.26 | ||
| H13CO+ | 0.59 0.03 | -67.08 0.37 | 4.36 0.71 | |
| HNC | 1.93 0.20 | -68.81 0.36 | 4.05 0.77 | |
| 2.30 0.25 | -65.38 0.21 | 3.00 0.43 | ||
| C2H | 0.65 0.10 | -67.50 0.42 | 4.49 0.91 | |
| HC3N | 1.12 0.15 | -66.67 0.18 | 38.2 0.46 | |
| HNCO | 0.71 0.08 | -67.80 0.20 | 2.04 0.41 |
3.1.1 Column densities and masses
We derive the molecular column densities of HCO+ and hence masses in the region assuming optically thick HCO+ and optically thin H13CO+ lines and local thermodynamic equilibrium (LTE). We calculate the excitation temperature from
| (1) |
where 0 is the rest frequency, Tbg is temperature of the background radiation (2.73 K) and
| (2) |
We also assume the HCO+ and H13CO+ emission arises from the same gas and shares a common excitation temperature. The optical depth of the H13CO+ line may be found from
| (3) |
Then we use equations (2) and (5) in Purcell et al. (2006) to find the total H13CO+ column densities. Using M = mH d2 X(H13CO+)-1 N(H13CO+), we obtain the masses for the two cores, where N(H13CO+) is the H13CO+ column density, d the distance, mH the hydrogen atom mass. We adopt a mean molecular weight per H2 molecule of = 2.72 to include helium, is the area of the two cores. For H13CO+, we adopt an abundance of 2 10-10 relative to H2 (Vogel et al. 1984; Rawlings et al. 2004; Purcell et al. 2006; Klaasen Wilson 2007). Using the above methods we obtain for Tex 5.9 K and 5.6 K respectively. These values are considerably lower than the 15 K temperatures quoted in previous work and we conclude that the emission is beam diluted in a significant fraction of the observations. In the following analysis we have assumed an excitation temperature of 15 K for HCO+. The final results are listed in table 3. The high column densities suggest that massive stars are forming. Recent theoretical work predicts a mass column density threshold 1 g cm-2 for massive star formation (Krumholz McKee 2008; Krumholez et al. 2010).
| Source | Tex (HCO+) (K) | (H13CO+) | N (H13CO+) ( 1013 cm-2) | M ( 103M⊙) |
|---|---|---|---|---|
| G0.60 | 5.9 | 0.08 | 3.6 | 1.9 |
| G0.58 | 5.6 | 0.05 | 2.3 | 0.9 |
3.1.2 outflow
It should be noted that the central HNC spectra of G0.58 shows a ``red profile''. The origin of red profile could be caused by outflows or rotations of molecular gas. As EGOs are probably massive young stellar objects (MYSOs) driving outflows, outflow activities could exist in this region. Fig 5 presents the HNC (solid line), H13CO+ (dashed line) spectra towards the center of the G0.58 and G0.60. The line wings of HNC are obvious. The existence of outflow is further confirmed by position-velocity (PV) diagrams shown in figure 5.


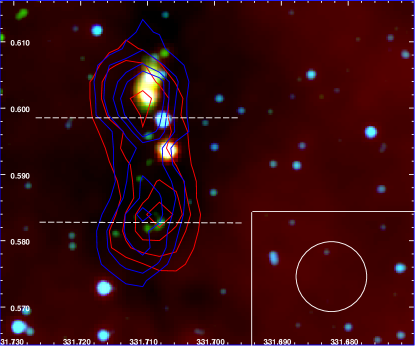
Figure 6 shows the map of the molecular outflow traced by the HNC line; plotted are the intensities integrated over the velocity ranges that are lower and high than the systematic velocity, i.e., red and blue shifted emission respectively. The red and blue contours represent blue and red lobes of the outflow. From the HNC map it can be noted that the lobes are nearly unresolved by our observations, and that high resolution is needed to determine parameters such as the collimation factor and inclination angles of the outflows. Assuming that HNC emission in the line wings to be optically thin, X(HNV) = [HNC]/[H2] = 10-8 (Turner et al. 1997) and Tex = hv0/k =4.36 K, we derive its column density from:
| (4) |
where 0, gu, gland Aul are the rest frequency, the upper and lower level degeneracies and the Einstein's coefficient of HNC, Q(Tex) is the partition function, and c is the speed of light. On the other hand, by assuming HNC emission is optically thin in the line wings, we use the approximation:
| (5) |
The derived parameters are shown in table 4.
| Source | Shift | (Km s-1) | N (HNC) ( 1013 cm-2) | M (M⊙) |
|---|---|---|---|---|
| G0.60 | red | (-66,-60) | 1.5 | 15.8 |
| blue | (-75,-69) | 1.3 | 13.7 | |
| G0.58 | red | (-66,-60) | 1.9 | 20.0 |
| blue | (-75,-69) | 1.1 | 11.6 |
3.1.3 other lines and SiO
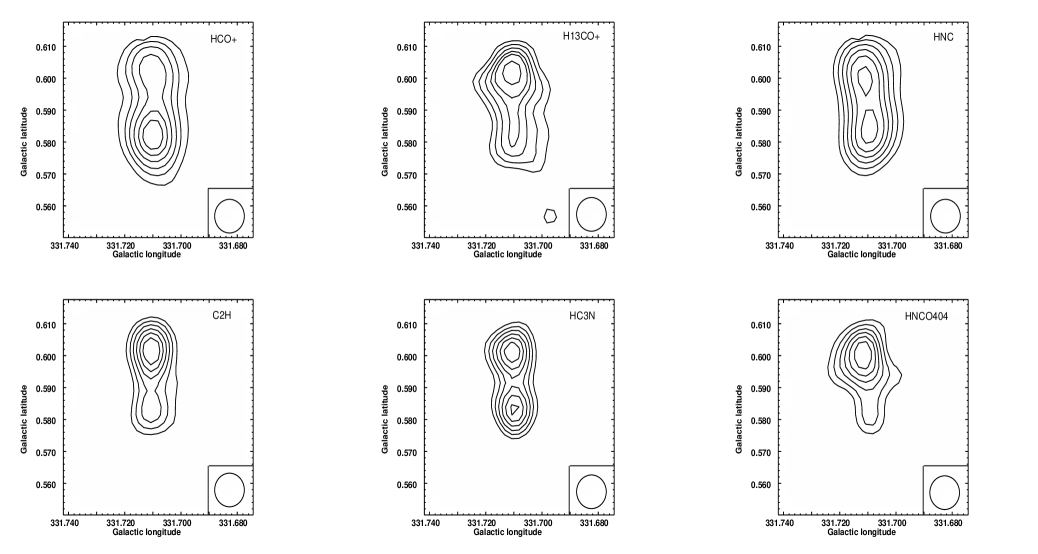
The ethynyl radical (C2H) was first detected in the interstellar clouds by Tucker et al. (1974). Observations indicate that C2H is produced in photodissociation regions (e.g., Lo et al. 2009; Gerin et al. 2011) and almost omnipresent toward evolutionary stages from infrared dark clouds (IRDC) via high-mass protostellar objects (HMPO) to ultracompact HII regions (UCHII) (Huggins et al. 1984; Beuther et al. 2008). The stronger emission of C2H in G0.60 than G0.58 (figure 3) suggests G0.58 to be in an earlier evolutionary stage. This was further confirmed by carbon-bearing species HNCO, which is typically only seen in the hot cores around high-mass protostars once molecule has been liberated off dust grains by radiation or shocks (Brown et al. 1988). HC3N is an excellent dense gas tracer (Chung et al. 1991; Bergin et al. 1996) as it has high electric dipole moments ( = 3.72 Debye). It is also a tracer of hot core because it can be easily destroyed by ultraviolet (UV) photons from central ionizing stars (Brown et al. 1988). Thus we regard the two EGOs are evolving from IRDC to hot cores.
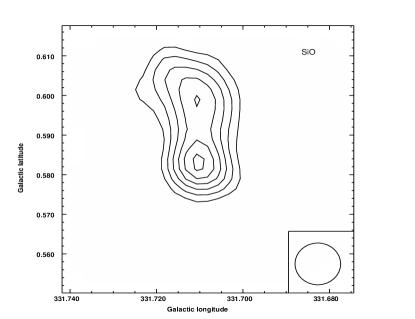
SiO is known to be greatly enhanced in outflows and shocked regions (Martin - Pintado, Bachiller Fuente 1992) since in the general interstellar medium Si is frozen out onto dust grains. When the gas in a region is shocked, for example the gas through which a protostellar outflow is passing or due to the expanding of photodissociation region (PDR), the dust grains can sublimate and Si is released into the gas phase. Models and observations of SiO in PDRs around high massive star formation regions suggest moderate SiO enhancement. Schilke et al. (2001) find SiO column densities of 1012 cm-2 in their observed PDRs. Again, by assuming SiO is optically thin and LTE, we calculated the column density as the method described in section 3.1.2. The high SiO column densities (12.2 1014 cm-2 for G0.60 and 18.6 1014 cm-2 for G0.58 ) suggest that the SiO emission we observed does come primarily from outflow shocks. The large line width of SiO ( 10 km s-1) further supports our suggestions. Figure 7 shows the integrated intensity map of SiO and spectra towards the center of G0.60 and G0.58.

3.2 spectral energy distribution
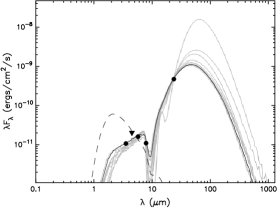
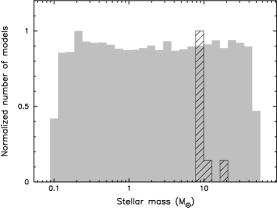
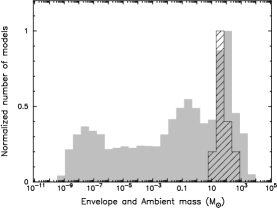
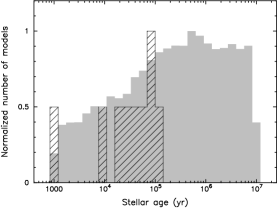
According to Cyganowski et al. (2008), the mid-IR colors of EGOs lie in regions of color-color diagram (CCD) occupied by young protostars still embedded in infalling envelopes. In this section, we try to fit the spectral energy distribution (SED) of these two EGOs using the tool developed by Robitaille et al. (2007). Briefly, the SED-fitting tool works as a regression method to find the SEDs within a specified 2 from a large grid of models after fitting the input data points. The grid of models contains stellar masses, disk masses, mass accretion rates, and line-of-sight (LOS) inclinations. The grid of YSO models was computed by Robitaille et al. (2006) using the 20,000 two-dimensional radiation transfer models from Whitney et al. (2003a, 2003b, 2004). Each YSO model has SEDs for 10 viewing angles (inclinations), so the total YSO grid consists of 200,000 SEDs. We use the fluxes in the four Spitzer IRAC bands and MIPS in 24 m from Cyganowski et al. (2008). The 4.5 m band is used as an upper limit, considering it is blended with emissions from outflows. The up left panel in figure 8 shows the SEDs of the 20 best fitting models of G0.60. The solid black line represents the best fitting model from which we obtain a central mass of 10 M⊙. The SED fitting result of G0.58 is not good enough, due to large errors in 5.8 m and 8.0 m (Cyganowski et al. 2008). Figure 8 also presents the histograms with the distribution of the constrained physical parameters. The hashed columns represent the 20 best fitting models and the gray columns correspond to all the models of the grid. Although there is a high dispersion in the age, the presence of a massive envelope is a strong evidence that the source is at an early evolutionary stage. We note that MYSO(s) is forming in G0.60.
4 summary
Using archive data from the MALT90, we made a first multi-transition molecular line study of infrared dark cloud (IRDC) MSXDC G331.71+00.59, where two EGOs embedded. Two molecular cores were found to be associated with these EGOs. The HCO+ (1-0) and HNC (1-0) transitions show outflow and/or inflow activities of young stellar objects. By the analysis of other molecules include H13CO+ (1-0), C2H (1-0), HC3N (10-9), HNCO(40,4-30,3) we regard the two EGOs are evolving from IRDC to hot cores. Using public GLIMPS data, we investigate the spectral energy distribution of EGO G331.71+0.60, supporting EGO is a massive young stellar stellar object (MYSO) driving outflows.EGO G331.71+0.58 may be in an earlier evolutionary stage. Moreover, given its location in sky, G331.71+0.58 will easily be accessible in the near future for high linear resolution studies with ALMA.
Acknowledgement
We thank the MALT90 project team for the observations. We are also grateful to the anonymous referee for whose constructive suggestions.
References
- Blitz et al. (1982) Bergin, E. A., Snell, R. L., Goldsmith, P. F. 1996, ApJ, 460, 343
- Blitz et al. (1982) Beuther, H., Semenov, D., Henning, T., Linz, H. 2008, ApJ, 675, L33
- Blitz et al. (1982) Brown, P. D., Charnley, S. B., Millar, T. J. 1988, MNRAS, 231, 409
- Blitz et al. (1982) Chung, H. S., Kameya, O., Morimoto, M. 1991, JKAS, 24, 217
- Blitz et al. (1982) Cyganowski, C. J., Whitney, B. A., Holden, E., et al. 2008, AJ, 136, 2391
- Blitz et al. (1982) Egan, M. P., Shipman, R. F., Price, S. D., Carey, S. J., Clark, F. O., Cohen, M., 1998, ApJ, 494, L199
- Blitz et al. (1982) Fich, M., Blitz, L., Stark, A. A., 1989, ApJ,
- Blitz et al. (1982) Gerin, M., Kamierczak, M., Jastrzebska, M., et al. 2011, A&A, 525, A116+
- Blitz et al. (1982) Huggins, P. J., Carlson, W. J., Kinney, A. L. 1984, A&A, 133, 347
- Blitz et al. (1982) Jackson, J.M., Finn, S.C., Rathborne, J.M., Chambers, E.T., Simon, R., 2008, ApJ, 680, 349
- Blitz et al. (1982) Klaassen, P.D., Wilson, C.D., 2007, ApJ, 663, 1092
- Blitz et al. (1982) Krumholz, M.R., Cunningham, A.J., Klein, R.I., McKee, C.F., 2010, ApJ, 713, 1120
- Blitz et al. (1982) Krumholz, M.R., McKee, C.F., 2008, Nature, 451, 1082
- Blitz et al. (1982) Ladd, N., Purcell, C., Wong, T., & Robertson, S. 2005, PASA, 22, 62
- Blitz et al. (1982) Lo, N., Cunningham, M. R., Jones, P. A., et al. 2009, MNRAS, 395, 1021
- Blitz et al. (1982) Mardones, D., Myers, P. C., Tafalla, M. et al. 1997, ApJ, 489, 719
- Blitz et al. (1982) Martin - Pintado, J., Bachiller, R., Fuente, A., 1992, A&A, 254, 315
- Blitz et al. (1982) Perault, M., Omont, A., Simon, G. et al., 1996, A&A, 315, L165
- Blitz et al. (1982) Purcell, C. R., Balasubramanyam, R., Burton, M. G., et al., 2006, MNRAS, 367, 553
- Blitz et al. (1982) Rawlings, J.M.C., Redman, M.P., Keto, E., Williams, D.A., 2004, MNRAS, 351, 1054
- Blitz et al. (1982) Reach, W.T., et al. 2006, AJ, 131, 1479
- Blitz et al. (1982) Robitaille, T. P., Whitney, B. A., Indebetouw, R., Wood, K., 2007, ApJS, 169, 328
- Blitz et al. (1982) Robitaille, T. P., Whitney, B. A., Indebetouw, R., Wood, K., Denzmore, P., 2006, ApJS, 167, 256
- Blitz et al. (1982) Schilke, P., Pineau des Forts, G., Walmsley, C.M., et al., 2001, A&A, 372, 291
- Blitz et al. (1982) Simon R., Jackson J.M., Rathborne J.M., Chambers E.T., 2006, ApJ, 639, 227
- Blitz et al. (1982) Sun Yan, Gao Yu, 2009, MNRAS, 392, 170
- Blitz et al. (1982) Tucker, K. D., Kutner, M. L., Thaddeus, P. 1974, ApJ, 193, L115
- Blitz et al. (1982) Turner, B.E., Pirogov, L., Minh, Y.C., 1997, ApJ, 483, 235
- Blitz et al. (1982) Vogel, S.N., Wright, M.C.H., Plambeck, R.L., Welch, W.J., 1984, ApJ, 283, 655
- Blitz et al. (1982) Whitney, B. A., Indebetouw, R., Bjorkman, J.E., Wood, K., 2004, ApJ, 617, 1177
- Blitz et al. (1982) Whitney, B. A., Wood, K., Bjorkman, J. E., Cohen, M., 2003a, ApJ, 598, 1079
- Blitz et al. (1982) Whitney, B. A., Wood, K., Bjorkman, J. E., Wolff, M. J., 2003b, ApJ, 591, 1049