The disappearance of the helium-giant progenitor of the type Ib supernova iPTF13bvn and constraints on its companion
Abstract
We report and discuss post-explosion observations of supernova iPTF13bvn. We find that the brightness of the SN at 740 days is below the level of the pre-explosion source and thus confirm that the progenitor star has gone. We estimate that the late-time brightness is still dominated by the supernova, which constrains the magnitude and thus mass of a possible companion star to below approximately 10M⊙. In turn this implies that the progenitor’s initial mass is constrained to a narrow range of between 10 to 12 M⊙. The progenitor of iPTF13bvn would have been a helium giant rather than a Wolf-Rayet star. In addition, we suggest that sufficiently deep observations acquired in 2016 would now stand a chance to directly observe the companion star.
keywords:
stars: evolution – binaries: general – supernovae:general – supernovae: iPTF13bvn – stars: Wolf-Rayet1 Introduction
Cao et al. (2013) reported the detection of a possible progenitor for the Type Ib Supernova (SN) iPTF13bvn in pre-explosion observations of NGC 5806. Due to this being the first such detected candidate for a hydrogen-free type Ib/c SN progenitor, the pre-explosion observations were reanalysed by a number of authors including Groh et al. (2013), Fremling et al. (2014) and Bersten et al. (2014). The latter study by Bersten et al. suggested that the progenitor was probably a binary system composed of two relatively low mass stars, in which an interaction between the two components was responsible for removing hydrogen from the progenitor. This model was consistent with the prediction by Yoon et al. (2012) that it would be easier to detect these helium giant systems than more massive Wolf-Rayet (WR) progenitor stars. Conversely, Groh et al. (2013) suggested that a WR star progenitor could still be possible if the progenitor had been rapidly rotating on the main-sequence.
In Eldridge et al. (2015) it was shown that the initial magnitudes reported by Cao et al. (2013) were in error and the pre-explosion source was brighter. The new photometry of the pre-explosion source was compared to a large range of interacting binary models from the BPASS (Binary Population and Spectral Synthesis) code111http://bpass.auckland.ac.nz. A number of models were found, with initial masses from 9 to 20 M⊙, that matched the source in the pre-explosion images as well as the supplementary constraints from modelling the SN, as discussed by Fremling et al. (2014) and Bersten et al. (2014). In these results a standard non-rotating single-star model was strongly disfavoured as a possible progenitor.
Here, we report on the detection of the supernova in late-time observations at magnitudes, finding it to be fainter than the pre-explosion source and faint enough that the mass of the companion star can be constrained. This constraint again strongly disfavours a Wolf-Rayet star as the progenitor of the SN and the best model progenitors are helium giants with an initial mass of approximately 10 to 12M⊙.
2 On the late-time supernova brightness
The pre-explosion observations of iPTF13bvn, in which the progenitor candidate was identified, were previously presented by Cao et al. (2013) and Eldridge et al. (2015). The brightness of the progenitor object was found to be F435W = 25.800.12, F555W = 25.800.11, F814W = 25.880.24 mags.
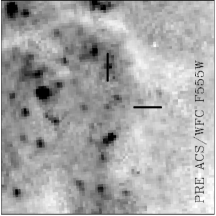
Late-time observations of the site of iPTF13bvn were acquired with the Wide Field Camera 3 (WFC3) Ultraviolet-Visible channel (UVIS) on 26 June 2015 (approximately 740 days post-explosion Cao et al., 2013). The observations, which were immediately made public, were acquired as part of programme GO-13684 (P.I. S. Van Dyk). The observations were composed of two sequences of exposures of s and s using the F438W and F555W filters, respectively. The constituent exposures were combined using the astrodrizzle package, running in the PyRAF environment222STSDAS and PyRAF are products of the Space Telescope Science Institute, which is operated by AURA for NASA. The position of the SN was identified on the late-time images through comparison with post-explosion WFC3 UVIS observations of iPTF13bvn acquired on 2 September 2013 as part of programme GO-12888 (P.I. S. Van Dyk). A geometric transformation between the post-explosion and late-time images was calculated using 35 common stars, with resulting uncertainty on the SN position in the late-time images of 0.36px (or 14 milliarcseconds). A source is recovered on the late-time images within from the transformed SN position. Photometry of the late-time images was conducted using the DOLPHOT package333http://americano.dolphinsim.com/dolphot/ (Dolphin, 2000) and the brightness of the source at the SN position was measured to be and mags. We note that the sharpness parameter, measured by DOLPHOT, was found to be and in the and images, respectively. These values are just outside the range of sharpness values expected for point-like sources, that may suggest that the recovered source is slightly extended. The SN position on the pre-explosion and late-time images is shown on Figure 1.
The post-explosion source is 0.68 and 0.53 mags fainter than the pre-explosion source in the and observations; although we note that the pre-explosion and late-time -band observations were acquired with slightly different filters. The brightness of the post-explosion source is below the level of the pre-explosion source, confirming that the pre-explosion progenitor candidate was the progenitor which has now disappeared.
In Eldridge et al. (2015), we derived a range of absolute magnitudes in each filter due to the uncertainty in the extinction towards the pre-explosion source. We reuse the same values here, we adopt a distance of 22.52.4 Mpc, mag and assume the reddening is between mag and 0.170.03 mag. We note that there is an updated distance from Tully et al. (2013), who report a distance modulus of . To allow for this extra uncertainty we use this greater distance to calculate the upper limits and the shorter distance for the lower limits. For the F435W and F555W observations these were between and . Here we find the range of absolute magnitudes for the post-explosion source are between and . With these magnitudes below the previous pre-explosion source we know that source was the progenitor which has now disappeared. We find using the distance does not significantly alter the nature of our fit but does decrease the mean metallicity slightly.
To estimate whether this source could still be the SN or another object we have compared our photometry with earlier and -band observations of Srivastav, Anupama & Sahu (2014) and Kuncarayakti et al. (2015). We list the known B and V band magnitudes in Table 1. We then use the last observed magnitudes and the decay rate from Kuncarayakti et al. (2015) to predict what the expected magnitudes should be on the date of the HST observations. The B/F438W magnitudes are quite close and we thus can only assume that this flux arises from the SN itself. We see however that the V/F555W magnitudes are quite different with the observed flux being significantly brighter than expected from the previous behaviour of the lightcurve. We note, however, that Kuncarayakti et al. (2015) measured the -band decay rate to be 1.55 magnitudes per 100 days, which is significantly higher than the decay rates of 1.13 and 1.32 measured for the B and R band photometry.
To gain some insight into the possible late-time behaviour of iPTF13bvn we have also considered the similar evolution of SN 2011dh, as described by Ergon et al. (2015) and Fremling et al. (in prep). At 700 days the colour of 2011dh is very similar to the value we observed for iPTF13bvn. We also see that the decay rate became shallower at 700 days. These studies also indicate that emission lines can provide a significant contribution to the broadband fluxes at different times. We suggest that the band flux has been affected by nebular emission in the past so that predicting the long term behaviour has some degree of uncertainty. Even so it is still likely that the fluxes we observe for the late-time source are consistent with the flux arising from the SN.
If we assume that long term evolution should be mostly similar and that it becomes shallower over a longer time we can assume the decay rates between the different filters should be more similar. Using our photometry and comparing them to the latest magnitudes reported by Srivastav, Anupama & Sahu (2014) we find decay rates of 1.20 and 1.30. The similarity between the decay rates suggests that the source detected is, in fact, the SN and not a companion star.
| Date | Phase† | ||
|---|---|---|---|
| (days) | (mag) | (mag) | |
| 06/08/2013 | 53.93 | 18.2 | – |
| 10/09/2013 | 88.84 | – | 17.8 |
| 18/04/2014 | 324 | 21.1 | 21.2 |
| Expected | 740 | 26.0 | 28.0 |
| 26/06/2015 | 740 | 26.5 | 26.3 |
| Expected | 1001 | 29.6 | 29.7 |
† with respect to the explosion date June 15.67 2013 Cao et al. (2013)
3 Numerical Method
In this letter we use the latest BPASS v2.0 models rather than the previous v1.1 as used in Eldridge et al. (2013, 2015). These models are almost identical in construction as described in detail in Eldridge et al. (2008), however, there are more initial masses, more initial separations, more masses for each companion star and a wider range of metallicities. Full details of v2.0 will be described in Eldridge et al. (in prep). They have already been used in a few studies including Stanway, Eldridge & Becker (2016) and Wofford et al. (2016), and have been found to match previous results well. Here we use these models and compare them to the progenitor candidate in a similar method to Eldridge et al. (2015) with an extended grid of stellar models. The key difference to the analysis of Eldridge et al. is that we can now use the late-time HST photometry of the source at the position of iPTF13bvn to constrain the brightness of a possible companion.
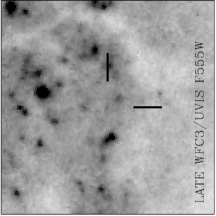
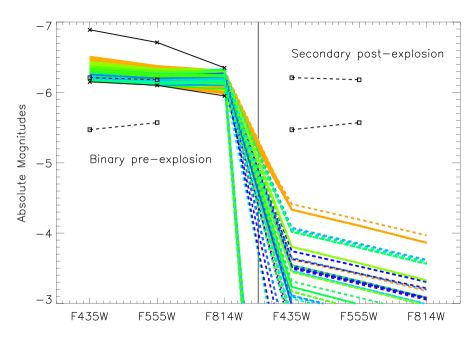
We show the details of the resulting matching models in Figure 2, in which the locations of the primary and companion stars are shown on the Hertzsprung-Russell (HR) diagram. In Figure 3 we compare the pre-explosion and late-time magnitudes to the pre- and post-explosion magnitudes expected from our stellar models. We also provide the mean parameters for the progenitor and companion calculated from all the models that fit the observations in Table 2.
4 Results & Discussion
| Primary | Secondary | ||
| Parameter | Value | Parameter | Value |
| 11.01.2 | 5.82.9 | ||
| 2.40.4 | 5.04.5 | ||
| 4.60.1 | 1.12.9 | ||
| 4.060.04 | 4.00.4 | ||
| 1.710.04 | 0.40.3 | ||
| 0.950.4 | |||
| 0.60.2 | |||
| System Parameters | |||
| 1.90.5 | 1.80.2 | ||
| Age/Myrs | 24 5 | 0.0270.013 | |
Figure 3 shows that in comparison to the similar diagram in Eldridge et al. (2015) the preferred progenitor is now a cooler helium giant, rather than a Wolf-Rayet star. The main reason from this constraint can be understood in Figure 3. The predicted pre-explosion magnitudes agree well with the observed magnitudes for low extinction, while all the predicted post-explosion magnitudes are at least 1 magnitude fainter than the late-time observed photometry. The more massive 17 to 20M⊙ models from Eldridge et al. (2015) are ruled out because most of the pre-explosion magnitudes have a significant contribution from the companion star which would be brighter than the late-time magnitudes.
The mean parameters for the companion are shown in Table 2. The one value that is relatively unconstrained is the metallicity. While the mean metallicity is above Solar we find fits to the progenitor between a mass fraction of to 0.040, or [O/H]=8.5 to 9.2, the lower range of which is equivalent to that observed by Kuncarayakti et al. (2015). We note that the radius predicted from out models of is within the range allowed by the study of Bersten et al. (2014).
The secondary mass is also constrained to around 6M⊙, however the allowed range is quite large. We are able to rule out a star more massive than approximately 20M⊙ via the late time observations.
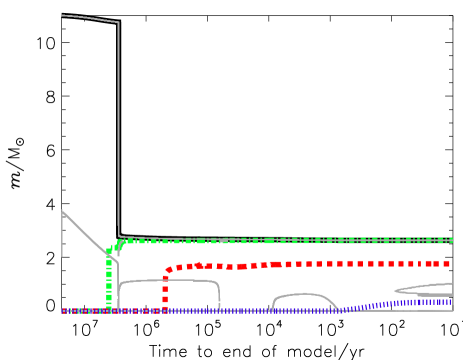
We show the evolution of an example system in Figure 4. The hydrogen envelope is lost during a period of common-envelope evolution after the main sequence. We see little further mass is lost, otherwise interior evolution progresses as it would with the hydrogen envelope (although the helium core does not experience dredge-up to reduce its mass).
An interesting prediction from our work is that in a sufficiently long observation we might expect a late-time image of the supernova location to reveal the companion as the supernova should have faded below the possible companion magnitudes. For example, at 1000 days after explosion the SN brightness would be of order 29.6 mags (as shown in Table 1), corresponding to an absolute magnitude of -2.1. The brightest companions we predict have an absolute magnitude of the order of -4, an apparent magnitude of 27.7. It is also possible, however, that a companion might be be in the form of a black hole or neutron star, which would not be observable.
5 Conclusion
We have shown that the progenitor star of iPTF13bvn has disappeared and most likely had an initial mass between 10 to 12 M⊙ and had a companion star with a much lower mass; otherwise it would have been observable in the post-explosion images. The mass range for the progenitor is a factor of two less than that suggested by Bersten et al. (2014), however this was because they used the incorrect photometry of Cao et al. (2013). We note they still suggest the progenitor was a helium giant although the final helium star mass is 3.5M⊙.
Our conclusions are strongly based on the caveat that the source seen in the late-time image is still the supernova and not the companion star and that we can use the supernova magnitude as an upper limit for the companion star.
We note that a recent similar deep search for the companion to SN 1994I, a type Ic event, also did not find any progenitor (Van Dyk, de Mink & Zapartas, 2016). This SN is considerably closer, so observations of the same depth reach lower absolute magnitudes of approximately -3.4 and derived a similar mass limit for the progenitor as we find here. In the case of iPTF13bvn we have a firm constraint on the nature of the progenitor star and therefore the age of any companion star, this allows us to take account of the fact that stars become brighter and cooler as they evolve. In light of this the limit on the mass of the companion to SN 1994I from Van Dyk, de Mink & Zapartas (2016) maybe be less than they found. Their study and our own however does begin to suggest that if the progenitor stars of type Ib and Ic SNe are low-mass helium giants, the progenitors may be bright, their companions are also low mass and most likely faint and thus difficult to observe.
Another caveat is these helium giants have still not been observed at any other time so their observable signature is uncertain as are the theoretical atmosphere spectra used to predict their brightness and colours. Here the progenitor is too cool for using the Potsdam Wolf-Rayet spectra so we use the BaSeL spectra. The problem here is that those models are hydrogen rich. Kim, Yoon & Koo (2015) have calculated possible spectra using the detailed atmosphere modelling code CMFGEN; however, one problem is that these giants have low surface gravity which can significantly alter the shape of the spectrum. We confirm that we cannot fit any Wolf-Rayet star models to the pre-explosion photometry, for iPTF13bvn, and still have a companion below the late-time magnitudes, whilst having an ejecta mass below 3M⊙.
We also wish to make the community aware of the opportunity that there is now a better chance of detecting the companion star as the supernova should now have faded to the point where the companion should be directly detectable if a sufficently long observation with HST was taken.
6 Acknowledgements
The authors thank the referee Christoffer Fremling for positive comments that greatly improved the paper. JJE also thanks Morgan Fraser and Stephen Smartt for comments on an early draft of this letter. JJE acknowledges support from the University of Auckland. The research of JRM is supported by a Royal Society Research Fellowship. The authors wish to acknowledge the contribution of the NeSI high-performance computing facilities and the staff at the Centre for eResearch at the University of Auckland. New Zealands national facilities are provided by the New Zealand eScience Infrastructure (NeSI) and funded jointly by NeSIs collaborator institutions and through the Ministry of Business, Innovation and Employments Infrastructure programme. URL: http://www.nesi.org.nz.nz.
References
- Alard & Lupton (1998) Alard, C. & Lupton, R. H., 1998, ApJ, 503, 325
- Alard (2000) Alard, C., 2000, A&AS, 144, 363
- Bersten et al. (2014) Bersten M.C. et al., 2014, arXiv:1403.7288
- Bianco et al. (2014) Bianco F., 2014, ApJS, 213, 19
- Cao et al. (2013) Cao Y. et al., 2013, ApJL, 775, L7
- Claeys et al. (2011) Claeys, J. S. W., de Mink, S. E., Pols, O. R., Eldridge, J. J., & Baes, M. 2011, A&A, 528, A131
- Dolphin (2000) Dolphin, A. E. 2000, PASP, 112, 1383
- Eldridge et al. (2008) Eldridge, J. J., Izzard, R. G., Tout, C. A. 2008, MNRAS, 384, 1109
- Eldridge & Stanway (2009) Eldridge, J. J., & Stanway, E. R. 2009, MNRAS, 400, 1019
- Eldridge et al. (2013) Eldridge J.J., Fraser M., Smartt S.J., Maund J.R., Crockett R.M., 2013, MNRAS, 436, 774
- Eldridge et al. (2015) Eldridge J.J., Fraser M., Smartt S.J., Maund J.R., Crockett R.M., 2015, MNRAS, 446, 2689
- Ergon et al. (2015) Ergon M. et al., 2015, A&A, 580, 142
- Fremling et al. (2014) Fremling C. et al., 2014, A&A, 565, 114
- Groh et al. (2013) Groh J.H., Georgy C., Ekström S., 2013, A&A, 558, L1
- Hurley et al. (2000) Hurley, J.R., Pols, O.R., Tout, C.A., 2000, MNRAS, 315 543
- Kim, Yoon & Koo (2015) Kim H.-J., Yoon S.-C., Koo B.-C., 2015, ApJ, 809, 131K
- Kuncarayakti et al. (2015) Kuncarayakti H. et al., 2015, A&A, 579, 95
- Sander et al. (2012) Sander, A., Hamann, W.-R., Todt, H. 2012, A&A, 540, A144
- Srivastav, Anupama & Sahu (2014) Srivastav S., Anupama G. C., Sahu D. K., 2014, MNRAS, 445, 1932
- Smartt et al. (2009) Smartt S.J., Eldridge J.J., Crockett R.M., Maund J.R, 2009, MNRAS, 395, 1409
- Smartt et al. (2015) Smartt S.J., PASA, 32, 16
- Stanway, Eldridge & Becker (2016) Stanway E. R., Eldridge J. J., Becker G. D., 2016, MNRAS, 456, 485S
- Tully et al. (2013) Tully R. B. et al., 2013, AJ, 146, 86
- Van Dyk, de Mink & Zapartas (2016) Van Dyk S.D., de Mink S.E., Zapartas E., 2016, ApJ, 818, 75V
- Yoon et al. (2012) Yoon, S.-C., Gr fener, G., Vink J. S. Kozyreva A., Izzard R. G., 2012, A&A, 544, 11
- Wofford et al. (2016) Wofford A., et al., 2016, MNRAS in press arXiv:1601.03850