NuSTAR discovery of a cyclotron line in the accreting X-ray pulsar IGR J163934643
Abstract
The high-mass X-ray binary and accreting X-ray pulsar IGR J163934643 (catalog ) was observed by NuSTAR in the 3–79 keV energy band for a net exposure time of 50 ks. We present the results of this observation which enabled the discovery of a cyclotron resonant scattering feature with a centroid energy of keV. This allowed us to measure the magnetic field strength of the neutron star for the first time: G. The known pulsation period is now observed at 904.00.1 s. Since 2006, the neutron star has undergone a long-term spin-up trend at a rate of s s-1 (0.6 s per year, or a frequency derivative of Hz s-1). In the power density spectrum, a break appears at the pulse frequency which separates the zero slope at low frequency from the steeper slope at high frequency. This addition of angular momentum to the neutron star could be due to the accretion of a quasi-spherical wind, or it could be caused by the transient appearance of a prograde accretion disk that is nearly in corotation with the neutron star whose magnetospheric radius is around cm.
Subject headings:
accretion, accretion disks ; gamma-rays: general ; stars: neutron ; X-rays: binaries ; X-rays: individual (IGR J163934643 (catalog ))1. Introduction
During a survey of the Galactic Plane, the ASCA space telescope detected a new X-ray source, AX J1639044642 (catalog ), in the direction of the Norma spiral arm tangent (Sugizaki et al., 2001). The source was initially classified as a microquasar (Combi et al., 2004) given the absorbed power-law shape of the ASCA-derived spectrum, and given that its X-ray position coincides with counterpart candidates from the radio and infrared bands, as well as with the unidentified gamma-ray source 3EG J16394702 (catalog ) (Hartman et al., 1999). Surveying the same region a few years later, the INTEGRAL space telescope detected IGR J163934643 (catalog ) which was shown to be the hard X-ray counterpart to the ASCA source (Bird et al., 2004; Malizia et al., 2004).
A follow-up observation of IGR J163934643 (catalog ) with XMM-Newton revealed several interesting clues about the source’s nature (Bodaghee et al., 2006). First, the refined position from XMM-Newton excluded all previous multi-wavelength counterpart candidates (other than the ASCA source) that were the basis for the microquasar interpretation, and pointed instead to a faint object from the Two Microns All-Sky Survey (Cutri et al., 2003) named 2MASS J163905354642137 (catalog ). Thus, the association of IGR J163934643 (catalog ) with 3EG J16394702 (catalog ) was attributed to a chance alignment of unrelated objects. Second, the spectral properties were typical of a wind-accreting pulsar (e.g., Nagase, 1989); i.e., a large absorbing column, a hard X-ray continuum with an exponential cutoff around 20 keV, and iron fluorescence lines. Third, a timing analysis of the XMM-Newton and INTEGRAL data led to the discovery of a coherent pulsation period of 911 s indicative of a slowly rotating, magnetized neutron star. This pulsation period was confirmed in observations taken with RXTE (Thompson et al., 2006), Chandra (Fornasini et al., 2014), and Suzaku (Islam et al., 2015).
These results suggest that IGR J163934643 (catalog ) is an obscured high-mass X-ray binary (HMXB) in which a compact object (in this case, a spinning neutron star) accretes the wind shed by a massive donor star (White et al., 1983; Nagase, 1989; Bildsten et al., 1997). This view is supported by the subsequent detection of a 4.2-d orbital period in RXTE and Swift data (Corbet et al., 2010; Corbet & Krimm, 2013; Coley et al., 2015) which places IGR J163934643 (catalog ) within the wind-fed HMXB systems in the pulse-vs.-orbital period diagram of Corbet (1986).
| telescope | observation ID | pointing R.A. (J2000) | pointing decl. (J2000) | start date (UTC) | end date (UTC) | effective exposure (ks) |
|---|---|---|---|---|---|---|
| NuSTAR | 30001008002 | 249.8301 | 46.6567 | 2014-06-26 02:21:07 | 2014-06-27 05:31:07 | 50.579 |
| Swift | 00080170004 | 249.6784 | 46.6450 | 2014-06-27 04:40:07 | 2014-06-27 05:27:01 | 2.804 |
However, the exact spectral class of this donor star is uncertain. The optical/infrared spectrum of 2MASS J163905354642137 (catalog ) indicates a spectral class of BIV-V (Chaty et al., 2008), whereas analysis of the -band spectrum of the same object suggests a late-type KM star in a symbiotic binary system (Nespoli et al., 2010). To help clarify this issue, we performed a Chandra observation of IGR J163934643 (catalog ) that provided an X-ray position with sub-arcsecond accuracy (Bodaghee et al., 2012). The Chandra position is R.A. (J2000) and Decl. with an error radius of (90% confidence). This error circle excludes the 2MASS star and suggests a faint, blended, and likely distant B star that appears in the mid-infrared at wavelengths longer than 5 m. Indeed, an orbital-period analysis suggests that the donor star is a B giant with a mass greater than 7 (Coley et al., 2015).
In 2014 June, the Nuclear Spectroscope Telescope Array (NuSTAR: Harrison et al., 2013) observed the field of IGR J163934643 (catalog ) as part of its survey of the Norma Arm region (Bodaghee et al., 2014; Fornasini et al., 2014). NuSTAR provides exceptional angular ( full-width-half-maximum, 58′′ half-power diameter) and spectral resolution (400 eV) around 10 keV. In this paper, we present results from these NuSTAR observations of IGR J163934643 (catalog ) in addition to a simultaneous snapshot observation taken with Swift. Section 2 describes the analysis of the X-ray data with results from timing and spectral analyses shown in Section 3. Insights into the nature of IGR J163934643 (catalog ) are discussed in Section 4.
2. Observations & Data Analysis
Table 1 lists details of the observations of IGR J163934643 (catalog ) included in this analysis. All data were analyzed using HEASoft 6.16. The NuSTAR data consist of the two focal plane modules A and B (FPMA and FPMB) where each module has a field-of-view (FoV) of . Raw event lists from observation ID (ObsID) 30001008002 were reprocessed with nupipeline, which is part of the NuSTAR Data Analysis Software111http://heasarc.gsfc.nasa.gov/docs/nustar/analysis/nustardas_swguide_v1.7.pdf (NuSTARDAS 1.4.1), while employing the most recent calibration database files available at the time (CALDB: 2014 August 14).
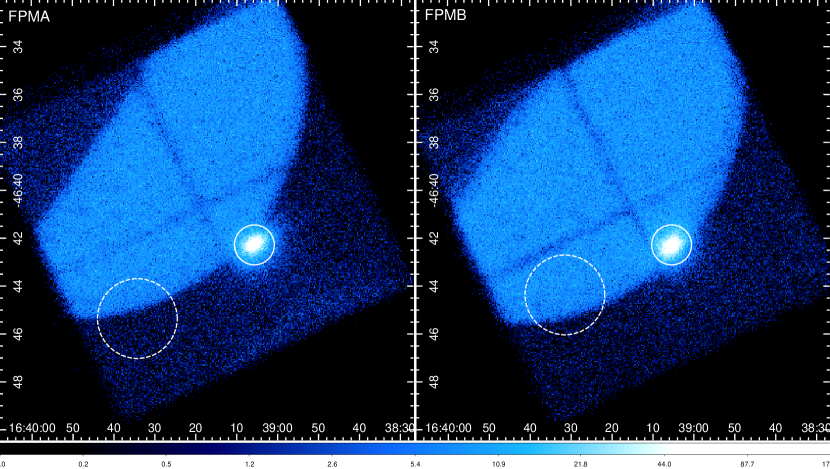
Figure 1 presents the cleaned images for each module in the 3–79 keV energy band. From the cleaned event lists of each module, we extracted source spectra and light curves using a 50′′-radius circle centered on the Chandra position for IGR J163934643 (catalog ). Around 70% of the source photon energy is enclosed within this radius (Madsen et al., 2015). Given the size of this extraction region, and given that the Chandra position is within 3′′ of the brightest pixel in the image from each NuSTAR focal plane module, we chose not to correct these images for the known systematic offset of coordinates.
The bright background feature affecting both modules (Figure 1) is due to unfocused stray-light photons from GX 3400 (catalog ), an unrelated object situated just outside the FoV. Since the source extraction regions have some fraction of their area contaminated by stray-light photons, we selected background extraction regions (100′′-radius circles) that encompassed a similar fraction of stray-light photons. Exposure differences due to vignetting were accounted for in the response matrices and spectra. The effective exposure time at the position of IGR J163934643 (catalog ) is 50.579 ks.
During the NuSTAR observation, Swift-XRT (Burrows et al., 2005) also observed the source yielding an effective exposure time of 2.804 ks (ObsID 00080170004). We extracted a spectrum in the 0.5–10 keV energy range that extends the source continuum below the 3-keV limit of NuSTAR thereby enabling the column density to be constrained. The combined Swift-NuSTAR spectra were fit in Xspec 12.8.2 (Arnaud, 1996) where we assumed Wilms et al. (2000) abundances and Verner et al. (1996) photo-ionization cross-sections.
3. Results
3.1. Timing Analysis
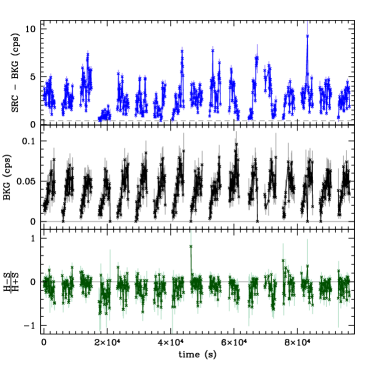
Figure 2 presents the source and background light curves binned at 100 s in the 3–79 keV energy range combining counts from NuSTAR FPMA and FPMB. The hardness ratio is defined as where and represent count rates in 3–10 keV (“soft”) and 10–79 keV (“hard”), respectively. A dividing value of 10 keV allocates a roughly even number of source counts between soft and hard energy bands.
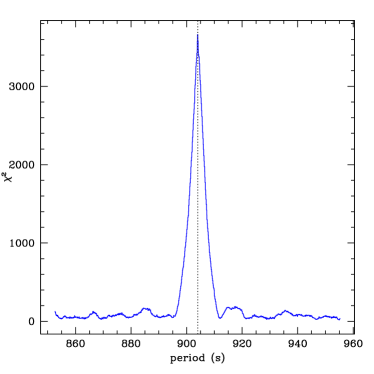
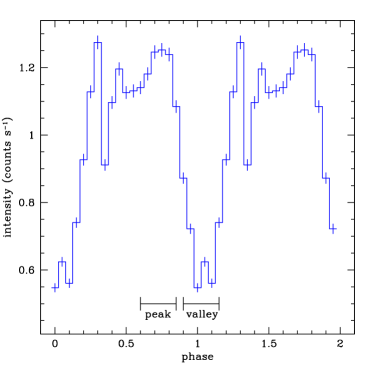
The known pulsation is detected at a period of 904.00.1 s in the source ( background) light curve with 0.1-s resolution. The best-fitting period is obtained from the fast algorithm for Lomb-Scargle periodograms (Lomb, 1976; Scargle, 1982) developed by Press & Rybicki (1989), while the error on the pulse period is derived from the analysis methods of Horne & Baliunas (1986) and Leahy (1987) which yield consistent uncertainties. Figure 3 displays the periodogram and Figure 4 shows the phase-folded light curve.
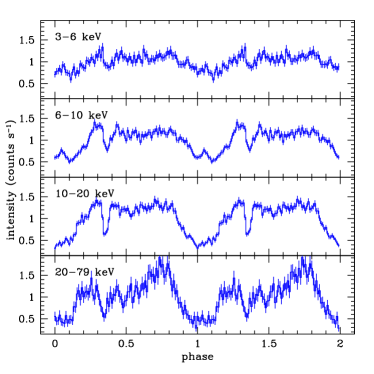
As illustrated in Figure 4, the pulse profile begins with a spike in count rates at phase 0.2–0.3, followed by a dip at phase 0.35, and then a broad secondary peak at phase 0.4–0.85. This bimodal pulse profile is similar to the pulse profiles recorded for this source by INTEGRAL (20–40 keV: Bodaghee et al., 2006) and XMM-Newton (0.3–10 keV: Bodaghee et al., 2006) as well as with RXTE (3–24 keV: Thompson et al., 2006) and Suzaku (0.3–50 keV: Islam et al., 2015).
The pulse fraction () of 38%1% is consistent with previous measurements by INTEGRAL (: Bodaghee et al., 2006), XMM-Newton (: Bodaghee et al., 2006), and Suzaku-XIS (: Islam et al., 2015), but it is higher than the fraction measured with RXTE (: Thompson et al., 2006). The pulse fraction increases with energy (e.g., Lutovinov & Tsygankov, 2009) reaching 60% for the NuSTAR 10–79-keV energy band, which is consistent with the pulse fraction from Suzaku-PIN ( in 12–50 keV: Islam et al., 2015).
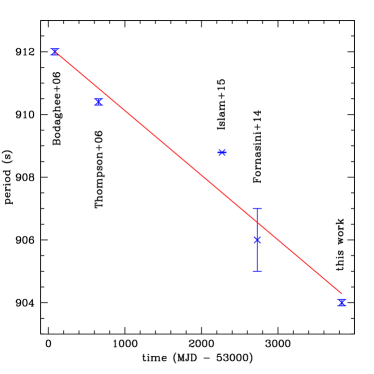
In Figure 6, the evolution of the pulsation period is shown as measured by different authors. A least-squares fit to the data results in a slope of s s-1, which implies that the neutron star is undergoing a long-term spin-up trend at a rate of around 0.6 s per year. This is twice the value of reported by Thompson et al. (2006) using RXTE data. The frequency derivative is s-2. There could be some stochastic variation around the average spin-up value, as seen e.g. in Vela X-1 (Tsunemi, 1989; Ikhsanov et al., 2014), but the measurements are too sparse to make a definitive claim.
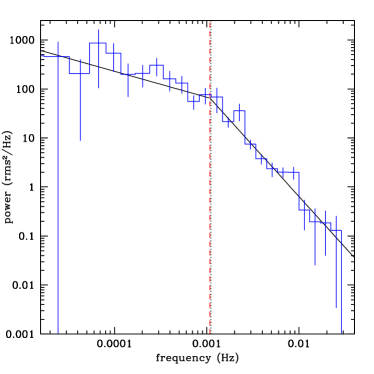
Figure 7 presents the power density spectrum (PDS) of IGR J163934643 (catalog ) after subtracting the average pulsed periodic component from the light curve. A broken power law model applied to the PDS yields a break frequency of 0.00108(21) Hz with 0.530.13 and 2.080.16. The spectral break is necessary given that its inclusion significantly improves the fit quality (dof , where dof is the degrees of freedom, compared to dof without the break). In contrast to the recent spin-up detection in 2RXP J130159.6635806 (catalog ) (Krivonos et al., 2015), where the break in the power spectrum was shifted with respect to the pulsation period, in our case we observe pulsations directly at the break of the power spectrum.
A phase lag was suggested by Islam et al. (2015) when they compared the low-energy and high-energy pulse profiles from Suzaku. The minimum of the pulse profile in the low-energy NuSTAR data (3–10 keV) trails the minimum in the high-energy NuSTAR data (10–79 keV) by 0.1 in phase ( 90 s); i.e., consistent with the Suzaku results (Islam et al., 2015). However, unlike in the Suzaku data, the pulse profiles in the NuSTAR data present two maxima and a dip that are synchronized across energy bands (Figure 5).
3.2. Spectral Analysis
The spectral data from NuSTAR FPMA and FPMB were rebinned so that each energy bin had a significance of at least 4. The data were fit simultaneously with an absorbed power law where the instrumental constant was fixed at 1 for FPMA and was allowed to vary for FPMB. In all cases, the instrumental constant that was free to vary remained consistent with 1. The column density was fixed to cm-2 (Bodaghee et al., 2006). This yielded a poor fit with a reduced and residuals below 5 keV and above 30 keV. A bremsstrahlung model did not improve the fit by much ().
A thermal blackbody (0.04 keV) or a power law with an exponential cutoff (0.06 and 0.2 keV) offered better fits to the spectral data ( and , respectively). Some residuals remain near 6.4 keV where an iron K line is known from XMM-Newton observations (Bodaghee et al., 2006); the addition of a model component for this line leads to a negligible improvement in the fit quality, and so it is not required by the data. The non-detection of this feature is likely due to the lower spectral resolution of NuSTAR at this energy compared with XMM-Newton. Where NuSTAR excels is above 10 keV, and the spectrum shows residuals around 30 keV which suggests a cyclotron resonant scattering feature (CRSF).
To test the significance of this candidate cyclotron line, the NuSTAR spectral data were rebinned so that each energy bin had a significance of least 9. We began with the multi-component continuum model from the broadband spectral fits (see below) with the column density fixed to its best-fitting value ( cm-2). Adding a cyclotron line to the model reduced the of the fit by 30. In order to estimate the significance of the cyclotron line, we relied on the Bayesian posterior predictive probability value (“ppp-value”) as described in Protassov et al. (2002). See Bellm et al. (2014) and Bhalerao et al. (2015) for recent applications of this technique. We determined the reference distribution empirically using a Monte Carlo method where we simulated 1000 trials with the Xspec tool simftest, allowing the centroid energy and width of the cyclotron line to vary within their 90% confidence regions. It is important to note that simftest was used only to simulate the data within a reasonable range of parameter uncertainties and not to perform an F-test. From our simulations, we calculated the change in chi-squared values for the model that includes the cyclotron feature, and for the model without the cyclotron feature (the “null hypothesis”). These simulations returned a maximum change in of 14. The probability of finding the observed change in by chance is which corresponds to 4.8 significance (4.3 after accounting for trials).
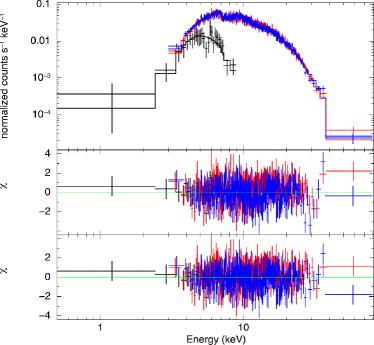
Swift spectral data, where each bin contained a minimum of 5 source counts, were then jointly fit with the NuSTAR data. Using single-component models for the continuum led to fits of insufficient quality and unconstrained spectral parameters. The best fit was obtained with a two-component continuum model incorporating both a soft thermal component (a radial blackbody or bbodyrad) and a hard non-thermal component (a power law with an exponential cutoff or cutoffpl). Photoelectric absorption from molecular hydrogen (tbabs) and a cyclotron absorption line (cyclabs) were included (see also Schönherr et al., 2007, for a more elaborate model).
The fit quality is excellent as attested by the reduced of and by the lack of significant residuals as shown in Figure 8. Table 2 lists the spectral parameters of this model. The broadband X-ray flux is about twice as high as was seen previously with Suzaku (Islam et al., 2015) and XMM-Newton (Bodaghee et al., 2006). The effective exposure time is around 51 ks.
To test for variations in the spectral parameters with respect to the pulse profile, we extracted NuSTAR spectra corresponding to the maxima (or “peak”) and minima (or “valley”) of the pulse profile. For the peak spectrum, we selected events corresponding to phases 0.6–0.85 (for a count rate of 1.220.01 cps in 3–79 keV), whereas events with phases 0–0.15 and 0.9–1 were chosen for the valley spectrum (a count rate of 0.650.01 cps). For reference, the “full” or time-averaged source count rate is 1.050.01 cps.
Each of these phase-resolved NuSTAR spectra covers one-quarter of the full pulse cycle for a total exposure time of 13 ks per spectrum. Each spectrum was rebinned to have a minimum significance of 6 per bin, and was then jointly fit with the Swift spectrum using the multi-component model described above while holding the column density to its optimal value from the time-averaged spectrum ( cm-2). A few of the spectral parameters could not be easily constrained and so the following results should be considered with that caveat in mind. The cyclotron line energies from both spectra were statistically consistent with each other: 29.41.5 keV for the peak spectrum, and 29.61.6 keV for the valley spectrum. The only significant differences were the normalization and flux values which were twice as high in the peak spectrum, i.e. consistent with the difference in count rates. An instrumental cross-calibration constant near 0.5 for the valley spectrum is expected since the NuSTAR count rate is nearly half its average value while the Swift spectrum does not change.
4. Discussion
The X-ray band spectrum generated from joint Swift and NuSTAR observations offers the sharpest view yet of the broadband spectral energy distribution (SED) of IGR J163934643 (catalog ), especially above 10 keV. Thermal blackbody photons with a temperature of 1.410.12 keV originating near the surface of the neutron star are re-emitted at higher energies by inverse-Compton scattering off the surrounding electron plasma, and their SED assumes the form a hard power law () with an exponential cutoff at keV. Indeed, a thermal Comptonization model also fits the data providing this physical description of the observed phenomena (e.g., Becker & Wolff, 2005).
We discovered a cyclotron resonant scattering feature in the NuSTAR spectrum of IGR J163934643 (catalog ) lending further evidence that the compact object in this system is a strongly magnetized neutron star. The centroid energy is keV, and it does not change appreciably across the pulse profile (but see, e.g., Coburn et al., 2002). This implies a neutron star magnetic field strength of G, which could be up to 40% larger when gravitational redshift is considered. This value is equal to that of X Per (catalog ) and is within the range of observed line energies in accreting X-ray pulsars (e.g., Caballero & Wilms, 2012; Walter et al., 2015, and references therein).
The X-ray photons arise at the accretion poles (e.g., Burnard et al., 1991; Becker & Wolff, 2005) given that the emission follows a coherent pulsation period seen in the NuSTAR data of IGR J163934643 (catalog ), as well as in previous observations. Since the discovery of the pulse period in 2006, each of the five subsequent observations shows IGR J163934643 (catalog ) spinning at a higher frequency than during the preceding observation. The change in frequency is Hz s-1 which converts to a long-term spin-up trend of 0.6 s per year on a pulsation period of 904.00.1 s in the most recent data (this work). Considering that our period derivative is twice the value found by Thompson et al. (2006), and considering that the period measurement of Islam et al. (2015) is not well fit by the least-squares approximation, this indicates that is generally increasing but not at a constant rate.
Angular momentum must be imparted to the neutron star to change the spin period in this way (Pringle & Rees, 1972; Lamb et al., 1973). The environment of the neutron star in an absorbed HMXB such as IGR J163934643 (catalog ) is generally assumed to be a quasi-spherical stellar wind (e.g., Bondi, 1952; Walter et al., 2006; Shakura et al., 2012, 2015). Accretion of this wind can, under certain conditions, provide a net change in angular momentum (Shakura et al., 2012). Alternatively, a wind-fed accretion disk can develop around the neutron star in IGR J163934643 (catalog ) (Ghosh & Lamb, 1979; Boerner et al., 1987), and since a BIII-type donor star is not expected to fill its Roche lobe, this favors a transient scenario for the disk. Transient accretion disks have been suggested in other wind-fed pulsars that exhibit long-term spin-up trends (e.g. GX 3012 (catalog ): Koh et al., 1997).
| model parameter | full | peak | valley | unit |
|---|---|---|---|---|
| consttbabscyclabs(bbodyradcutoffpl) | ||||
| 0.50.1 | ||||
| 42 | 42 | cm-2 | ||
| keV | ||||
| norm. at 1 keV | 32 | 1 | 0.4 | ph cm-2 s-1 |
| 1.40.1 | 1.60.1 | 1.60.1 | keV | |
| norm. | 0.70.2 | 0.6 | 0.6 | |
| 29.41.2 | keV | |||
| keV | ||||
| depth | 0.40.1 | keV | ||
| 2211 | erg cm-2 s-1 | |||
| 3115 | 188 | erg cm-2 s-1 | ||
Note. — Spectral parameters are shown for the “full” or time-averaged spectrum, as well as for the 904-s pulse phase-resolved spectra where the “peak” corresponds to counts from phases 0.6–0.85, while the “valley” includes only those counts corresponding to phases in 0.0–1.5 and 0.9–1.0 (see Figure 4). The column density for the phase-resolved spectra is fixed to the value from the “full” spectrum. is an instrumental cross-calibration coefficient which is fixed at 1 for Swift and variable for NuSTAR. Flux values are given as observed (“abs”) and corrected for absorption (“unabs”) in the 0.5–80-keV energy range. Uncertainties on the flux offer a more realistic representation of the error range than do the uncertainties on the normalizations which are large and mostly omitted. Errors are quoted at 90% confidence.
Naturally, the strong magnetic field of the pulsar influences the dynamics of the accretion disk out to a certain distance (Ghosh & Lamb, 1979). Material within the corotation radius is forced to corotate with the neutron star and if its angular velocity is less than the local Keplerian velocity, then the material can be accreted along the field lines (this implies a magnetospheric radius smaller than the corotation radius). Depending on whether the accreted material’s angular momentum has the same or an opposite direction as the neutron star’s spin, this will cause the neutron star to spin faster or slower, respectively (Waters & van Kerkwijk, 1989). The consistent downward trend of the pulsation period in IGR J163934643 (catalog ) suggests that material in the accretion disk orbits in the same direction as the neutron star’s spin.
Additional accretion dynamics can be elucidated from the power density spectrum (PDS). Going from low frequency to high frequency, the PDS changes from a flat power law (slope ) to a steeper power law (slope ). The PDS breaks at a frequency of 0.00108(21) Hz which is very close to the spin frequency of the neutron star (0.0011062(1) Hz). These characteristics of the PDS in persistent, accreting X-ray pulsars are described by Revnivtsev et al. (2009), and they suggest that the neutron star in IGR J163934643 (catalog ) is spinning close to corotation with the inner edge of an accretion disk that has been truncated by the magnetic field. Using canonical values for the neutron star mass () and magnetic dipole moment ( G cm-3 for G), this gives estimates of cm and cm for the magnetospheric radius assuming mass accretion rates of yr-1 and yr-1, respectively. However, an alternative model for quasi-spherical wind accretion developed by Shakura et al. (2012) could also produce the observed change in spin frequency, and in this case, an accretion disk is not required.
5. Summary & Conclusions
A NuSTAR observation of IGR J163934643 (catalog ) has revealed valuable insights into the nature of this source. The detection of a cyclotron resonant scattering feature at keV allowed us to constrain the magnetic field strength to G. This is the first time that the magnetic field has been measured in this object. The cyclotron line was not detected in previous excursions into this energy range by RXTE-ASM, INTEGRAL-ISGRI, and Suzaku-HXD. This result is a testament to the spectral sensitivity and resolving power of NuSTAR.
The pulsation period of the neutron star in IGR J163934643 (catalog ) is now at 904.00.1 s. Looking at the five measurements made between 2006 and 2014, we find that this period has consistently gotten shorter with time at an average long-term spin-up rate of 0.6 s per year ( Hz s-1). The slope of the power density spectrum breaks near the pulsation frequency as expected for persistently emitting accretion-powered pulsars. This could indicate that a transient and magnetically truncated accretion disk is almost in corotation with the neutron star whose magnetospheric radius is around cm, although accretion from a quasi-spherical wind could also lead to the observed change in pulsation frequency.
IGR J163934643 (catalog ) is an archetype of the class of heavily obscured wind-accreting pulsars, with its ks-long pulsation period and its column density that is at least an order of magnitude greater than the expected line-of-sight value. Yet its source classification has been subject to multiple changes over the years and the identity of the donor star remains elusive. Results we obtained thanks to NuSTAR represent new puzzle pieces to add to the still-developing picture we have of this intriguing source.
References
- Arnaud (1996) Arnaud, K. A. 1996, in Astronomical Society of the Pacific Conference Series, Vol. 101, Astronomical Data Analysis Software and Systems V, ed. G. H. Jacoby & J. Barnes, 17
- Becker & Wolff (2005) Becker, P. A., & Wolff, M. T. 2005, ApJ, 630, 465
- Bellm et al. (2014) Bellm, E. C., Fürst, F., Pottschmidt, K., et al. 2014, ApJ, 792, 108
- Bhalerao et al. (2015) Bhalerao, V., Romano, P., Tomsick, J., et al. 2015, MNRAS, 447, 2274
- Bildsten et al. (1997) Bildsten, L., Chakrabarty, D., Chiu, J., et al. 1997, ApJS, 113, 367
- Bird et al. (2004) Bird, A. J., Barlow, E. J., Bassani, L., et al. 2004, ApJ, 607, L33
- Bodaghee et al. (2012) Bodaghee, A., Rahoui, F., Tomsick, J. A., & Rodriguez, J. 2012, ApJ, 751, 113
- Bodaghee et al. (2006) Bodaghee, A., Walter, R., Zurita Heras, J. A., et al. 2006, A&A, 447, 1027
- Bodaghee et al. (2014) Bodaghee, A., Tomsick, J. A., Krivonos, R., et al. 2014, ApJ, 791, 68
- Boerner et al. (1987) Boerner, G., Hayakawa, S., Nagase, F., & Anzer, U. 1987, A&A, 182, 63
- Bondi (1952) Bondi, H. 1952, MNRAS, 112, 195
- Burnard et al. (1991) Burnard, D. J., Arons, J., & Klein, R. I. 1991, ApJ, 367, 575
- Burrows et al. (2005) Burrows, D. N., Hill, J. E., Nousek, J. A., et al. 2005, Space Sci. Rev., 120, 165
- Caballero & Wilms (2012) Caballero, I., & Wilms, J. 2012, Mem. Soc. Astron. Italiana, 83, 230
- Chaty et al. (2008) Chaty, S., Rahoui, F., Foellmi, C., et al. 2008, A&A, 484, 783
- Coburn et al. (2002) Coburn, W., Heindl, W. A., Rothschild, R. E., et al. 2002, ApJ, 580, 394
- Coley et al. (2015) Coley, J. B., Corbet, R. H. D., & Krimm, H. A. 2015, ApJ, 808, 140
- Combi et al. (2004) Combi, J. A., Ribó, M., Mirabel, I. F., & Sugizaki, M. 2004, A&A, 422, 1031
- Corbet (1986) Corbet, R. H. D. 1986, MNRAS, 220, 1047
- Corbet & Krimm (2013) Corbet, R. H. D., & Krimm, H. A. 2013, ApJ, 778, 45
- Corbet et al. (2010) Corbet, R. H. D., Krimm, H. A., Barthelmy, S. D., et al. 2010, The Astronomer’s Telegram, 2570, 1
- Cutri et al. (2003) Cutri, R. M., Skrutskie, M. F., van Dyk, S., et al. 2003, 2MASS All Sky Catalog of point sources. (Cutri, R. M., Skrutskie, M. F., van Dyk, S., Beichman, C. A., Carpenter, J. M., Chester, T., Cambresy, L., Evans, T., Fowler, J., Gizis, J., Howard, E., Huchra, J., Jarrett, T., Kopan, E. L., Kirkpatrick, J. D., Light, R. M., Marsh, K. A., McCallon, H., Schneider, S., Stiening, R., Sykes, M., Weinberg, M., Wheaton, W. A., Wheelock, S., & Zacarias, N.)
- Fornasini et al. (2014) Fornasini, F. M., Tomsick, J. A., Bodaghee, A., et al. 2014, ApJ, 796, 105
- Ghosh & Lamb (1979) Ghosh, P., & Lamb, F. K. 1979, ApJ, 234, 296
- Harrison et al. (2013) Harrison, F. A., Craig, W. W., Christensen, F. E., et al. 2013, ApJ, 770, 103
- Hartman et al. (1999) Hartman, R. C., Bertsch, D. L., Bloom, S. D., et al. 1999, ApJS, 123, 79
- Horne & Baliunas (1986) Horne, J. H., & Baliunas, S. L. 1986, ApJ, 302, 757
- Ikhsanov et al. (2014) Ikhsanov, N. R., Likh, Y. S., & Beskrovnaya, N. G. 2014, Astronomy Reports, 58, 376
- Islam et al. (2015) Islam, N., Maitra, C., Pradhan, P., & Paul, B. 2015, MNRAS, 446, 4148
- Koh et al. (1997) Koh, D. T., Bildsten, L., Chakrabarty, D., et al. 1997, ApJ, 479, 933
- Krivonos et al. (2015) Krivonos, R. A., Tsygankov, S. S., Lutovinov, A. A., et al. 2015, ApJ, 809, 140
- Lamb et al. (1973) Lamb, F. K., Pethick, C. J., & Pines, D. 1973, ApJ, 184, 271
- Leahy (1987) Leahy, D. A. 1987, A&A, 180, 275
- Lomb (1976) Lomb, N. R. 1976, Ap&SS, 39, 447
- Lutovinov & Tsygankov (2009) Lutovinov, A. A., & Tsygankov, S. S. 2009, Astronomy Letters, 35, 433
- Madsen et al. (2015) Madsen, K. K., Harrison, F. A., Markwardt, C., et al. 2015, ArXiv e-prints: 1504.01672, arXiv:1504.01672
- Malizia et al. (2004) Malizia, A., Bassani, L., Di Cocco, G., et al. 2004, The Astronomer’s Telegram, 227, 1
- Nagase (1989) Nagase, F. 1989, PASJ, 41, 1
- Nespoli et al. (2010) Nespoli, E., Fabregat, J., & Mennickent, R. E. 2010, A&A, 516, A94
- Press & Rybicki (1989) Press, W. H., & Rybicki, G. B. 1989, ApJ, 338, 277
- Pringle & Rees (1972) Pringle, J. E., & Rees, M. J. 1972, A&A, 21, 1
- Protassov et al. (2002) Protassov, R., van Dyk, D. A., Connors, A., Kashyap, V. L., & Siemiginowska, A. 2002, ApJ, 571, 545
- Revnivtsev et al. (2009) Revnivtsev, M., Churazov, E., Postnov, K., & Tsygankov, S. 2009, A&A, 507, 1211
- Scargle (1982) Scargle, J. D. 1982, ApJ, 263, 835
- Schönherr et al. (2007) Schönherr, G., Wilms, J., Kretschmar, P., et al. 2007, A&A, 472, 353
- Shakura et al. (2012) Shakura, N., Postnov, K., Kochetkova, A., & Hjalmarsdotter, L. 2012, MNRAS, 420, 216
- Shakura et al. (2015) Shakura, N. I., Postnov, K. A., Kochetkova, A. Y., et al. 2015, Astronomy Reports, 59, 645
- Sugizaki et al. (2001) Sugizaki, M., Mitsuda, K., Kaneda, H., et al. 2001, ApJS, 134, 77
- Thompson et al. (2006) Thompson, T. W. J., Tomsick, J. A., Rothschild, R. E., in’t Zand, J. J. M., & Walter, R. 2006, ApJ, 649, 373
- Tsunemi (1989) Tsunemi, H. 1989, PASJ, 41, 453
- Verner et al. (1996) Verner, D. A., Ferland, G. J., Korista, K. T., & Yakovlev, D. G. 1996, ApJ, 465, 487
- Walter et al. (2015) Walter, R., Lutovinov, A. A., Bozzo, E., & Tsygankov, S. S. 2015, A&A Rev., 23, 2
- Walter et al. (2006) Walter, R., Zurita Heras, J., Bassani, L., et al. 2006, A&A, 453, 133
- Waters & van Kerkwijk (1989) Waters, L. B. F. M., & van Kerkwijk, M. H. 1989, A&A, 223, 196
- White et al. (1983) White, N. E., Swank, J. H., & Holt, S. S. 1983, ApJ, 270, 711
- Wilms et al. (2000) Wilms, J., Allen, A., & McCray, R. 2000, ApJ, 542, 914