2012 Vol. X No. XX, 000–000
22institutetext: National Astronomical Observatories, Chinese Academy of Sciences, Beijing 100012, China
33institutetext: Department of Astronomy, Beijing Normal University, Beijing, 100875, P. R. China
44institutetext: Nanjing Institute of Astronomical Optics & Technology, National Astronomical Observatories, Chinese Academy of Sciences, Nanjing 210042, China
\vs\noReceived —; accepted —
FGK 22 m Excess Stars in LAMOST DR2 Stellar Catalog
Abstract
Since the release of LAMOST (the Large Sky Area Multi-Object Fiber Spectroscopic Telescope) catalog, we have the opportunity to use the LAMOST DR2 stellar catalog and WISE All-sky catalog to search for 22 m excess candidates. In this paper, we present 10 FGK candidates which show an excess in the infrared (IR) at 22 m. The ten sources are all the newly identified 22 m excess candidates. Of these 10 stars, 5 stars are F type and 5 stars are G type. The criterion for selecting candidates is . In addition, we present the spectral energy distributions (SEDs) covering wavelength from optical to mid-infrared band. Most of them show an obvious excess from 12 m band and three candidates even show excess from 3.4 m. To characterize the amount of dust, we also estimate the fractional luminosity of ten 22 m excess candidates.
keywords:
infrared: planetary systems — stars: formation — planetary systems: protoplanetary disks1 Introduction
More and more surveys (IRAS, Infrared Space Observatory (ISO), Spitzer Space Telescope, Herschel, WISE, etc.) have been conducted to search for IR excess stars (especially the dusty disks and exoplanets system) since the first discovery of the IR excess phenomenon (known as a debris disk) around the Vega in 1980s (Aumann et al., 1984).
In fact, there are many reasons that can cause excess at IR band (Wu et al., 2013). Protostars (Thompson, 1982), surrounding dust disk (Gorlova et al., 2004, 2006; Rhee et al., 2007; Hovhannisyan et al., 2009; Koerner et al., 2010; Wu et al., 2012), companion star (like white dwarfs + M stars, white dwarfs + brown dwarfs or + dusty disks) (Debes et al., 2011), giant stars, background galaxy, background nebula, interstellar medium and random foreground object (Ribas et al., 2012) could all produce infrared excess. In our study, we only focus on the IR excess stars which are caused by protostars and surrounding dust disk.
In previous work, there is not a complete stars catalog with so much spectral information to be used for searching IR excess stars. The LAMOST (Cui et al., 2012) Data Release 2 (DR2) contains 4,136,482 spectra and it is the largest stellar spectral catalog in the world at present. Undoubtedly, it will provide us with unique insights into the population of IR excess stars. More detailed about LAMOST data will be described in Sec 2.1.
While searching the infrared excess stars from LAMOST Stellar Catalog, we also introduce the Wide-field Infrared Survey Explorer (WISE; Wright et al. 2010) All-sky data (Wu et al., 2013). Some recent work about studying IR excess stars with WISE have been published. Rizzuto et al. (2012) presented an analysis of 829 WISE stars in the Sco-Cen OB2 association and observed that B-type stars have a smaller excess fraction than A and F-type stars. Luhman & Mamajek (2012) found new transitional, evolved and debris disks candidates from Spitzer and WISE data. Wu et al. (2013) focused on the bright stars () and searched more than 70 new identified 22 m excess stars. Vican & Schneider (2014) studied 2820 solar type stars and found 74 new stars with WISE excess at 22 m. Patel et al. (2014) presented a sensitive search for WISE W3 and W4 excess candidates within 75 pc from the Sun and expanded the number of known 10-30 m excesses to 379. Theissen & West (2014a, c, b) studied M dwarfs with WISE 12 and 22 m excess.
2 Data
2.1 LAMOST Survey
LAMOST, also known as Wang-Su Reflecting Schmidt Telescope, is a new type of wide field telescope with a large aperture. The advantages of wide field and large aperture, combined with 4000 fibers (taking 4000 spectra in a single exposure), provide us with opportunity to carry out even the largest stellar and galactic survey (Zhao et al., 2012). The limiting magnitude is as faint as r=19 at the resolution R=1800, which is equivalent to the design aim of r=20 for the resolution R=500.
To maximize the scientific potential of the facility, wide national participation and international collaboration have been emphasized. The survey has two major components: the LAMOST ExtraGAlactic Survey (LEGAS) and the LAMOST Experiment for Galactic Understanding and Exploration (LEGUE) survey of Milky Way stellar structure.
The first observation mission of the LAMOST regular survey launched on September 28, 2012 (Luo et al., 2012), and have been already successfully finishied on July 15, 2013. Totally, over 1.2 million spectra with signal to noise larger than 10 of 689 square degrees are obtained. The data set of LAMOST data release one (DR1), including spectra of the pilot survey and spectra of the first year of the regular spectroscopic survey, have already published to domestic data users and foreign partners. The DR1 totally contains 2,204,860 spectra, including 717,660 spectra of pilot survey and 1,487,200 spectra of regular survey.
In the stellar catalog, there are 648,820 stars in pilot survey and 1,295,586 stars in the first year spectroscopic survey. In addition, the stellar catalog contains the atmospheric parameters of 1,085,404 stars, which becomes the largest stellar spectral parameters catalog in the world at present.
The secend year observation mission of the LAMOST regular survey launched on September, 2013, and have been already successfully accomplished on July ,2014 under the joint effort of entire staffs of the center for operation and development of Guoshoujing telescope. Totally, over 1.3 million spectra with signal to noise larger than 10 are obtained during the past year, which sufficiently demonstrate the advantage of LAMOST in spectra accessing. The data set of LAMOST data release two (DR2), including spectra of the pilot survey and spectra of the past two years of the regular spectroscopic survey, have already published to domestic data users and foreign partners. The DR2 totally contains 4,136,482 spectra, including 909,520 spectra of pilot survey and 3,226,962 spectra of regular survey. In addition, the DR2 contains the atmospheric parameters of 2,207,788 stars, which becomes the largest stellar spectral parameters catalog in the world at present. 111www.lamost.org
2.2 Data Selection
As described above, we mainly used the WISE All-sky catalog and LAMOST DR2 stellar catalog to search IR excess stars in this paper. Before doing the cross-match, we chose the FGK stars from LAMOST DR2 stellar catalog, because the FGK stars have more reliable photometric information. Then we uploaded the coordinates of chosen FGK stars into WISE all-sky catalog download website with matching radius (Wu et al., 2013) and (Contamination and confusion flag), 5,511 stars are obtained.
The Signal to Noise () is an important index for photometric precision and it affects the selecting accuracy of candidates directly. So we deleted those sources with in the W1, W2, W3, W4, and band from 5,511 sources. Then 2,214 sources are left.
To reduce the effection of variable star, contamination and bad pixels in the CCD, we considered the related index ( and Symbol ? indicates w1, w2, w3 and w4 band) provided in the WISE All-sky catalog. These indexes can help us select out stars with much higher photometric accuracy. To this step, 2,134 sources are obtained.
Moreover, there is another important index, saturation! In the WISE catalog, saturation begins to occur for point sources brighter than , , and mag. By this criterion, there will be no saturated stars in our candidates. Last, we obtained 1,120 stars (gray regions in Figure 1.)
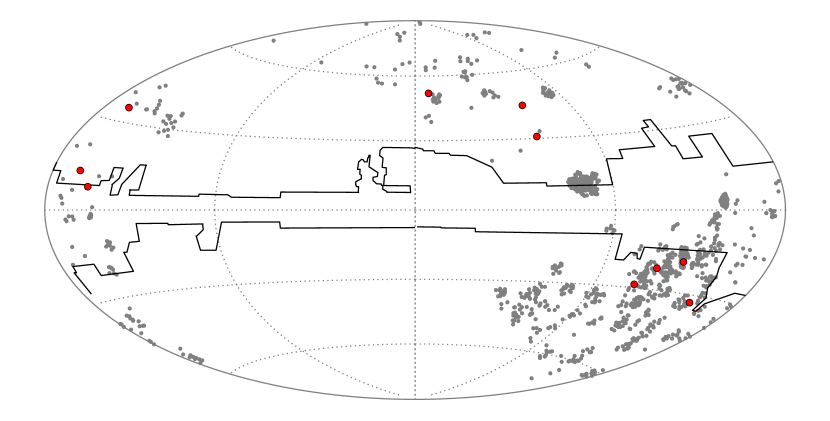
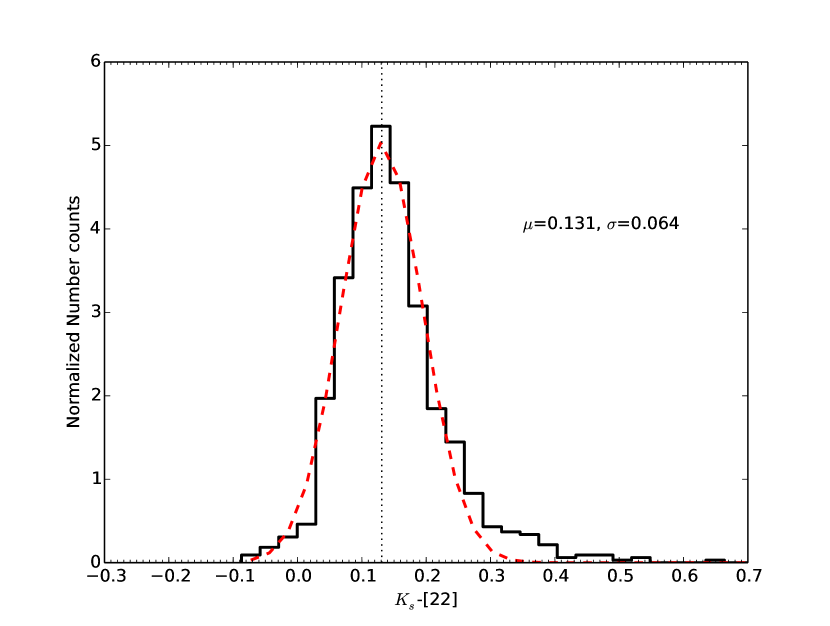
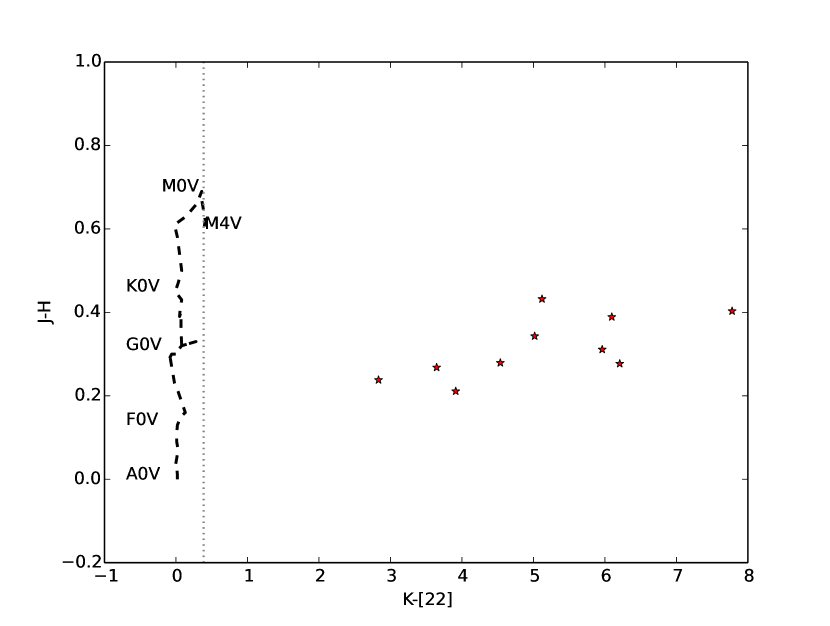
The method of selecting 22 m excess stars is similar with our previous work (Wu et al., 2013). In this work, we gave the criterion by fitting the histgram of with a gaussian function. Figure 2 shows the histgram of . To reduce the bias introduced by the small number of matched catalog, we use 4 confidence for all the 1,120 sources. That means the criterion used in this work is . The vs. diagram can also help to reject those with incorrect spectral type by comparing with normal dwarf stars (dashed line in Figure 3). There are 64 sources with . To remove the background contamination, we selected those with IRAS 100 m backgound level lower than 5 MJy (Kennedy & Wyatt, 2012; Wu et al., 2013). Then 54 sources are eliminated and ten [22] m excess candidates are obtained lastly. (red points in Figure 1).
3 Analysis and Results
3.1 Notes on candidates
| ID | RA | DEC | K-[22] | log | e_log | e_ | [Fe/H] | e_[Fe/H] | SPT | |||
|---|---|---|---|---|---|---|---|---|---|---|---|---|
| (LAMOST) | (J2000) | (J2000) | (mag) | (K) | ||||||||
| J000153.53+330250.0 | 0.4730602 | 33.0472467 | 5.017 | 4.527 | 0.518 | 5666.7 | 224.52 | 0.004 | 0.242 | 14.02 | G6 | 2.3e-3 |
| J002623.58+403943.1 | 6.5982554 | 40.6619950 | 7.779 | 4.117 | 0.622 | 5905.99 | 222.03 | -0.228 | 0.237 | -58.37 | G2 | 3.5e-2 |
| J012825.91+432504.2 | 22.1079984 | 43.4178478 | 3.913 | 4.209 | 0.485 | 6242.06 | 159.5 | -0.146 | 0.165 | -39.14 | F6 | 4.2e-4 |
| J023430.10+243831.9 | 38.625456 | 24.6422148 | 5.120 | 4.713 | 0.331 | 5068.22 | 83.28 | -0.006 | 0.116 | -3.16 | G9 | 2.1e-3 |
| J070240.89+114104.0 | 105.6703877 | 11.6844692 | 6.207 | 4.379 | 0.481 | 6199.84 | 176.02 | -0.011 | 0.175 | -13.49 | F2 | 9.0e-3 |
| J070904.25+202205.4 | 107.2677215 | 20.3681877 | 6.096 | 3.722 | 0.739 | 5530.51 | 183.66 | -0.596 | 0.233 | 46.47 | G3 | 8.9e-3 |
| J083820.18+283823.0 | 129.5841041 | 28.6397304 | 2.833 | 4.343 | 0.420 | 6201.13 | 86.15 | -0.175 | 0.101 | 31.7 | F7 | 2.1e-4 |
| J151031.26+072454.1 | 227.6302529 | 7.415044 | 3.646 | 4.301 | 0.470 | 6034.04 | 110.4 | -0.4 | 0.136 | 11.88 | F7 | 3.9e-4 |
| J162412.18+385720.8 | 246.0507688 | 38.9558047 | 5.962 | 4.33 | 0.480 | 6255.22 | 206.16 | -0.364 | 0.237 | -61.45 | F5 | 3.5e-3 |
| J173214.60+360622.1 | 263.0608529 | 36.106158 | 4.537 | 4.144 | 0.548 | 5914.00 | 143.17 | 0.159 | 0.136 | -49.44 | G3 | 1.1e-3 |
Column 1: Names of candidates
Column 2-3: Coordinates of candidates
Column 4: K-[22] - Criterion of selecting 22 m excess
Column 5: log - Surface Gravity
Column 6: e_log - Surface Gravity Uncertainty
Column 7: - Effective Temperature
Column 8: e_ - Effective Temperature Uncertainty
Column 9: [Fe/H] - Metallicity
Column 10: e_[Fe/H] - Metallicity Uncertainty
Column 11: - Heliocentric Radial Velocity
Column 12: SPT - Spectral type
Column 13: - Fractional Luminosity
Table 1 shows the selected 10 IR excess candidates. The names of the 10 candidates are from WISE catalog. From the values of list in Table 1 we can see that all the ten candidates show obviously excess in the 22 m. log, , [Fe/H], and Spectral type are the stellar parameters provided by LAMOST DR2. The fractional luminosity , which is defined as the ratio of integrated infrared excess of the disk to bolometric luminosity of star, is also estimated for each candidate. More detailed can be seen in Section 3.4.
Compared with database (like SIMBAD) and previous work, they are all the newly identified 22 m excess candidates. The spectral type of the ten candidates range from F2 to G9.
3.2 Hertzsprung-Russell Diagram
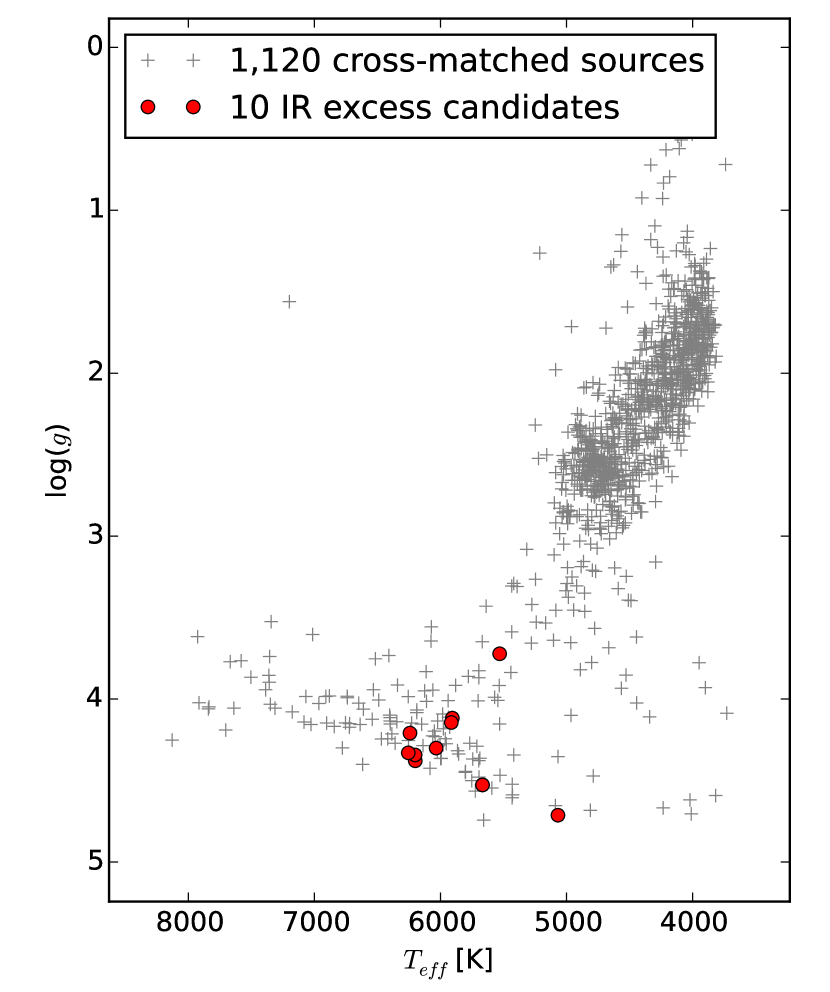
Generally, researches of debris disks or IR excess stars mainly focus on the main-sequence stars. However, there are still some work about giant stars with IR excess ((Jones, 2008; Groenewegen, 2012)). The stellar parameters provided in LAMOST DR2 can help us to separate main-sequence stars and giants. Figure 4 shows the temperature versus (g) Hertzsprung-Russell (short for H-R) diagram.
3.3 Spectral Energy Distribution
Figure 5 shows the SEDs of 10 selected IR excess candidates. All these SEDs are fitted by using optical band information provided by LAMOST DR2, near infrared band (J, H, K, W1, W2, W3 and W4) provided by 2MASS and WISE. The fitted stellar parameters are consistent with those given by LAMOST. (Table 1) (Robitaille et al., 2007; Kurucz, 1979). All the candidates show an obvious excess at 22 m (W4), even at 12 m band (Figure 5). The up triangular symbols mean flux excess comparing to black body radiation. Some even show excess in the 3.4 m band (J002623.58+403943.1, J070240.89+114104.0 and J070904.25+202205.4), which indicates that they are surrounded by hotter dust than other candidates.
Since there is no photometric information in longer band, we do not know the peak of the infrared excess and can not determine the shape of disks around candidates. Therefore, we need far-infrared observation to confirm in the future.


3.4 Fractional Luminosity
The fractional luminosity () can be used to characterize the amount of dust. So we estimated in this paper. We assumed as the total IR luminosity because of the absence of longer bands in WISE. Detailed method can be seen in Wu et al. (2013).
The fractional luminosities of ten candidates are listed in Table 1. All the s mainly range from to . Only the of J002623.58+403943.1 is even lager than . It has been argued that debris disks are confined to . So J002623.58+403943.1 probably contains a significant amount of gas (Artymowicz, 1996; Wu et al., 2012). It is worth to verified in the future work. There is no consensus on the relation between and ages (Wu et al., 2013). So we can not conclude whether these candidates are young or old.
4 Summary
In this work, we use LAMOST DR2 stellar catalog and WISE All-sky catalog to search for 22 m excess candidates. The searching method used in this paper is vs diagram (Wu et al., 2013). Then we obtain 10 high-precision candidates with 22 m excess. Each candidate presented here can be studied further with higher angular resolutioninfrared imaging or infrared spectroscopy. Among the 10 candidates, 5 stars are F type stars and 5 are G stars. We also provide the SEDs for all the candidates covering wavelength from optical to mid-infrared band. From the SEDs, we find that almost all of the 10 candidates show obvious excess in 12 m. There are 3 candidates even show excess in 3.4 m. Finally, we estimated the fractional luminosity for each candidate. There is one candidate even has larger than .
Acknowledgements.
Ch.-J. Wu thanks C. Liu and Y.-F. Huang for valuable discussion and L. Lan for warmhearterd help. This project is supported by the National Natural Science Foundation of China (grant No. 11403061), the China Ministry of Science and Technology under the State Key Development Program for Basic Research (2014CB845705, 2012CB821800), the National Natural Science Foundation of China (grant Nos. 11173030, 11225316, 11078017, 11303038, 10833006, 10978014, and 10773014), the Key Laboratory of Optical Astronomy, National Astronomical Observatories, Chinese Academy of Sciences. Guoshoujing Telescope (the Large Sky Area Multi-Object Fiber Spectroscopic Telescope LAMOST) is a National Major Scientific Project built by the Chinese Academy of Sciences. Funding for the project has been provided by the National Development and Reform Commission. LAMOST is operated and managed by the National Astronomical Observatories, Chinese Academy of Sciences.References
- Artymowicz (1996) Artymowicz, P. 1996, New York: Springer, 137
- Aumann et al. (1984) Aumann, H. H., Beichman, C. A., Gillett, F. C., et al. 1984, ApJ, 278, L23
- Cui et al. (2012) Cui, X.-Q., Zhao, Y.-H., Chu, Y.-Q., & thers. 2012, RAA, 12, 1197
- Debes et al. (2011) Debes, J. H., Hoard, D. W., Wachter, S., et al. 2011, ApJS, 197, 38
- Gorlova et al. (2004) Gorlova, N., Padgett, D. L., Rieke, G. H., et al. 2004, ApJS, 154, 448
- Gorlova et al. (2006) Gorlova, N., Rieke, G. H., Muzerolle, J., et al. 2006, ApJ, 649, 1028
- Groenewegen (2012) Groenewegen, M. A. T. 2012, A&A, 540, A32
- Hovhannisyan et al. (2009) Hovhannisyan, L. R., Mickaelian, A. M., Weedman, D. W., et al. 2009, AJ, 138, 251
- Jones (2008) Jones, M. H. 2008, MNRAS, 387, 845
- Kennedy & Wyatt (2012) Kennedy, G. M., & Wyatt, M. C. 2012, MNRAS, 426, 91
- Koerner et al. (2010) Koerner, D. W., Kim, S., Trilling, D. E., et al. 2010, ApJ, 710, L26
- Kurucz (1979) Kurucz, R. L. 1979, ApJS, 40, 1
- Luhman & Mamajek (2012) Luhman, K. L., & Mamajek, E. E. 2012, ApJ, 758, 31
- Luo et al. (2012) Luo, A.-L., Zhang, H.-T., Zhao, Y.-H., et al. 2012, RAA, 12, 1243
- Patel et al. (2014) Patel, R. I., Metchev, S. A., & Heinze, A. 2014, ApJS, 212, 10
- Rhee et al. (2007) Rhee, J. H., Song, I., Zuckerman, B., et al. 2007, ApJ, 660, 1556
- Ribas et al. (2012) Ribas, Á., Merín, B., Ardila, D. R., et al. 2012, A&A, 541, A38
- Rizzuto et al. (2012) Rizzuto, A. C., Ireland, M. J., & Zucker, D. B. 2012, MNRAS, 421, L97
- Robitaille et al. (2007) Robitaille, T. P., Whitney, B. A., Indebetouw, R., et al. 2007, ApJS, 169, 328
- Theissen & West (2014a) Theissen, C. A., & West, A. A. 2014a, ApJ, 794, 146
- Theissen & West (2014b) Theissen, C., & West, A. A. 2014b, in American Astronomical Society Meeting Abstracts, Vol. 223, American Astronomical Society Meeting Abstracts 223, 441.16
- Theissen & West (2014c) Theissen, C., & West, A. A. 2014c, in American Astronomical Society Meeting Abstracts, Vol. 224, American Astronomical Society Meeting Abstracts 224, 322.10
- Thompson (1982) Thompson, R. I. 1982, ApJ, 257, 171
- Vican & Schneider (2014) Vican, L., & Schneider, A. 2014, ApJ, 780, 154
- Wright et al. (2010) Wright, E. L., Eisenhardt, P. R. M., Mainzer, A. K., et al. 2010, AJ, 140, 1868
- Wu et al. (2013) Wu, C.-J., Wu, H., Lam, M.-I., et al. 2013, ApJS, 208, 29
- Wu et al. (2012) Wu, H., Wu, C.-J., Cao, C., et al. 2012, RAA, 12, 513
- Zhao et al. (2012) Zhao, G., Zhao, Y.-H., Chu, Y.-Q., et al. 2012, RAA, 12, 723