Characteristics of latitude distribution of sunspots and their links to solar activity in pre-Greenwich data
Abstract
We study and compare characteristics of sunspot group latitude distribution in two catalogs: the extended Greenwich (1874–2014) and Schwabe ones (1825–1867) [1]. We demonstrate that both datasets reveal similar links between latitude and amplitude characteristics of the 11-year cycle: the latitude dispersion correlates with the current activity and the mean latitude of sunspots in the cycle’s maximum is proportional to its amplitude, It agrees with conclusions that we made in papers [2, 3] for the Greenwich catalog.
We show that the latitude properties of sunspot distribution are much more stable against loss of observational data than traditional amplitude indices of activity. Therefore, the found links can be used for estimates of quality of observations and independent normalizing of activity levels in a gappy pre-Greenwich data. We demonstrate it using the Schwabe catalog as an example.
In addition, we show that the first part of the Schwabe data probably contains errors in determination of sunspot latitudes that lead to overestimation of the sunspot latitude dispersions.
1 Introduction
To characterize the level of solar activity one traditionally uses amplitude indices, which are calculated on the base of number and size of sunspots (the Wolf number, Group Sunspot Number, sums of sunspot group areas etc). However, until the beginning of the epoch of regular observations of sunspots those indices are often derived from non-uniform data, which contain errors due to loss or incorrect treating o of observations. For example, it is known (see, e.g., [4]), that the widely used Zürich series of the Wolf number before the middle of the 19th century was constructed by R. Wolf on the base of a fragmentary data.
In addition to amplitude indices there are data on spatial distributions of sunspot groups. First of all, such data are presented in the Greenwich catalog of sunspot groups. Recently other catalogs with sunspot coordinates for earlier epochs became available, e.g., the catalogs based on observations of Staudacher [5] and Schwabe [1].
On the one hand, both information on number of sunspots and on their latitude distribution is subjected to distortions caused by loss of observational data, but it is much weaker for the latter. On the other hand, there are stable links between the latitude distribution of sunspots in the 11-year solar cycle and its amplitude [2, 6, 3]. Therefore, latitude characteristics of sunspots can be used for control and correction of normalization of traditional series of amplitude indices. In this paper we demonstrate it analyzing the extended Greenwich catalogue (GC), that include the original Greenwich data and their extension by NOAA/USAF (http://solarscience.msfc.nasa.gov/greenwch.shtml), and the Schwabe catalog (SC) [1] (http://www.aip.de/members/rarlt/sunspots/schwabe).
2 Data and method
It is convenient to use as an amplitude characteristic of solar activity the index G that is equal to yearly averaged daily numbers of observed sunspot groups. This index can be readily obtained from sunspot groups catalogs, it is tightly related to the Group Sunspot Number index (GSN) proposed by Hoyt and Schatten [7] and differ from the latter basically in its normalization (G GSN/12). As a measure of the sunspot latitude extension we will use the yearly means of absolute values of sunspot group latitudes and their dispersions averaged over the two hemispheres .
In Fig. 1 the latitude distribution of groups (“the Maunder butterflies”) and indices G, and for GC (1874–2014) and SC (1825–1867) are plotted. In SC each drawing of the Sun is attributed by the so called “subjective quality flag” , and in the following we will use, unless otherwise stated, only data with corresponding to the highest quality. The thin lines in plots of and correspond to years of cyclic minimums and two adjacent years, which will not be taken into account in analysis of latitude properties, since in these years the wings of neighboring Maunder butterflies overlap, so the mean latitudes are ambiguous and the hemisphere dispersions are strongly overestimated.
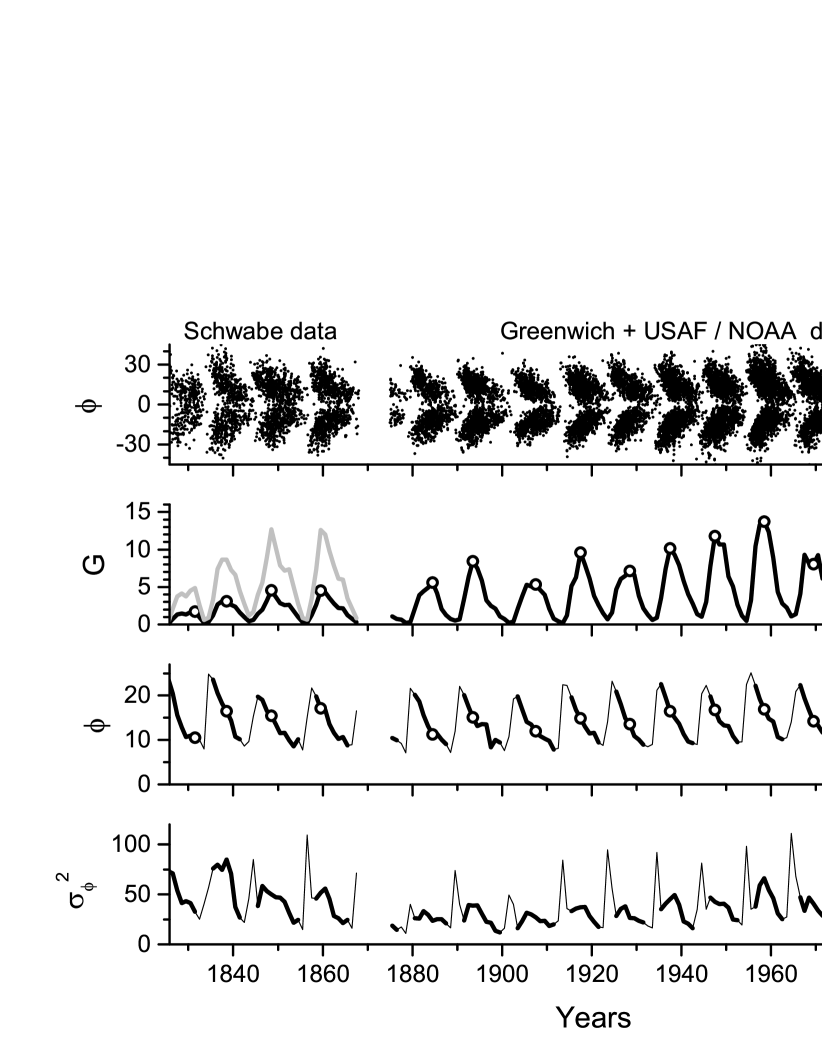
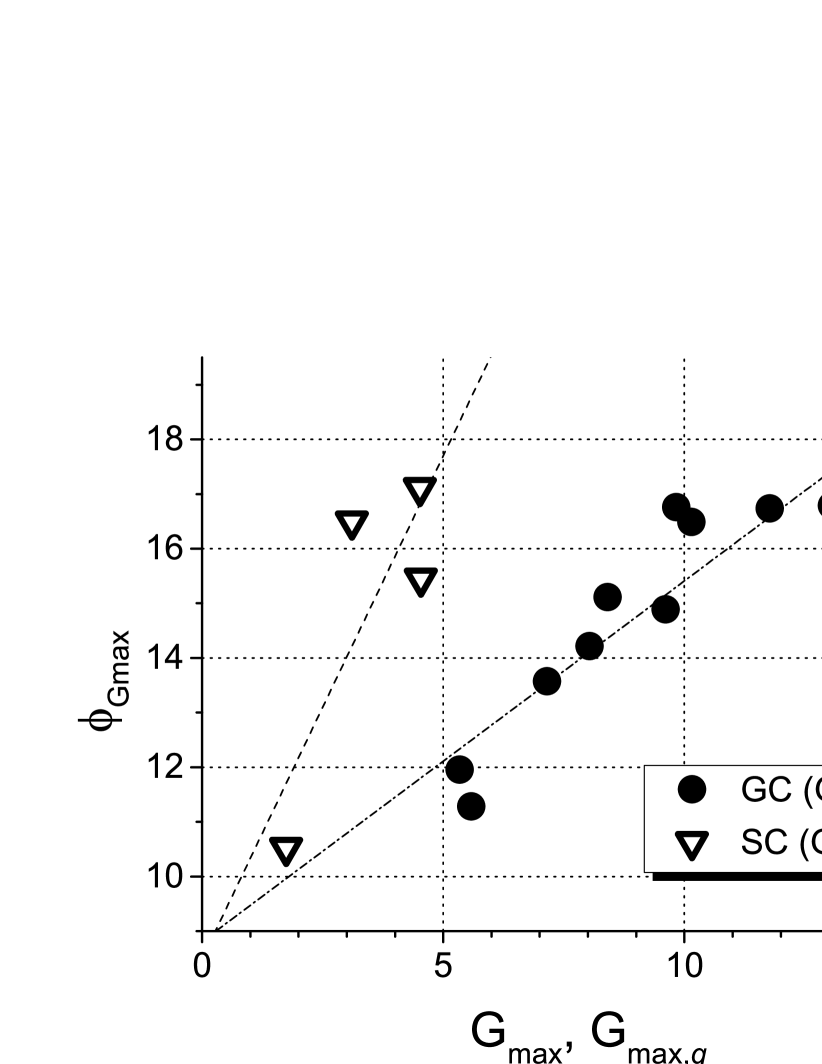
The empty circles in Fig. 1 mark maximums of index G and the mean latitudes corresponding to these moments. (for the bimodal 20th cycle the moment between two almost equal peaks is selected as a maximum). The values and are well correlated (the correlation coefficient , see Fig. 2) and related by the regression equation
| (1) |
For the Wolf numbers a similar relationship was found by Waldmeier as early as in the 1930s [8, 9]. It is tightly connected to the following two regularities:
(i) Evolution of the mean latitude of sunspots in the 11-year cycle (“the Spörer law”), as it was demonstrated by Ivanov and Miletsy in [3], can be described by the universal dependence , where is the moment of the cycle minimum, the coefficient correlates with the amplitude of the cycle and does not depend upon this amplitude;
(ii) According to the Waldmeier rule [10] maximums in higher cycles tend to take place earlier than in lower ones.
One can easily deduce from rules (i) and (ii) that the mean latitude in the maximum must be higher for more powerful cycles, in agreement with expression (1).
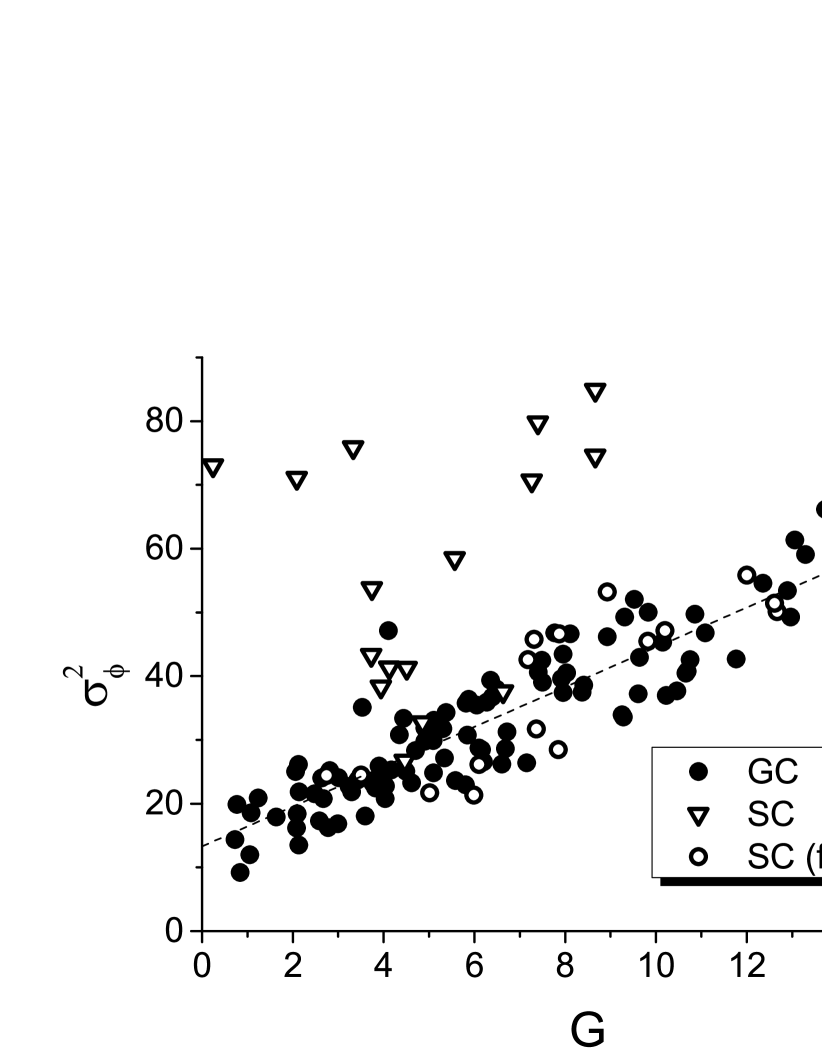
Besides, in papers [11, 2, 6] we found a relationship between the latitude extension of the sunspot distribution and the level of solar activity. For GC such relationship between G and the dispersion (see Fig. 3) can be described by the regression
| (2) |
with correlation .
It is important to note that the both mentioned relations are not destroyed in cases when a part of observations is lost. To show it, we artificially sparsed GC, randomly selecting from the data one qth part of observations. Regressions (1) and (2) in this case turn to
| (3) |
and
| (4) |
where variables with indices correspond to the sparse GC and the additional “loss factor” in and compensates the loss of data in the catalog. Behavior of the ratios and , which characterizes change of the relationships between amplitude and latitude extension of sunspot activity with growth of as compared with the same relationships for the full GC (i.e. for ), is presented in Fig. 4. One can see that even for (i.e. when 99% of observations are lost), relative variations of the regression coefficients are limited by the range 20–25%.

Such stability of the found relationships against loss of data allows their using for control or/and restoration of normalization of amplitude indices of solar activity in catalogs of sunspots.
3 Restoration of normalization in the Schwabe catalog
Let us demonstrate how relation (1) can be used for restoration of amplitude indices by the example of the Schwabe catalog. To do it we plot for SC the dependence (Fig. 2) and build the corresponding regression
| (5) |
where are maximums of cycles for the “raw” indices , calculated by SC and the coefficient corresponds to some (a priori unknown) loss of data. Comparing (1), (3) and (5), one can find and obtain “renormed” indices (the gray curve in the second panel of Fig. 1) with the distortion due to the data loss corrected.
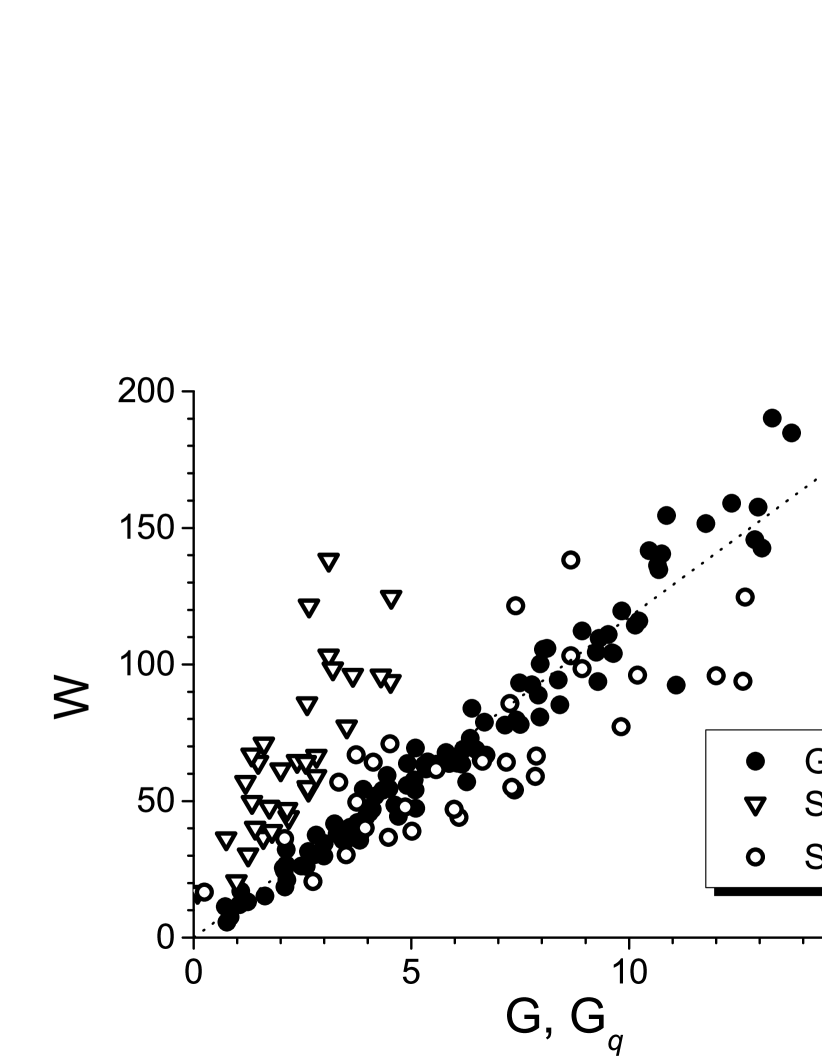
In this case we can independently control agreement of the obtained renormalization using the Wolf numbers W that are known for this epoch. In Fig. 5 the relations between indices W and G for GC, “raw” () and renormed (G) indices for GC are shown. One can see that the normalization, which we obtained without using of the known Wolf numbers, agrees with the latter rather well.
4 Latitude dispersions in the Schwabe catalog
Let us study the second relationship (2) between G and (Fig. 3), using the renormalized G found for SC. One can see that the properties of this dependence vary and it agrees with the relation found for GC only since 1847. If we assume that the normalization of index G for SC is valid, we conclude that until the middle of the 1840s the dispersions of the latitude distribution are anomalously large. One can make the same conclusion from Fig. 1, where in the corresponding cycles the unusually great number of sunspot are sited close to the equator.
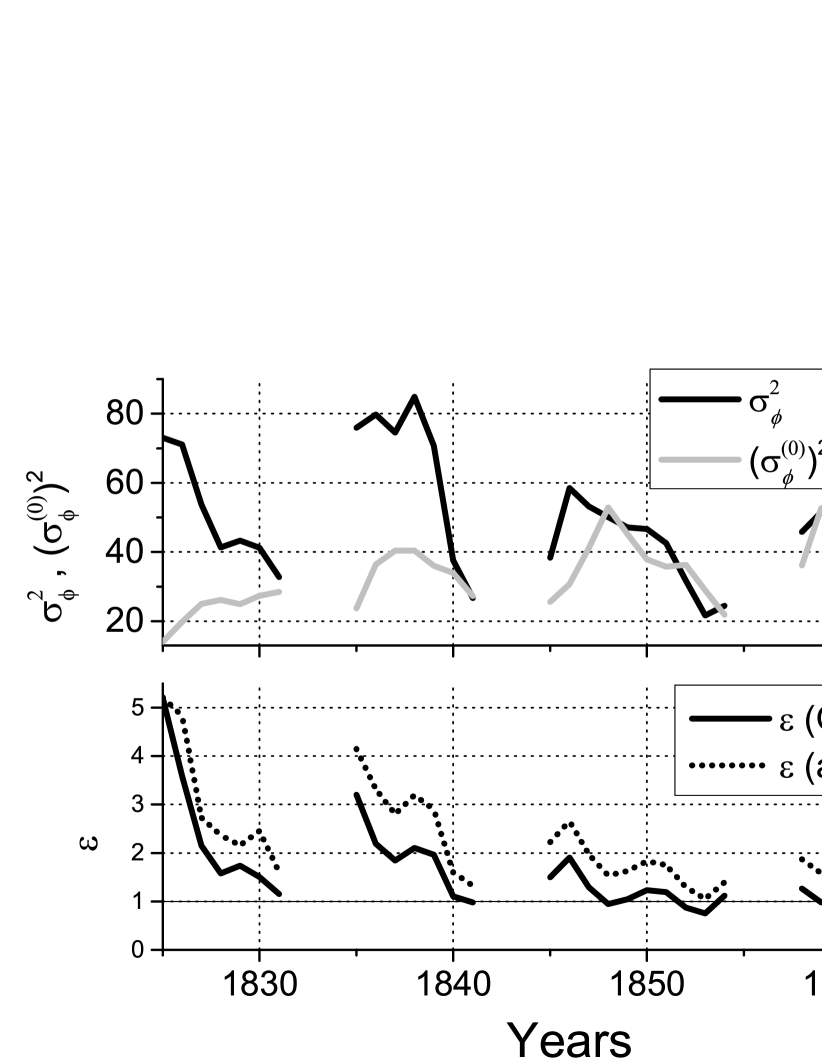
In the top panel of Fig. 6 the latitude dispersions , which are calculated directly from the data of SC, and the values obtained from G with use of the relation (2), are plotted. We assume that the relation (2) remained valid for sunspots in the pre-Greenwich epoch, so the visible difference in the dependence between activity and latitude dispersion of GC and SC are caused by some errors in the latter. This error can be described by the value (see the bottom panel of Fig. 6). This relation is large for the cycles 7 and 8 and decreases almost to unity after the middle of 1840s. Let us note that if one uses all data of SC (the dotted curves of the bottom panel) rather than observations with the quality flag only (the solid curves), the magnitude of s become notably larger. Therefore, we assume that GC contains errors in determination of sunspot latitudes that are larger for drawings of low quality and decrease to the end of the period of observations. It seems probable that the cause of these errors is wrong determination of the position of the solar equator in drawings of Schwabe. Apparently, in the case of systematic inclinations of the equator line on the drawings of the Sun relative to its true angle the calculation of the latitude distribution must lead to overestimation of . At the same time, it will not cause a systematic shift of the mean latitudes because of equal probabilities of positive and negative errors in the inclination. Just such a picture one can see in the data of SC.
It is interesting that a similar anomalous number of sunspots on the equator were found in the observations of Staudacher (see Fig. 2 in the paper [5]). Arlt assumes that such phenomenon can be caused by a quadrupole magnetic field dominating on the Sun in the third quarter of the 18th century. However, the same picture can be a result of errors in determination of the equator position on the drawings of the observer.
5 Conclusions
Therefore, relationships between characteristics of the latitude distribution of sunspots and the level of solar activity allow one to control normalization of activity indices and correct their distortions caused by a loss of a part of data. In this paper we discuss two such relationships. The first one (1) relates the mean latitude of sunspots in the maximum of activity with the amplitude of the 11-year cycle . The second relationship (2) associates the dispersion of the mean latitude and the current level of activity G.
Apparently, evaluation of the mean latitudes requires less precision in determination of sunspot coordinates than calculation of the latitude dispersions. We saw it on the example of SC, the first part of which, probably, contains large errors. On the other hand, using of the relationship (1) requires that a catalog does not contain dramatic changes in data quality and the loss factor does not vary strongly during a 11-year cycle. At the same time, usage of the relationship (2) does not limited by the data quality so strongly, since it operates by yearly indices. In cases when using of both relationships is possible they, as it was shown above by the example of the second part of SC, lead to consistent results.
It is interesting that both relationships hold even in the case of loss of 99% of data (see Fig. 4), i.e. in situations when a direct calculation of amplitude indices (like the Wolf number) becomes very difficult. This fact makes possible using the described latitude-amplitude relations for analysis and correcting of solar activity indices obtained on the base of pre-Greenwich sunspots catalogs.
6 Acknowledgements
The paper was supported by the RFBR grant No. 13-02-00277 and programs of the Presidium of the Russian Academy of Sciences Nos. 21 and 22.
References
- [1] Arlt, R., Leussu, R., Giese, N., Mursula, K., and Usoskin, I.G., Sunspot positions and sizes for 1825–1867 from the observations by Samuel Heinrich Schwabe. Mon. Not. R. Astron. Soc., 2013, vol. 433, iss. 4, pp. 3165–3172.
- [2] Ivanov, V.G., Miletsky, E.V., and Nagovotsyn, Yu A., Form of the Latitude Distribution of Sunspot Activity, Astronomy Reports, 2011, vol. 55, no. 10, pp. 911–917.
- [3] Ivanov, V.G. and Miletsky, E.V., Spörer’s Law and Relationship between the Latitude and Amplitude Parameters of Solar Activity, Geomagn. Aeron. (Engl. Trasnl.), 2014, vol. 54, no. 7, pp. 907–915.
- [4] Vitinskii, Yu.I., Kopetskii, M., and Kuklin, G.V., Statistika pyatnoobrazovatel’noi deyatel’nosti Solntsa (Statistics of Solar Spot Generation Activity), Moscow: Nauka, 1986.
- [5] Arlt, R., The Butterfly Diagram in the Eighteenth Century, Solar Phys., 2009, vol. 255, pp. 143–153.
- [6] Ivanov. V.G. and Miletsky, E.V., Width of Sunspot Generating Zone and Reconstruction of Butterfly Diagram, Solar Phys., 2011, vol. 268, pp. 231–242.
- [7] Hoyt, D.V. and Schatten, K.H., Group Sunspot Numbers: A New Solar Activity Reconstruction, Solar Phys., 1998, vol. 179, pp. 189–219.
- [8] Waldmeier. M., Die Zonenwanderung der Sonnenflecken, Astronomische Mitteilungen der Eidgenössischen Sternwarte Zürich, 1939, vol. 14, pp. 470–481.
- [9] Waldmeier. M., Ergebnisse und Probleme der Sonnenforschung. (Leipzig: Geest and Portig, 1955).
- [10] Waldmeier, M. Neue Eigenschaften der Sonnenflecken kurve, Astronomische Mitteilungen der Eidgenössischen Sternwarte Zürich, 1935, vol. 14., pp. 105–130..
- [11] Miletsky, E.V. and Ivanov, V.G., Latitude Characteristics of the Sunspot Formation Zone and the 11-Year Solar Activity Cycle, Astronomy Reports, 2009, vol. 53, no. 9, pp. 857–862.