J. Phys. B: At. Mol. Opt. Phys.
Theoretical investigation of spectroscopic properties of W26+ in EBIT plasma
Abstract
Energy levels, radiative transition wavelengths and probabilities have been studied for the W26+ ion using multiconfiguration Dirac-Fock and Dirac-Fock-Slater methods. Corona and collisional-radiative models have been applied to determine lines and corresponding configurations in a low-density electron beam ion trap (EBIT) plasma. Correlation effects for the , , (), () configurations have been estimated by presenting configuration interaction strengths. It was determined that correlation effects are important for the transitions corresponding to weak electric octupole transitions in a single-configuration approach. Correlation effects influence the transitions by increasing transition probabilities by an order of magnitude. Identification of some lines observed in fusion plasma has been proposed. Spectra modeling shows strong increase of lines originating from the transitions. Other transitions from the nm region can be of interest for the EBIT plasma.
pacs:
31.10.+Z, 31.15.ag, 32.70.Cs1 Introduction
Tungsten is a primary candidate as a plasma-facing material in fusion devices due to many important properties. Unfortunately, emission of the tungsten ions that penetrate central regions of the fusion plasma leads to undesirable energy losses. The concentration of these ions has to be monitored in order to create and maintain the fusion reaction. Thus, reliable atomic data for various tungsten ions are needed for successful control of processes in the fusion plasma.
The most intense tungsten emission in the fusion plasma occurs at around 5 nm where a quasicontinuum band is formed [1, 2, 3, 4, 5, 6, 7]. Collisional-radiative modeling (CRM) showed large contributions to the spectral region from the W27+ – W37+ ions at about keV electron temperature [6]. It was also predicted that the lower ionization stages down to W21+ strongly contribute to the emission at about keV electron temperature [6]. Additional structure of lines at 6 nm with lower intensity than the main peak at 5 nm is observed in the fusion spectra. A careful examination of these lines predicts that they are formed by ionization stages in the range between W21+ and W35+ [6]. The modeling for tungsten emission between 10 and 30 nm indicated contributions from the lower than W28+ charged states [6]. The region around 20 nm has been studied in a fusion plasma of the Large Helical Device (LHD) [8]. It was also found that the stages lower than W27+ are the main contributors to the emission spectrum. Furthermore, large contributions from the and transitions in the W24+ to W27+ ions have been observed at the nm region using Compact electron Beam Ion Trap (CoBIT) and LHD [9, 10]. Modeled spectra of W23+ have illustrated the importance of ions with open shells in the formation of the fusion spectra [11].
The ground configurations of the W15+ – W27+ ions have open shells. Ions with the open shells have been rarely studied theoretically due to complexity of calculations. Configurations of such ions possess a large number of energy levels. Many energy levels of different configurations overlap, indicating importance of correlation effects. Furthermore, investigations of high- elements require relativistic effects to be considered in the Dirac-Fock approach with quantum electrodynamic (QED) corrections.
Transitions from many ions contribute to the line-of-sight measurements in the fusion plasma. The electron beam ion trap (EBIT) devices provide a unique opportunity to study emission mainly from the desirable ionization stage determined by the energy of the electron beam. Due to this feature, populations of neighboring ionization states are less expressed. Furthermore, such plasma features low density of electrons. That leads to the dominant population of the ground and long-lived levels. The emission around nm has been observed in the EBIT plasma for the W21+ – W46+ ions [12, 13]. High ionization stages of tungsten have been studied using the NIST EBIT device and collisional-radiative modeling [14, 15, 16]. The CoBIT was used to analyze emission spectra from the W23+ to W33+ ions in the nm range [9, 10].
The main aim of the current work is to determine the strongest lines in the spectrum of the W26+ ion by performing the corona and collisional-radiative modeling of spectral lines and to estimate influence of correlation effects for the configurations corresponding to the strongest lines. Previous theoretical investigations of spectra from the W26+ ion have been performed using pseudorelativistic approach [6, 7, 8, 17]. Our work considers modeling for a monoenergetic electron beam that corresponds to the EBIT measurements. HULLAC code [19] has been used previously to model the W26+ ion spectrum in the EBIT plasma by applying a collisional-radiative approach [13]. However, that study included only 461 levels, and only the wavelengths and intensities of the strongest lines were presented in the vicinity of nm. Furthermore, this modeling did not involve the configuration to which strong excitations from the ground configuration occur. Energy levels of the ground configuration and the magnetic dipole and electric quadrupole transitions among these levels have also been studied using the multiconfiguration Dirac-Fock (MCDF) method [18]. Recently, an extended investigation of the energy levels of the ground configuration of the W26+ ion has been presented using MCDF and the multireference relativistic many-body perturbation theory (MR-RMBPT) calculations [20]. Studies of CoBIT and LHD spectra predicted contributions from the and transitions [9, 10].
Investigations of the W29+ – W37+ ions in the EBIT plasma demonstrated that relative line intensities calculated by studying excitations from the corresponding ground levels are in quite good agreement with the data from the collisional-radiative modeling [21]. There the electron-impact excitation rates were considered as being proportional to the electric dipole transition probabilities because the plane-wave Born matrix element transforms to the matrix elements of the electric multipole transition operators with additional factors. Therefore, the corresponding selection rules of the electric multipole transitions are applicable to the plane-wave Born transitions. The use of the plane-wave Born approximation is justified when the incident electron energies are much greater than the excitation ones.
Therefore, two approaches are used for corona modeling spectral lines of the W26+ ion in this work. In the first one, electron-impact excitation rates are determined in the distorted wave (DW) approximation. In the second approach, the electric dipole line strengths are used instead of the electron-impact excitation rates because the leading term of the first order is proportional to the electric dipole (spin-allowed) transition probability divided by the third power of transition energy for the collision cross sections within the plane-wave Born approximation, i.e., is proportional to the transition line strength. On one hand, in the pure coupling, this approach applies to the spin-allowed transitions. On other hand, since we use intermediate coupling CI wavefunctions, selection rules for the total-spin quantum number do not apply, and only the total angular momentum remains a valid description of the fine-structure level. The plane-wave Born approximation neglects the excitations, which correspond to other than E1 radiative transition types, such as the magnetic dipole or electric quadrupole transitions. But in this case we must point out that the excitations corresponding to the M1 and E2 radiative transitions go to the configurations of the same as the ground configuration parity. When the ground configuration fine-structure levels are excited, resulting radiative decay transitions form the lines that have wavelengths beyond the scope of this work. These lines have already been studied theoretically and experimentally [18, 20]. Furthermore, the levels populated by the neglected excitations to the higher even-parity configurations decay by the radiative E1 cascades down to the intermediate states of the odd-parity configurations that have strong decay channels to the ground configuration. These cascades are included in our calculations and have a large impact on the populations of levels. In the current work, we investigate the excitations from all ground configuration levels (rather that the lowest one) with subsequent radiative cascades.
In addition, a comparison with the CRM is used to demonstrate that simplified approaches are applicable even for such complex systems when the EBIT spectra are analyzed.
In the next section we present the corona and collisional-radiative models and the MCDF method used to calculate the energy levels and radiative transition probabilities. In Sec. 3, the obtained results for the energy levels and emission spectra are discussed, and, in Sec. 4, spectra from the corona model are presented and discussed.
2 Method of calculation
The corona modeling of spectral lines has been performed for excitations from the levels of the ground configuration of the W26+ ion. Population of the excited levels for the excitation from the level is expressed as
| (1) |
where is the index of the level from which the excitations are studied; - the electron impact excitation/deexcitation rate from the level to the level , - a radiative transition probability.
Population of levels by radiative cascades from the higher-lying levels is taken into account by the following expression:
| (2) |
Initial populations of the levels of the ground configuration are assumed to be equal to their statistical weights. The spectra, originating following excitations from these levels, are summed resulting in the total emission spectrum. In addition, the CRM is used to check the accuracy of the applied corona models. Populations of levels in the CRM have been determined by solving the system of coupled rate equations:
| (3) |
in the steady-state equilibrium approximation (). Here is the population of the level , is the electron density ( cm-3, which was the approximate electron density in the EBIT measurements [12].).
The GRASP2K code [22] is used to calculate the wavefunctions as well as the matrix elements of the Dirac-Coulomb-Breit Hamiltonian and the radiative transition operators (electric dipole, quadrupole, octupole as well as magnetic dipole and quadrupole). The Dirac-Coulomb-Breit Hamiltonian consists of the one-electron Dirac Hamiltonian, the Coulomb repulsion operator, and the transverse interaction operator (which corresponds to the Breit interaction in the low-frequency limit).
The QED corrections are considered in the first-order perturbation theory. They include the vacuum polarization and the self-energy (known as the Lamb shift). The correlation corrections are taken into account by the relativistic configuration interaction (RCI) method. Finally, the effects of the finite nuclear size are modeled by using a two-component Fermi statistical distribution function.
In addition to the GRASP2K [22] calculations, the Flexible Atomic Code (FAC) [23], which incorporates the Dirac-Fock-Slater method, is employed to obtain energy levels, radiative transition probabilities, and electron-impact excitation rates in the DW approach. The same basis of configurations is used in both calculations. The electron-impact excitation rates from the levels of the ground configuration are calculated at the electron beam energy of eV and the electron beam density of cm-3. The Gaussian distribution function with a full width at half-maximum of eV is used for the electron energy. Thus, we can estimate accuracy of the corona modeling with the MCDF data when the electric dipole line strengths are used instead of electron-impact excitation rates at various wavelengths. On the other hand, atomic data produced by different codes for the W26+ ion can be compared.
Configuration interaction strength (CIS) is used to estimate the configuration interaction between two configurations and [24, 25]:
| (4) |
where the quantity in the numerator is the interconfiguration matrix element of the Dirac-Coulomb Hamiltonian and is the mean energy distance between the interacting levels of configurations and :
The summation in (4) and (LABEL:ekk) is performed over all states and of the configurations and , respectively.
The value, divided by the statistical weight of the analyzed configuration has the meaning of the average weight of the admixed configuration in the expansion of the wave function for . CIS has been successfully applied for the investigation of energy levels [26], Auger cascades [27, 28, 29], electric dipole [30] and magnetic dipole [31, 32] transitions.
3 Energy levels and radiative transition probabilities
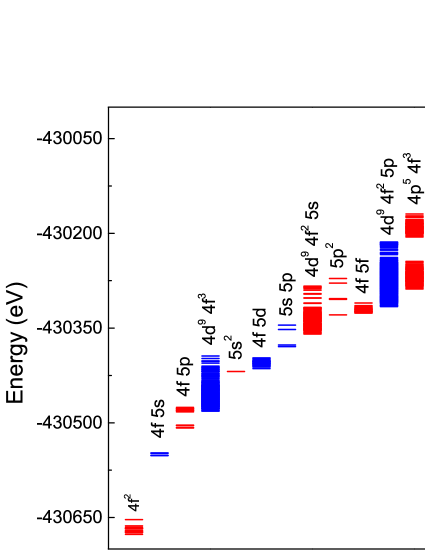
Energy levels of the lowest configurations of W26+ are presented in Fig. 1. The total number of configurations included in the present study amounts to 44, they produce 11594 levels. These configurations correspond to one-electron promotions from the and configurations. In addition, the radiative transition wavelengths and probabilities have been studied for some transitions using a selected basis of configurations in order to investigate the importance of correlation effects.
The ground configuration of the W26+ ion consists of 13 levels. Table LABEL:energy presents levels of the W26+ ion with the total radiative decay rates smaller than the ones of the ground configuration levels. It can be seen that FAC energy levels are slightly higher than GRASP2K energy levels. The largest radiative transition probability of the ground configuration levels corresponds to the level 13 with (see Table LABEL:lft). It is the highest level of the ground configuration. It can be seen from Table LABEL:lft that there are many levels of the configuration with the radiative lifetimes greater than s-1. These levels have extremely large values, and the radiative decay paths from them are limited by selection rules for radiative transitions. Good agreement among GRASP2K and FAC transition probabilities is observed.
| No | P | (a.u.) | (a.u.) | Composition |
|---|---|---|---|---|
| 1 | 4 | 88% 4f2 (H) 3H 11% 4f2 (G) 1G 1% 4f2 (F) 3F | ||
| 2 | 2 | 0.08906 | 0.08917 | 87% 4f2 (F) 3F 12% 4f2 (D) 1D 1% 4f2 (P) 3P |
| 3 | 5 | 0.11418 | 0.11235 | 100% 4f2 (H) 3H |
| 4 | 4 | 0.17475 | 0.17312 | 47% 4f2 (G) 1G 44% 4f2 (F) 3F 9% 4f2 (H) 3H |
| 5 | 3 | 0.17597 | 0.17451 | 99% 4f2 (F) 3F |
| 6 | 6 | 0.21176 | 0.20862 | 94% 4f2 (H) 3H 6% 4f2 (I) 1I |
| 7 | 4 | 0.30939 | 0.30574 | 55% 4f2 (F) 3F 42% 4f2 (G) 1G 2% 4f2 (H) 3H |
| 8 | 2 | 0.33104 | 0.33047 | 57% 4f2 (D) 1D 32% 4f2 (P) 3P 10% 4f2 (F) 3F |
| 9 | 0 | 0.34915 | 0.34979 | 93% 4f2 (P) 3P 7% 4f2 (S) 1S |
| 10 | 1 | 0.40082 | 0.40089 | 99% 4f2 (P) 3P |
| 11 | 6 | 0.40702 | 0.40591 | 94% 4f2 (I) 1I 6% 4f2 (H) 3H |
| 12 | 2 | 0.48727 | 0.48505 | 67% 4f2 (P) 3P 31% 4f2 (D) 1D 2% 4f2 (F) 3F |
| 13 | 0 | 0.84969 | 0.84986 | 93% 4f2 (S) 1S 7% 4f2 (P) 3P |
| 31 | 6 | 7.28864 | 7.32784 | 34% 4d9 4f3 (I) 5H 24% 4d9 4f3 (I) 5I 13% 4d9 4f3 (G) 5H |
| 8% 4d9 4f3 (I) 5K 5% 4d9 4f3 (G) 5I | ||||
| 40 | 7 | 7.33121 | 7.36437 | 36% 4d9 4f3 (I) 5L 23% 4d9 4f3 (I) 3L 19% 4d9 4f3 (I) 5K |
| 6% 4d9 4f3 (H) 3K 5% 4d9 4f3 (I) 5I | ||||
| 44 | 8 | 7.37013 | 7.40683 | 58% 4d9 4f3 (I) 5L 18% 4d9 4f3 (I) 5K 16% 4d9 4f3 (I) 3L |
| 3% 4d9 4f3 (H) 3K 2% 4d9 4f3 (I) 5I | ||||
| 45 | 7 | 7.37264 | 7.41288 | 27% 4d9 4f3 (I) 5H 24% 4d9 4f3 (I) 5I 17% 4d9 4f3 (G) 5H |
| 8% 4d9 4f3 (G) 5I 7% 4d9 4f3 (I) 3L | ||||
| 51 | 9 | 7.40793 | 7.44710 | 73% 4d9 4f3 (I) 5L 11% 4d9 4f3 (I) 5K 7% 4d9 4f3 (I) 3L |
| 4% 4d9 4f3 (K) 3M 2% 4d9 4f3 (K) 1M | ||||
| 54 | 7 | 7.42581 | 7.46300 | 26% 4d9 4f3 (I) 5K 15% 4d9 4f3 (I) 3L 11% 4d9 4f3 (G) 5H |
| 8% 4d9 4f3 (I) 5H 7% 4d9 4f3 (I) 3I | ||||
| 57 | 10 | 7.44170 | 7.48247 | 79% 4d9 4f3 (I) 5L 19% 4d9 4f3 (K) 3M 1% 4d9 4f3 (L) 3N |
| 1% 4d9 4f3 (L) 1N | ||||
| 62 | 8 | 7.47234 | 7.51131 | 33% 4d9 4f3 (I) 5K 27% 4d9 4f3 (I) 5I 14% 4d9 4f3 (I) 3L |
| 13% 4d9 4f3 (G) 5I 4% 4d9 4f3 (H) 3K | ||||
| 68 | 7 | 7.52623 | 7.56236 | 21% 4d9 4f3 (F) 5H 19% 4d9 4f3 (I) 3L 10% 4d9 4f3 (G) 3I |
| 8% 4d9 4f3 (I) 3K 7% 4d9 4f3 (G) 3I | ||||
| 75 | 9 | 7.55210 | 7.59231 | 70% 4d9 4f3 (I) 5K 18% 4d9 4f3 (I) 3L 5% 4d9 4f3 (K) 3L |
| 5% 4d9 4f3 (I) 5L 1% 4d9 4f3 (K) 1M | ||||
| 76 | 8 | 7.55504 | 7.59386 | 22% 4d9 4f3 (I) 5K 19% 4d9 4f3 (G) 5I 15% 4d9 4f3 (I) 3L |
| 13% 4d9 4f3 (I) 3K 11% 4d9 4f3 (I) 5I | ||||
| 82 | 9 | 7.57725 | 7.61564 | 51% 4d9 4f3 (K) 3M 26% 4d9 4f3 (K) 1M 9% 4d9 4f3 (I) 3L |
| 6% 4d9 4f3 (I) 5L 4% 4d9 4f3 (K) 3L | ||||
| 85 | 10 | 7.58743 | 7.62760 | 39% 4d9 4f3 (K) 3M 26% 4d9 4f3 (L) 3N 17% 4d9 4f3 (I) 5L |
| 17% 4d9 4f3 (L) 1N 1% 4d9 4f3 (L) 3M | ||||
| 95 | 8 | 7.63149 | 7.67051 | 30% 4d9 4f3 (H) 3K 16% 4d9 4f3 (I) 3K 16% 4d9 4f3 (I) 3L |
| 12% 4d9 4f3 (K) 3L 5% 4d9 4f3 (K) 3M | ||||
| 112 | 11 | 7.69139 | 7.73386 | 100% 4d9 4f3 (L) 3N |
| 117 | 9 | 7.71709 | 7.75823 | 56% 4d9 4f3 (I) 3L 15% 4d9 4f3 (K) 1M 13% 4d9 4f3 (K) 3L |
| 7% 4d9 4f3 (L) 3L 4% 4d9 4f3 (K) 3M | ||||
| 121 | 10 | 7.72446 | 7.76756 | 42% 4d9 4f3 (K) 3M 30% 4d9 4f3 (L) 3N 24% 4d9 4f3 (L) 1N |
| 4% 4d9 4f3 (I) 5L | ||||
| 127 | 8 | 7.74347 | 7.78090 | 25% 4d9 4f3 (K) 3M 24% 4d9 4f3 (K) 1L 21% 4d9 4f3 (K) 3L |
| 9% 4d9 4f3 (H) 3K 5% 4d9 4f3 (I) 1L | ||||
| 133 | 8 | 7.76413 | 7.80236 | 45% 4d9 4f3 (G) 5I 10% 4d9 4f3 (I) 5I 8% 4d9 4f3 (K) 3K |
| 8% 4d9 4f3 (I) 3K 6% 4d9 4f3 (I) 3K | ||||
| 152 | 9 | 7.82012 | 7.85768 | 31% 4d9 4f3 (K) 3L 24% 4d9 4f3 (I) 3L 14% 4d9 4f3 (L) 3N |
| 11% 4d9 4f3 (K) 1M 9% 4d9 4f3 (L) 3M | ||||
| 177 | 9 | 7.92312 | 7.96374 | 34% 4d9 4f3 (L) 3N 25% 4d9 4f3 (L) 3M 22% 4d9 4f3 (K) 3L |
| 8% 4d9 4f3 (L) 1M 3% 4d9 4f3 (K) 3M | ||||
| 181 | 10 | 7.93526 | 7.97466 | 64% 4d9 4f3 (L) 3M 23% 4d9 4f3 (L) 1N 12% 4d9 4f3 (L) 3N |
| 1% 4d9 4f3 (K) 3M |
The first excited configuration has 4 levels and arises due to the promotion from the ground configuration. The configuration can decay only through the electric octupole transitions in a single configuration approximation. The mixing of configurations opens additional decay channels for the configuration to the ground configuration levels. The study of expansion coefficients for atomic state functions of the configuration reveals that the mixing mainly with the , , , , and configurations leads to the electric dipole transitions to the ground configuration. The current calculations show that the percentage contribution of these configurations to is less than 0.1%. The largest radiative transition probabilities for the transitions are of the order of s-1, while the electric octupole transitions calculated in the single-configuration approach are of the order of s-1. Thus, a small admixture of few configurations has a large effect on the transition probabilities.
| No | () | final | () | final | () | final | () | final | () | final | () |
|---|---|---|---|---|---|---|---|---|---|---|---|
| level | level | level | level | level | |||||||
| 2 | 2.926E3 | 1 | 2.926E3 | ||||||||
| 2.899E3 | 2.899E3 | ||||||||||
| 3 | 3.675E2 | 1 | 3.675E2 | ||||||||
| 3.504E2 | 3.504E2 | ||||||||||
| 4 | 1.592E2 | 1 | 7.025E0 | 3 | 2.306E5 | 2 | 1.662E2 | ||||
| 1.535E2 | 6.999E0 | 1.978E5 | 1.605E2 | ||||||||
| 5 | 1.560E2 | 2 | 1.284E1 | 1 | 3.921E4 | 3 | 2.186E4 | 4 | 1.688E2 | ||
| 1.477E2 | 1.235E1 | 3.985E4 | 1.601E2 | ||||||||
| 6 | 2.077E2 | 3 | 1.339E3 | 1 | 1.263E5 | 4 | 2.077E2 | ||||
| 2.001E2 | 1.176E3 | 1.006E5 | 2.001E2 | ||||||||
| 7 | 2.799E2 | 5 | 2.433E2 | 4 | 5.945E1 | 3 | 2.227E1 | 1 | 1.496E3 | 6 | 6.049E2 |
| 2.663E2 | 2.328E2 | 5.729E1 | 2.181E1 | 1.459E3 | 5.782E2 | ||||||
| 8 | 3.655E2 | 2 | 1.495E2 | 5 | 8.129E2 | 4 | 1.973E2 | 1 | 2.524E8 | 7 | 5.152E2 |
| 3.543E2 | 1.491E2 | 8.269E2 | 2.038E2 | 5.035E2 | |||||||
| 10 | 4.315E1 | 2 | 2.612E1 | 8 | 2.435E1 | 9 | 5.204E1 | 5 | 9.414E1 | ||
| 4.163E1 | 2.653E1 | 2.358E1 | 5.308E1 | 9.227E1 | |||||||
| 11 | 3.381E2 | 3 | 1.335E2 | 6 | 1.455E1 | 1 | 1.754E2 | 4 | 1.025E3 | 7 | 4.718E2 |
| 3.209E2 | 1.317E2 | 1.412E1 | 1.802E2 | 1.131E3 | 4.528E2 | ||||||
| 12 | 3.990E2 | 8 | 2.145E2 | 5 | 6.166E1 | 10 | 1.365E1 | 2 | 1.748E1 | 7 | 6.891E2 |
| 3.814E2 | 2.056E2 | 5.720E1 | 1.280E1 | 1.793E1 | 6.572E2 | ||||||
| 13 | 3.524E3 | 10 | 3.524E3 | ||||||||
| 3.416E3 | 3.416E3 | ||||||||||
| 44 | 3.957E1 | 6 | 3.200E1 | 40 | 7.251E0 | 3 | 5.193E2 | 11 | 6.109E6 | 31 | 7.887E1 |
| 3.546E1 | 4.129E1 | 7.656E0 | 1.848E2 | 2.819E6 | 8.422E1 | ||||||
| 51 | 2.828E1 | 44 | 5.320E0 | 6 | 1.574E1 | 11 | 7.000E7 | 40 | 5.836E7 | 45 | 3.376E1 |
| 3.389E1 | 5.536E0 | 2.072E1 | 1.378E7 | 4.349E7 | 3.963E1 | ||||||
| 57 | 1.205E1 | 51 | 8.853E8 | 44 | 1.205E1 | ||||||
| 1.366E1 | 2.266E8 | 1.366E1 | |||||||||
| 62 | 2.421E3 | 6 | 1.945E2 | 45 | 4.283E1 | 44 | 1.810E1 | 54 | 1.542E1 | 40 | 2.701E3 |
| 2.353E3 | 2.110E2 | 4.416E1 | 1.768E1 | 9.384E0 | 2.635E3 | ||||||
| 75 | 1.041E2 | 62 | 6.166E1 | 51 | 2.318E1 | 57 | 1.728E0 | 44 | 1.457E0 | 6 | 1.922E2 |
| 1.116E2 | 6.077E1 | 2.130E1 | 9.618E1 | 1.311E0 | 1.959E2 | ||||||
| 82 | 3.122E2 | 44 | 1.291E2 | 51 | 1.761E1 | 11 | 2.473E0 | 62 | 9.293E1 | 6 | 4.629E2 |
| 3.472E2 | 1.378E2 | 1.813E1 | 2.113E0 | 8.283E1 | 5.061E2 | ||||||
| 85 | 2.061E2 | 57 | 1.624E2 | 51 | 2.721E1 | 75 | 1.059E1 | 82 | 3.139E4 | 44 | 3.689E2 |
| 2.171E2 | 1.767E2 | 3.034E1 | 1.680E1 | 3.198E4 | 3.943E2 | ||||||
| 95 | 1.300E3 | 11 | 1.021E2 | 40 | 9.784E1 | 6 | 9.239E1 | 62 | 4.878E1 | 45 | 1.729E3 |
| 1.269E3 | 1.040E2 | 1.499E2 | 1.008E2 | 7.195E1 | 1.696E3 | ||||||
| 112 | 7.582E1 | 85 | 5.346E1 | 57 | 4.544E3 | 51 | 4.717E4 | 82 | 1.028E4 | 75 | 1.293E2 |
| 8.262E1 | 6.198E1 | 5.056E3 | 5.441E4 | 1.203E4 | 1.446E2 | ||||||
| 117 | 9.087E1 | 82 | 7.448E1 | 76 | 4.519E1 | 75 | 4.048E1 | 57 | 2.937E1 | 95 | 3.237E2 |
| 9.642E1 | 8.314E1 | 4.997E1 | 3.868E1 | 3.216E1 | 3.004E2 | ||||||
| 121 | 2.336E2 | 85 | 1.947E2 | 82 | 6.721E1 | 51 | 3.276E1 | 57 | 4.876E0 | 75 | 5.363E2 |
| 2.551E2 | 2.221E2 | 7.342E1 | 3.409E1 | 6.187E0 | 5.909E2 | ||||||
| 127 | 1.377E3 | 6 | 4.473E2 | 11 | 2.281E2 | 82 | 1.129E2 | 68 | 1.104E2 | 54 | 2.727E3 |
| 1.477E3 | 3.980E2 | 2.092E2 | 1.229E2 | 1.323E2 | 2.339E3 | ||||||
| 133 | 2.872E2 | 6 | 2.630E2 | 76 | 6.486E1 | 75 | 5.281E1 | 11 | 4.568E1 | 62 | 8.413E2 |
| 1.936E2 | 2.723E2 | 6.822E1 | 4.897E1 | 5.158E1 | 6.347E2 | ||||||
| 152 | 4.371E2 | 57 | 3.857E2 | 85 | 2.332E2 | 75 | 1.161E2 | 62 | 9.658E1 | 6 | 1.430E3 |
| 4.649E2 | 3.677E2 | 2.449E2 | 1.286E2 | 9.759E1 | 1.304E3 | ||||||
| 177 | 6.584E2 | 85 | 4.430E2 | 121 | 2.340E2 | 127 | 1.917E2 | 82 | 9.807E1 | 152 | 2.045E3 |
| 6.559E2 | 4.038E2 | 2.572E2 | 1.999E2 | 1.069E2 | 1.624E3 | ||||||
| 181 | 5.043E2 | 112 | 7.410E1 | 117 | 5.224E1 | 152 | 2.362E1 | 51 | 2.343E1 | 82 | 7.217E2 |
| 4.797E2 | 8.076E1 | 5.652E1 | 2.538E1 | 2.233E1 | 6.647E2 |

With an aim to estimate the importance of the correlation effects for the configurations forming the strongest lines in the modeled spectra, we have calculated the CIS values. Modeling of spectral lines is investigated in the next section. The CIS values for the important configurations are presented in Table LABEL:cis. The current calculations for the W26+ ion show that the largest CIS value corresponds to the configuration interaction with the configuration. Thus, mixing between these configurations is very important when the correlation effects for the configuration are analyzed. On the other hand, the CIS data show that the configuration has the largest mixing with the () and () configurations. Influence of the configuration is somewhat smaller compared to these two configurations (). Figure 2 demonstrates influence of the correlation effects on the transitions. Extended basis of configurations increases radiative transition probabilities for these transitions by an order of magnitude. This result demonstrates importance of the correlation effects for the spectrum of the W26+ ion. The same effect for the transitions was determined for the W25+ ion [33].
It has to be noted that for all presented configurations, the core correlations corresponding to promotions from the and shells have to be taken into account even for the highly excited configurations. Here we consider as the core shells and , (), , and as the valence shells. However, the values for these correlations are approximately by two orders of magnitude smaller compared with the configurations having the largest impact. In the discussion, we use the terms ’core’, ’core-core’, ’valence’, and ’valence-valence’ correlations, meaning correlations with configurations involving promotion of one or two electrons from the core or valence shells, respectively. For all presented configurations, the correlation is the strongest one except for the case where the correlation dominates. The core and core-core correlations play the major role compared to the valence and valence-valence correlations.
The magnetic dipole and electric quadrupole transitions among the levels of the ground configuration of the W26+ ion have been studied using the MCDF approach [18]. Recently, the investigation has been extended by the MR-RMBT calculations using FAC and by the MCDF calculations using GRASP2K for all levels of the ground configuration [20]. Good agreement with experiment is achieved in both works. On the other hand, these investigations have used the MR-RMBPT [20] and the extended optimal level (EOL) approximation in the MCDF calculations [18, 20], which provide accurate data only for few defined levels. We investigate a much larger group of levels and transitions among them, therefore, the extended average level (EAL) approximation is employed in our MCDF studies. For example, the final wavelength for the transition equals to nm in [18] and nm in [20], while our MCDF calculation gives nm, and our FAC calculation gives nm. Our numbers are significantly larger compared with the experimental value of nm. This suggests that a much larger basis is needed to achieve good agreement with experiment for transitions among the levels of the ground configuration.
4 The modeling of emission spectra
Three regions of wavelengths can be highlighted in the modeled spectra of the W26+ ion. The first region from around 1.5 nm to 4 nm corresponds mainly to the transitions from to the ground configuration. Transitions from the and configurations concentrate in the nm region where the largest peak of emission from various tungsten spectra is located. Lines in the third region ( nm) originate from the ()() and transitions. Our study of spectra for the W26+ ion is presented in these wavelength intervals. Unfortunately, there are no published results of EBIT measurements in the third region.
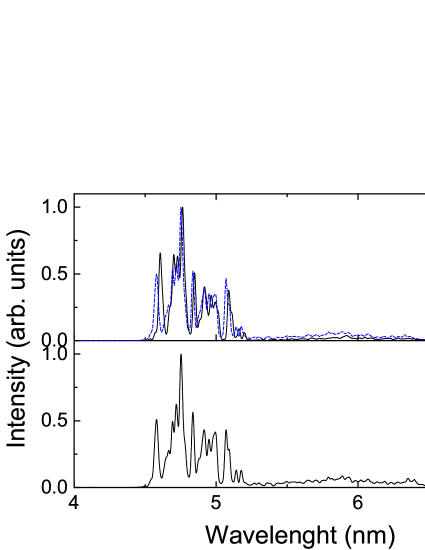
4.1 nm region
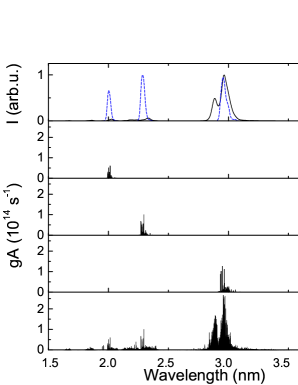
The wavelength region of nm is covered by lines from the , , , , , , and transitions. Transitions from the () configurations are presented in Fig. 3. It was determined for the W25+ ion that the and transitions are the most important in this region [33].
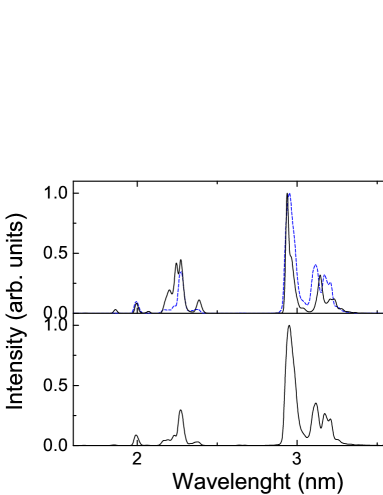
As mentioned above, two approaches for the electron-impact excitation rates are used in the corona modeling. One can see from Fig. 4 that a very similar group of lines appears in both models. Good agreement with the CRM spectrum means that modeling the line intensities only with the electric dipole line strengths instead of the electron-impact excitation rates is justified to determine the strongest lines in a low density plasma of the W26+ ion.
Podpaly et al. [5] and Chowdhuri et al. [4] observed fusion spectra of tungsten in this region. Our data shows that some unidentified lines in their measurements can belong to the W26+ ion. The strongest group of lines in the region originates from the transitions with a peak at nm. Podpaly et al. [5] observed a line with the wavelength of nm in a fusion plasma but the line identification was not proposed. The same line was measured at nm by Chowdhuri et al. [4]. The identification of this line was suggested by Sugar et al. [34] as the transition in W28+. This wavelength was determined from the extrapolation of Pd isoelectronic sequence resonance lines [34]. Lines in the region observed in the CoBIT and LHD spectra were attributed to the transition [9, 10]. It was previously also proposed that this line could belong to the transition in the W26+ ion [7, 17]. A pseudorelativistic approach with scaled integrals [35] has been used in the latter studies. Their intensity-weighted mean wavelength of nm for the (where is statistical weight of the initial level, and is transition probability) spectrum is in good agreement with the experimental value [7]. However, the distribution of the values does not fully determine the spectral shape and dominant transitions since the population mechanisms are not taken into account. In addition, the mean wavelength value is shifted compared to the peak value due to asymmetric distribution of lines. For example, the peak of the transition in the spectrum appears at nm in our calculations while the -weighted mean wavelength corresponds to nm. Unfortunately, the current modeling does not allow us to assess which of the ions are responsible for the emission in this region. On the other hand, the wide peak in the experimental spectrum [5] suggests that the emission from more than one ion is observed.
An additional peak at nm formed by the transitions is seen in the spectrum modeled with the MCDF data. A similar value of nm is obtained from the FAC calculations. The pseudorelativistic approach yielded nm weighted mean wavelength of the spectrum [7]. Podpaly et al. [5] observed lines in the same region with a peak at nm. However, intensities of these lines in our calculations are few times weaker than the intensities of the transitions in the nm region. Therefore, the contribution of the transitions to the line formation should not be very large. We assume that the emission from some other tungsten ions forms lines in the experimental spectrum in this region.
Another strong group of lines is formed by the , , and transitions. An unidentified line with the wavelength of nm was observed in a tokamak spectrum [5]. The line was interpreted as the transitions in the CoBIT and LHD spectra [9, 10]. Our calculations produce two peaks near nm for modeling intensities with the MCDF data and one peak at nm when the DW method is used in FAC to obtain the electron-impact excitation rates (Fig. 4). The strongest lines correspond to the transitions. On the other hand, the values of the MCDF data for the transitions form a peak at nm (Fig. 3a). All these wavelengths agree with the observation.
Modeling predicts a peak at nm in the MCDF calculations corresponding to the transitions and at nm in the FAC calculations (Fig. 4). The total spectrum has a peak at nm (Fig. 3a). These theoretical wavelengths are in close agreement with the unidentified experimental line at nm [5].
The experimental intensities of lines at nm are approximately two times weaker compared with the lines at nm, while our modeling with the DW rates gives a smaller value. It can be explained by the fact that the Maxwellian distribution for the electron velocities occurs in the fusion plasma, and the electron density is by a few orders of magnitude higher than in the EBIT plasma. However, the values for , , and transitions have very similar relative magnitudes (Fig. 3).
4.2 nm region
Region of nm is covered by strong lines originating from the and transitions. The spectra for these transitions are presented in Fig. 5. It can be seen that lines from the transitions are concentrated on the shorter wavelength side while the lines from the transitions are spread more widely. Again, quite a good agreement is obtained among theoretical spectra (Fig. 6). As mentioned above, the configuration mixing increases the radiative transition probabilities for the transitions by an order of magnitude (Fig. 2). However, the number of the transitions is much larger than the number of the transitions, and the former transitions dominate in spectra. Another interesting feature in this region is an additional weaker structure of the lines with wavelengths from to nm. The fusion spectra of tungsten ions contain this group of lines [6, 36]. However, the EBIT plasma does not have these lines [12].
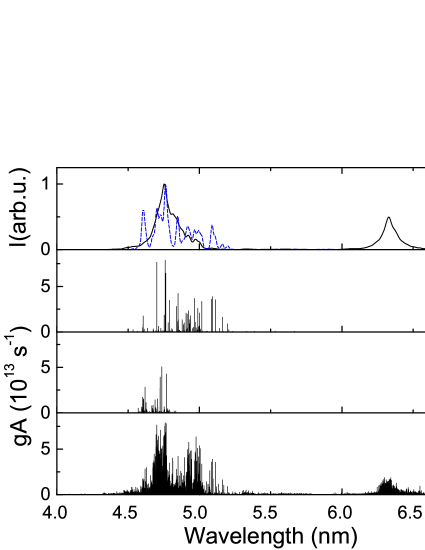
The collisional-radiative modeling using the HULLAC code [19] indicates that the strongest lines in the nm region are formed only by the transitions. Our results demonstrate some contribution from the transitions. Agreement for wavelengths between our and the HULLAC calculations is within nm.
Unfortunately, a strong emission of many ions in this wavelength region makes it impossible to identify lines in the fusion spectra. The previous studies [4, 6, 5] established that some peaks in the emission band can be assigned to the transitions from ions of the higher ionization stages.
4.3 nm region
Lines in the range from 10 to 30 nm correspond mainly to the ()() transitions in the modeled spectra (Fig. 7). However, the strongest lines arise from the transitions, which concentrate in the range nm. As in the W25+ ion case, the modeling predicts very small intensities of these transitions compared with the ()() transitions when the radiative cascade is not taken into account.
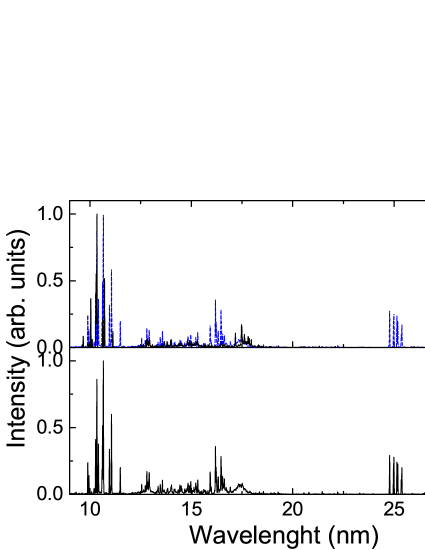
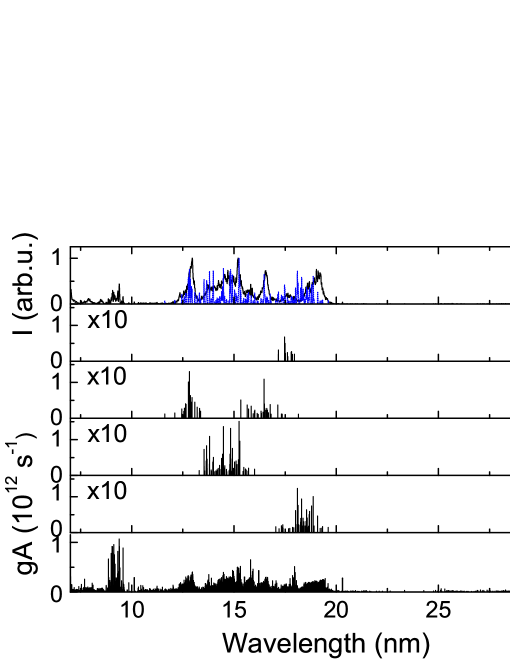
Another prominent group of lines is formed by the transitions at the long-wavelength side. The and configurations are the first two excited ones in the W26+ ion. The radiative decay from these configurations to the ground one occurs through the forbidden transitions in the single-configuration approach. It can be seen from the energy level spectrum that two groups of the energy levels are formed by the configuration (Fig. LABEL:energy). The higher structure corresponds to the states with the subshell, while the lower structure is formed by the subshell. Transitions from the higher-lying levels dominate in the spectrum (Fig. 8). The lines with the shorter wavelengths for the transitions have approximately 10 times larger values compared to the longer wavelengths. However, the situation drastically changes in the corona and CRM spectra. The intensities of longer-wavelength transitions from the lower group of the energy levels strongly increase compared with the ones from the higher group.
It has to be noted that, for the long-wavelength group of the transitions, FAC produces wavelengths approximately nm smaller compared with the MCDF calculations. On the other hand, it has been previously determined that discrepancy between the theoretical wavelengths obtained with FAC and the experimental values can reach up to nm for some transitions in Er-like tungsten. Compared with the transitions in the W25+ ion, the current wavelengths calculated with FAC are shorter by approximately nm. We consider that this difference of the wavelengths for two neighboring ions is too large. In our opinion, MCDF provides more accurate wavelengths.
The other groups of lines between 12 to 18 nm are formed by the ( nm), ( nm), and ( nm) transitions.
The current modeling demonstrates that this region is covered by lines that do not form a band structure and can be of interest for EBIT measurements.
5 Conclusions
Energy levels, radiative transition wavelengths and probabilities have been studied for the W26+ ion. The multiconfiguration Dirac-Fock method and the Dirac-Fock-Slater approach were employed to calculate atomic data using the relativistic configuration interaction method. Our calculations demonstrate that the radiative lifetimes of some levels from the configuration have values exceeding the lifetimes of the levels from the ground configuration.
The configuration interaction strength has been used to determine influence of the correlation effects in the W26+ ion. The mixing of configurations opens decay paths for the configuration to the ground configuration through the electric dipole transitions. This mixing increases the total radiative decay rates from s-1 to s-1. A strong influence of the correlation effects is also determined for the transitions. The transition probabilities for these transitions increase by an order of magnitude when the configuration mixing is taken into account.
The corona and collisional-radiative models are used to determine the influence of various transitions on the formation of lines in a low-density plasma. Two approaches are applied to calculate the line intensities for the corona model. In one of them, the electric dipole line strengths are used instead of the electron-impact excitation rates for the excitations from the levels of the ground configuration. In another approach, the DW method is employed to calculate the collisional excitation rates. The analysis of the strongest DW cross-sections for the excitations from the levels of the ground configuration reveals that the dominant part of the excitations corresponds to the transitions. It is one of the reasons, in addition to the strong mixing of states and the radiative cascades from the excited configurations, why good agreement between both approaches for spectral line intensities occur. Good agreement between the corona and collisional-radiative spectra demonstrates that the simple approach can be successfully applied to predict the strongest lines in the EBIT plasma.
The current results of the spectra modeling show that some unidentified lines in the fusion plasma can belong to the transitions from the , , and configurations to the ground one of the W26+ ion. It was deduced that the strongest group of potentially observable W26+ lines in nm region corresponds to the transitions. The intensities of these lines increase due to the radiative cascades from the higher-lying levels. Modeling demonstrates that this region can be of interest for the EBIT measurements because the structure of lines that do not form emission bands appears in the spectra.
Akcnowledgement
This research was funded by European Social Fund under the Global Grant Measure (No.: VP1-3.1-ŠMM-07-K-02-015).
References
References
- [1] Isler R, Neidigh R and Cowan R 1977 Phys. Lett. A 63 295
- [2] Hinnov E and Mattioli M 1978 Phys. Lett. A 66 109
- [3] Finkenthal M, Huang L K, Lippmann S, Moos H W, Mandelbaum P, Schwob J L and Klapisch M 1988 Phys. Lett. A 127 255
- [4] Chowdhuri M B, Morita S, Goto M, Nishimura H, Nagai K and Fujioka S 2007 Plasma and Fusion Research 2 S1060
- [5] Podpaly Y, Rice J, Beiersdorfer P, Reinke M, Clementson J and Barnard H 2011 Can. J. Phys. 89 591
- [6] Pütterich T, Neu R, Dux R, Whiteford A D and O’Mullane M G. 2008 Plasma Phys. and Controlled Fusion 50 085016
- [7] Harte C S, Suzuki C, Kato T, Sakaue H A, Kato D, Sato K, Tamura N, Sudo S, D’Arcy R, Sokell E, White J and O’Sullivan G 2010 J. Phys. B: At. Mol. and Opt. Phys. 43 205004
- [8] Suzuki C, Harte C S, Kilbane D, Kato T, Sakaue H A, Murakami I, Kato D, Sato K, Tamura N, Sudo S, Goto M, D’Arcy R, Sokell E and O’Sullivan G 2011 J. Phys. B: At. Mol. and Opt. Phys. 44 175004
- [9] Sakaue H A, Kato D, Ding X, Murakami I, Koike F, Nakano T, Yamamoto N, Ohashi H, Yatsurugi J and Nakamura N 2012 AIP Conf. Proc. 1438 91
- [10] Morita S, Dong C F, Goto M, Kato D, Murakami I, Sakaue H A, Hasuo M, Koike F, Nakamura N, Oishi T, Sasaki A and Wang E H 2013 AIP Conf. Proc. 1545 143
- [11] Pütterich T, Jonauskas V, Neu R, Dux R and Team A U 2013 AIP. Conf. Proc. 1545 132
- [12] Radtke R, Biedermann C, Schwob J L, Mandelbaum P and Doron R 2001 Phys. Rev. A 64 012720
- [13] Radtke R, Biedermann C, Fussmann G, Schwob J, Mandelbaum P and Doron R 2007 Atomic and Plasma-Material Interaction Data for Fusion ed R E H Clark, vol 13 (Vienna: International Atomic Energy Agency) p 45
- [14] Ralchenko Y, Tan J N, Gillaspy J D, Pomeroy J M and Silver E 2006 Phys. Rev. A 74 042514
- [15] Ralchenko Y, Reader J, Pomeroy J M, Tan J N and Gillaspy J D. 2007 J. Phys. B: At. Mol. Opt. Phys. 40 3861
- [16] Ralchenko Y, Draganić I N, Osin D, Gillaspy J D and Reader J 2011 Phys. Rev. A 83 032517
- [17] Harte C S, Higashiguchi T, Otsuka T, D’Arcy R, Kilbane D and O’Sullivan G 2012 J. Phys. B: At. Mol. Opt. Phys. 45 205002
- [18] Ding X B, Koike F, Murakami I, Kato D, Sakaue H A, Dong C Z, Nakamura N, Komatsu A and Sakoda J 2011 J. Phys. B: At. Mol. Opt. Phys. 44 145004
- [19] Bar-Shalom A, Klapisch M and Oreg J 2001 J. Quant. Spectrosc. Radiat. Transfer 71 169
- [20] Fei Z, Li W, Grumer J, Shi Z, Zhao R, Brage T, Huldt S, Yao K, Hutton R and Zou Y 2014 Phys. Rev. A 90 052517
- [21] Jonauskas V, Kučas S and Karazija R 2007 J. Phys. B: At. Mol. Opt. Phys. 40 2179
- [22] Jönsson P, Gaigalas G, Bieroń J, Froese Fischer C and Grant I 2013 Comp. Phys. Commun. 184 2197
- [23] Gu M F 2008 Can. J. Phys. 86 675
- [24] Karazija R 1996 Introduction to the Theory of X-Ray and Electronic Spectra of Free Atoms (New York: Plenum Press)
- [25] Kučas S, Jonauskas V and Karazija R 1997 Phys. Scr. 6 667
- [26] Radžiūtė L, Gaigalas G, Kato D, Jönsson P, Rynkun P, Kučas S, Jonauskas V and Matulianec R 2015 J. Quant. Spectrosc. Radiat. Transfer 152 94
- [27] Jonauskas V, Karazija R and Kučas S 2008 J. Phys. B: At. Mol. Opt. Phys. 41 215005
- [28] Palaudoux J, Lablanquie P, Andric L., Ito K, Shigemasa E, Eland J H D, Jonauskas V, Kučas S, Karazija R and Penent F 2010 Phys. Rev. A 82 043419
- [29] Jonauskas V, Kučas S and Karazija R 2011 Phys. Rev. A 84 053415
- [30] Kučas S, Jonauskas V, Karazija R and Momkauskaite A 2007 Lith. J. Phys. 47 249
- [31] Jonauskas V, Kisielius R, Kynienė R, Kučas S and Norrington P H 2010 Phys. Rev. A 81 012506
- [32] Jonauskas V, Gaigalas G and Kučas S 2012 At. Data Nucl. Data Tables 98 19
- [33] Alkauskas A, Rynkun P, Gaigalas G, Kynienė, Kisielius R, Kuc̆as S, Masys Š, Merkelis G and Jonauskas V 2014 J. Quant. Spectrosc. Radiat. Transfer 136 108
- [34] Sugar J and Kaufman V 1980 Phys. Rev. A 21 2096
- [35] Cowan R D. 1981 The Theory of Atomic Structure and Spectra (Berkley, CA: University of California Press)
- [36] Pütterich T, Neu R, Biedermann C, Radtke R and Team A U 2005 J. Phys. B 38 3071