BLUE OUTLIERS AMONG INTERMEDIATE REDSHIFT QUASARS
Abstract
[Oiii]5007 “blue outliers” – that are suggestive of outflows in the narrow line region of quasars – appear to be much more common at intermediate (high luminosity) than at low . About % of quasars in a Hamburg ESO intermediate sample of 52 sources qualify as “blue outliers” (i.e., quasars with [OIII] 4959,5007 lines showing large systematic blueshifts with respect to rest frame). We discuss major findings on what has become an intriguing field in active galactic nuclei research and stress the relevance of “blue outliers” to feedback and host galaxy evolution.
Keywords galaxies: active; quasars: emission lines; quasars: general; techniques: spectroscopic; astronomical databases: surveys
1 Introduction
Low redshift quasars usually show both broad and narrow emission lines in their optical spectra. The type-1/type-2 distinction arose because some quasars showed only narrow emission lines in (unpolarized) light. Studies of type-1 quasars over the last 20-30 years have shown that the most studied [Oiii]5007 narrow line involves: 1) a strong unshifted narrow and 2) a usually weaker blueshifted and slightly broader component. Blue outliers were originally defined as quasars having their [OIII] 4959,5007 emission lines blueshifted by more than 250 km s-1 at peak (Zamanov et al., 2002; Marziani et al., 2003c). They were thought to be rare sources, perhaps too rare to affect the measurement of AGN systematic redshifts: optical narrow lines have been used for decades to estimate rest-frame systemic of quasars with little attention for the ionization stage of the emitting ionic species. However, a systematic radial velocity difference between narrow low-ionization and high ionization lines (like [OIII] 4959,5007) is now established (Zamanov et al., 2002; Eracleous and Halpern, 2004; Hu et al., 2008). The distributions of peak line shifts of Zamanov et al. (2002, hereafter Z02) and Hu et al. (2008) are remarkably similar, with the mode of the Hu et al. (2008) data displaced by –30 km s-1 with respect to [OII]3727. Both distributions also show a skew toward [Oiii]5007 blueshifts. A striking property of the Z02 distribution is the presence of unexpectedly large blueshifts: in the histogram they appear detached from the main distribution. It is not difficult to show that these sources are outliers following standard statistical tests, for example the one based on modified score applied to the peak velocity shift of source (Iglewicz and Hoaglin, 1993):
| (1) |
where the brackets indicate the median operator and the term at the denominator is the median absolute deviation. Blue outliers (BOs) have since been found in several samples (Bian et al., 2005; Aoki et al., 2005; Komossa et al., 2008; Zhang et al., 2011, 2013). However, until 2008 (Komossa et al. 2008 included) only 27 sources qualified as BOs according to the definition of Z02. In the samples of Bian et al. (2005) and of Marziani et al. (2003a) they were 3 % and 5% of all sources, respectively: rare sources, but not extremely rare, with the precise amount of their prevalence being obviously sensitive to sample selection criteria.
The first issue in measurements of the [OIII] 4959,5007 shift is to set a reliable rest frame reference. Ideally, the rest frame should be set by the systemic redshift of the host galaxy, from HI or CO lines, or stellar absorption lines ( Z02, Bae and Woo 2014). More expedient in the analysis of large ensembles of quasar spectra is to estimate the quasar redshift from low-ionization emission lines (typically H or H narrow component, the partially resolved [OII]3727 doublet, or [NII]6548,6583). There are several caveats also with this approach but these lines are customarily sharply peaked and, with good S/N (), make possible the definition of a conventional quasar rest frame with a precision km s-1 (Marziani et al., 2013).
Progressing to high redshift is not easy. The equivalent width of [OIII] 4959,5007 strongly decreases as a function of redshift and/or luminosity (e.g. Brotherton, 1996; Netzer et al., 2004; Baskin and Laor, 2005; Zhang et al., 2013) The [Oiii]5007 line is often of low equivalent width (few Å), and relatively broad ( 1000 km s-1, Netzer et al. 2004). Therefore it does not come as a surprise that little data exists for [OIII] 4959,5007 shifts at : the lines are shifted into the near IR (NIR), and spectroscopic observation in the JHK bands were limited to the brightest quasars until very recent times.
In this paper we report on the observation of the [OIII] 4959,5007 line properties in a sample of 52 intermediate redshift () quasars. The main aim is to operate a comparison between the [OIII] 4959,5007 emission line properties at low- and the luminous quasars at . The intermediate sample involves sources that are among the most luminous quasars, observed at a cosmic epoch () when the quasar population was reaching its maximum “splendour” in terms of space density and luminosity (e.g., Boyle et al., 2000; Richards et al., 2006; Wall et al., 2005). BOs might be associated with nuclear outflows but they are relatively infrequent at low- (§2). Until now, direct evidence of mechanical feedback from the active nuclei on their host galaxies has been rather elusive at low-. However, feedbacks effects are expected to have been operating at higher redshift for massive galaxies, at least in order to account for the – correlation observed among local Universe galaxies (Merritt and Ferrarese, 2001; Gebhardt et al., 2000). It might well be possible that outflows associated with [Oiii]4959,5007 blueshifts were more frequent in the past. Their energetics may provide evidence in favour of feedback effects on the quasars’ host galaxies. In this paper we first summarize the basic aspects that have emerged by the study of [Oiii]4959,5007 and specifically of the BOs in the Eigenvector 1 context at low- (§2). We then summarily describe observations and data analysis of the quasar spectra at intermediate redshift (§3). Main results concerning the [Oiii]4959,5007 line profile are reported in §4 and discussed in §5 where we show that intermediate- BOs are frequent at high luminosity and may be associated with high-kinetic power outflows.
2 Blue outliers in the context of Eigenvector 1 at low-
It is known since the early 1980s that the [OIII]4959,5007 profiles can be strongly asymmetric with a predominance of blue-ward asymmetries (e.g., Whittle, 1985; Vrtilek and Carleton, 1985), but a more focused view emerged with the analysis of [OIII]4959,5007 in the Eigenvector 1 context (Boroson and Green, 1992; Sulentic et al., 2000a; Zamanov et al., 2002; Marziani et al., 2003c). E1 was first defined by Boroson and Green (1992) through a principal component analysis of 87 quasars. The original E1 was dominated by an anti correlation between [Oiii]5007 peak intensity or and FeII prominence, and was later extended into a 4D E1 by Sulentic et al. (2000b) involving parameters associated with broad line and continuum emission, namely FWHM of broad H, Feii prominence parameter, = Feii4570/H; Civ1549 centroid shift at one-half fractional intensity, and soft X-ray photon index. Of special importance is the optical plane of E1 defined by FWHM(H) vs. . In this plane data points from large samples of quasars can be plotted provided that a high S/N spectrum is available for each source in the H spectral range (Sulentic and Marziani, 2015). Sulentic et al. (2000a) identified two populations, A (FWHM km s-1) and B (FWHM km s-1). Composite spectra can be build for spectral bins from A1 to A4, in order of increasing , from 0 in steps of =0.5 (for example A2 has ); A1 to B1 to B1++ in order of increasing H FWHM, with FWHM = 4000 km s-1 (Sulentic et al., 2002). In the optical plane of E1, large equivalent width W([OIII]4959,5007) sources can have a blue-ward asymmetric wing; low W([OIII]4959,5007) sources (located in the lower left part of the optical E1 diagram) tend to have emission dominated by a semi-broad (1000 – 2000 km s-1), most-often blueshifted feature that may resemble the blueward wing observed in stronger [OIII]4959,5007 emitters (e.g., Marziani et al., 2003c, 2006; Zhang et al., 2013).
The BOs occupy the lower right part of the diagram and are therefore exclusively Pop. A/narrow line Seyfert 1 (NLSy1) nuclei (Z02). Use of the [Oiii]4959,5007 line width as a proxy of the bulge stellar component velocity dispersion should be avoided for population A sources in the spectral types A2, A3, A4 (e.g., Marziani and Sulentic, 2012, and references therein). The narrow line region (NLR) in sources whose [Oiii]4959,5007 profile is blueshifted and semi-broad is unlikely to be dynamically related to the host-galaxy stellar bulge. Marziani and Sulentic (2012) suggest a minimum equivalent width 20 Å to ensure dominance by the narrower, unshifted (or less shifted) core component; otherwise, the [Oiii]4959,5007 FWHM may lead to a significant overestimation of black hole masses (Botte et al., 2005). Large blueshift and the profile of the [OIII]4959,5007 lines are explained as due to a radial outflow (Z02, Komossa et al., 2008). Z02 were able to account for the [Oiii]5007 line profile assuming a wide angle radial outflow with a velocity field , i.e., with gas moving radially at a fixed fraction of the local escape velocity at , . The low W([Oiii]4959,5007) is also consistent with (but not a proof of) a compact NLR. Evidence exists that low- BOs involve a nuclear outflow. We will show that this is likely the case also at intermediate (§4 and 5).
| Sample | Shift | FWHM | |||||||
|---|---|---|---|---|---|---|---|---|---|
| [km s-1] | [km s-1] | ||||||||
| Marziani et al. (2003a) | 215 | 95 | 0.0 – 0.7 | –27 /– 21 | 7 | –2500 / –250 | 500 – 2000 | 18 % | 7% |
| Bian et al. (2005) | 150 | 150 | 0.1 – 0.6 | –25 / –21 | 7 | –1000 / –250 | 400 – 1300 | 5% | 5% |
| HE (present work) | 52 | 27 | 1.0 – 2.2 | –30 / –26.5 | 21 | –2500 / –250 | 500 – 3000 | 0% | 48% |
| Netzer et al. (2004) | 29 | 16c | 2.0 – 2.5c | –28.5 / –27c | … | … | 600 – 1800 | … | … |
3 Observations and data analysis
ISAAC observations for 52 quasars from the Hamburg-ESO survey (Wisotzki et al., 2000, hereafter HE sample) have been presented and discussed in Sulentic et al. (2004), Sulentic et al. (2006), and Marziani et al. (2009). The data were obtained with low dispersion grisms and a narrow slit (0.6 arcsec) that ensured a spectroscopic resolution 1000. Sources are in the redshift range , with one source at (HE 0940–1050). The bolometric luminosity is in the range [ergs s-1]: the quasars in the HE sample are among the most luminous quasars known.
A suitable low-, low- control sample is offered by the 215 sources of Marziani et al. (2003a) since spectra were collected with a comparable resolution and S/N distribution, and were analyzed following a similar technique. The Marziani et al. (2003a) dataset is a rather heterogeneous collection of high S/N spectra that is loosely representative of the low- type-1 sources and includes luminous Seyfert-1 in addition to quasars. A larger sample, selected more rigorously from a well-defined flux limit (Zamfir et al., 2010) shows an occupation in the optical plane of 4DE1 similar to Marziani et al. (2003a) but unfortunately has no [Oiii]4959,5007 measures available. Reliable [Oiii]4959,5007 measurements are also available for the sample of Bian et al. (2005) that includes 150 NLSy1s selected from the DR3 of the SDSS where BOs should be more frequently found (§4.2). Table 1 summarizes the basic properties of the two low- and of the HE samples. Columns list, in this order, sample identification, total number of objects in sample, number of Pop. A objects, the sample redshift and absolute magnitude range, the number of BOs, an indicative shift and FWHM range, and the fractions of BOs that are NLSy1s and that belong to Pop. A. Range values are indicative of the bulk of redshift, magnitude and shift distributions in the various samples. A helpful, high luminosity comparison sample is also provided by Netzer et al. (2004) who however yielded [Oiii]4959,5007 equivalent width and FWHM measures but no shifts. The Netzer et al. (2004) is the only reasonably-sized sample with an uniform data-set in the same range that can be used for a comparison with the HE measures. The HE and Netzer et al. (2004) samples are representative of high luminosity end of the quasar luminosity function at 2. They were rare then, and completely absent at low (, Boyle et al. 2000; Richards et al. 2006).
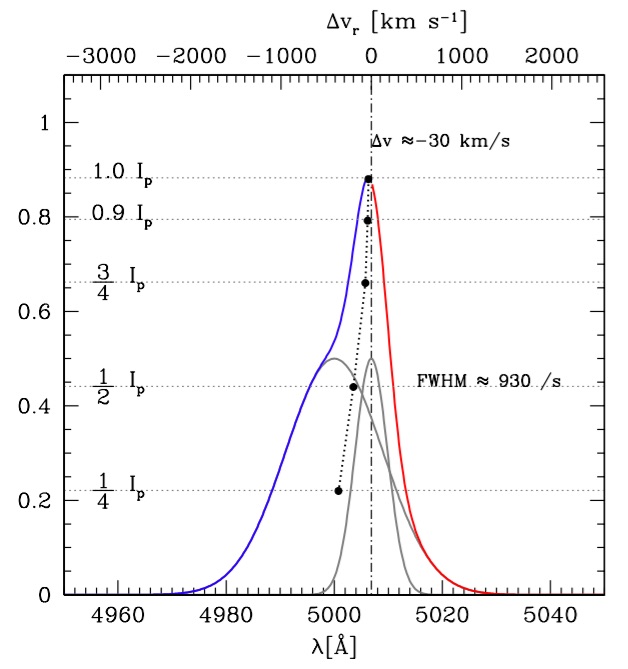
The HE spectra were modeled with a minimization procedure using the routine specfit implemented in the IRAF package (Kriss, 1994). The details of the analysis techniques have been described elsewhere (Marziani et al., 2009, 2013; Negrete et al., 2014). Here we recall that the main elements of the multi-component fits are continuum shape (a power-law), Feii emission template, a Lorentzian function to represent Pop. A H profiles, two Gaussians (one broad and redshifted) for Pop. B H. The [Oiii]4959,5007 lines were modeled assuming that each line is the sum of two Gaussians, one narrower and one broader, with the following constraints: same shifts, same FWHM, and intensity ratio fixed by atomic physics for [Oiii]5007 and [Oiii]4959 (Dimitrijević et al., 2007). This approach is meant to reproduce a component presumably associated with the outer NLR (whose broadening is set by the bulge potential) and one component whose broadening is associated with non-virial motions. Minimum values are usually consistent with a satisfactory model of the [Oiii]5007 profile, although the relative intensity of the two Gaussians (narrow and semi-broad) may not be well constrained. Also, in several cases, it was found that a single, shifted semibroad component accounted for the full profile. Line shifts and width at fractional peak intensity of , , and 0.9 were also computed on the full profile to bypass the model dependent profile decomposition into two Gaussians. Fig. 1 shows the decomposition for one typical case with a modest net blueshift at peak. Low W([OIII]4959,5007) and highly blueshifted profiles may show a much weaker core component or even only the single blue-shifted component.
Line shifts were computed with respect to the H narrow component, or with respect to the peak of H is no narrow component was clearly identifiable. This procedure is safe for the detection of large shifts since: 1) for Pop. A sources, the H broad profile is most often Lorentzian-like, and spiky. Shifts between narrow and broad component have been found to be less than 200 km s-1 (Sulentic et al., 2012); 2) broader Pop. B H profiles show stronger H NC, and in general, stronger emission lines. Wavelength calibration residuals are not relevant, since they were always .
4 Results
4.1 The case of an intermediate- blue outlier
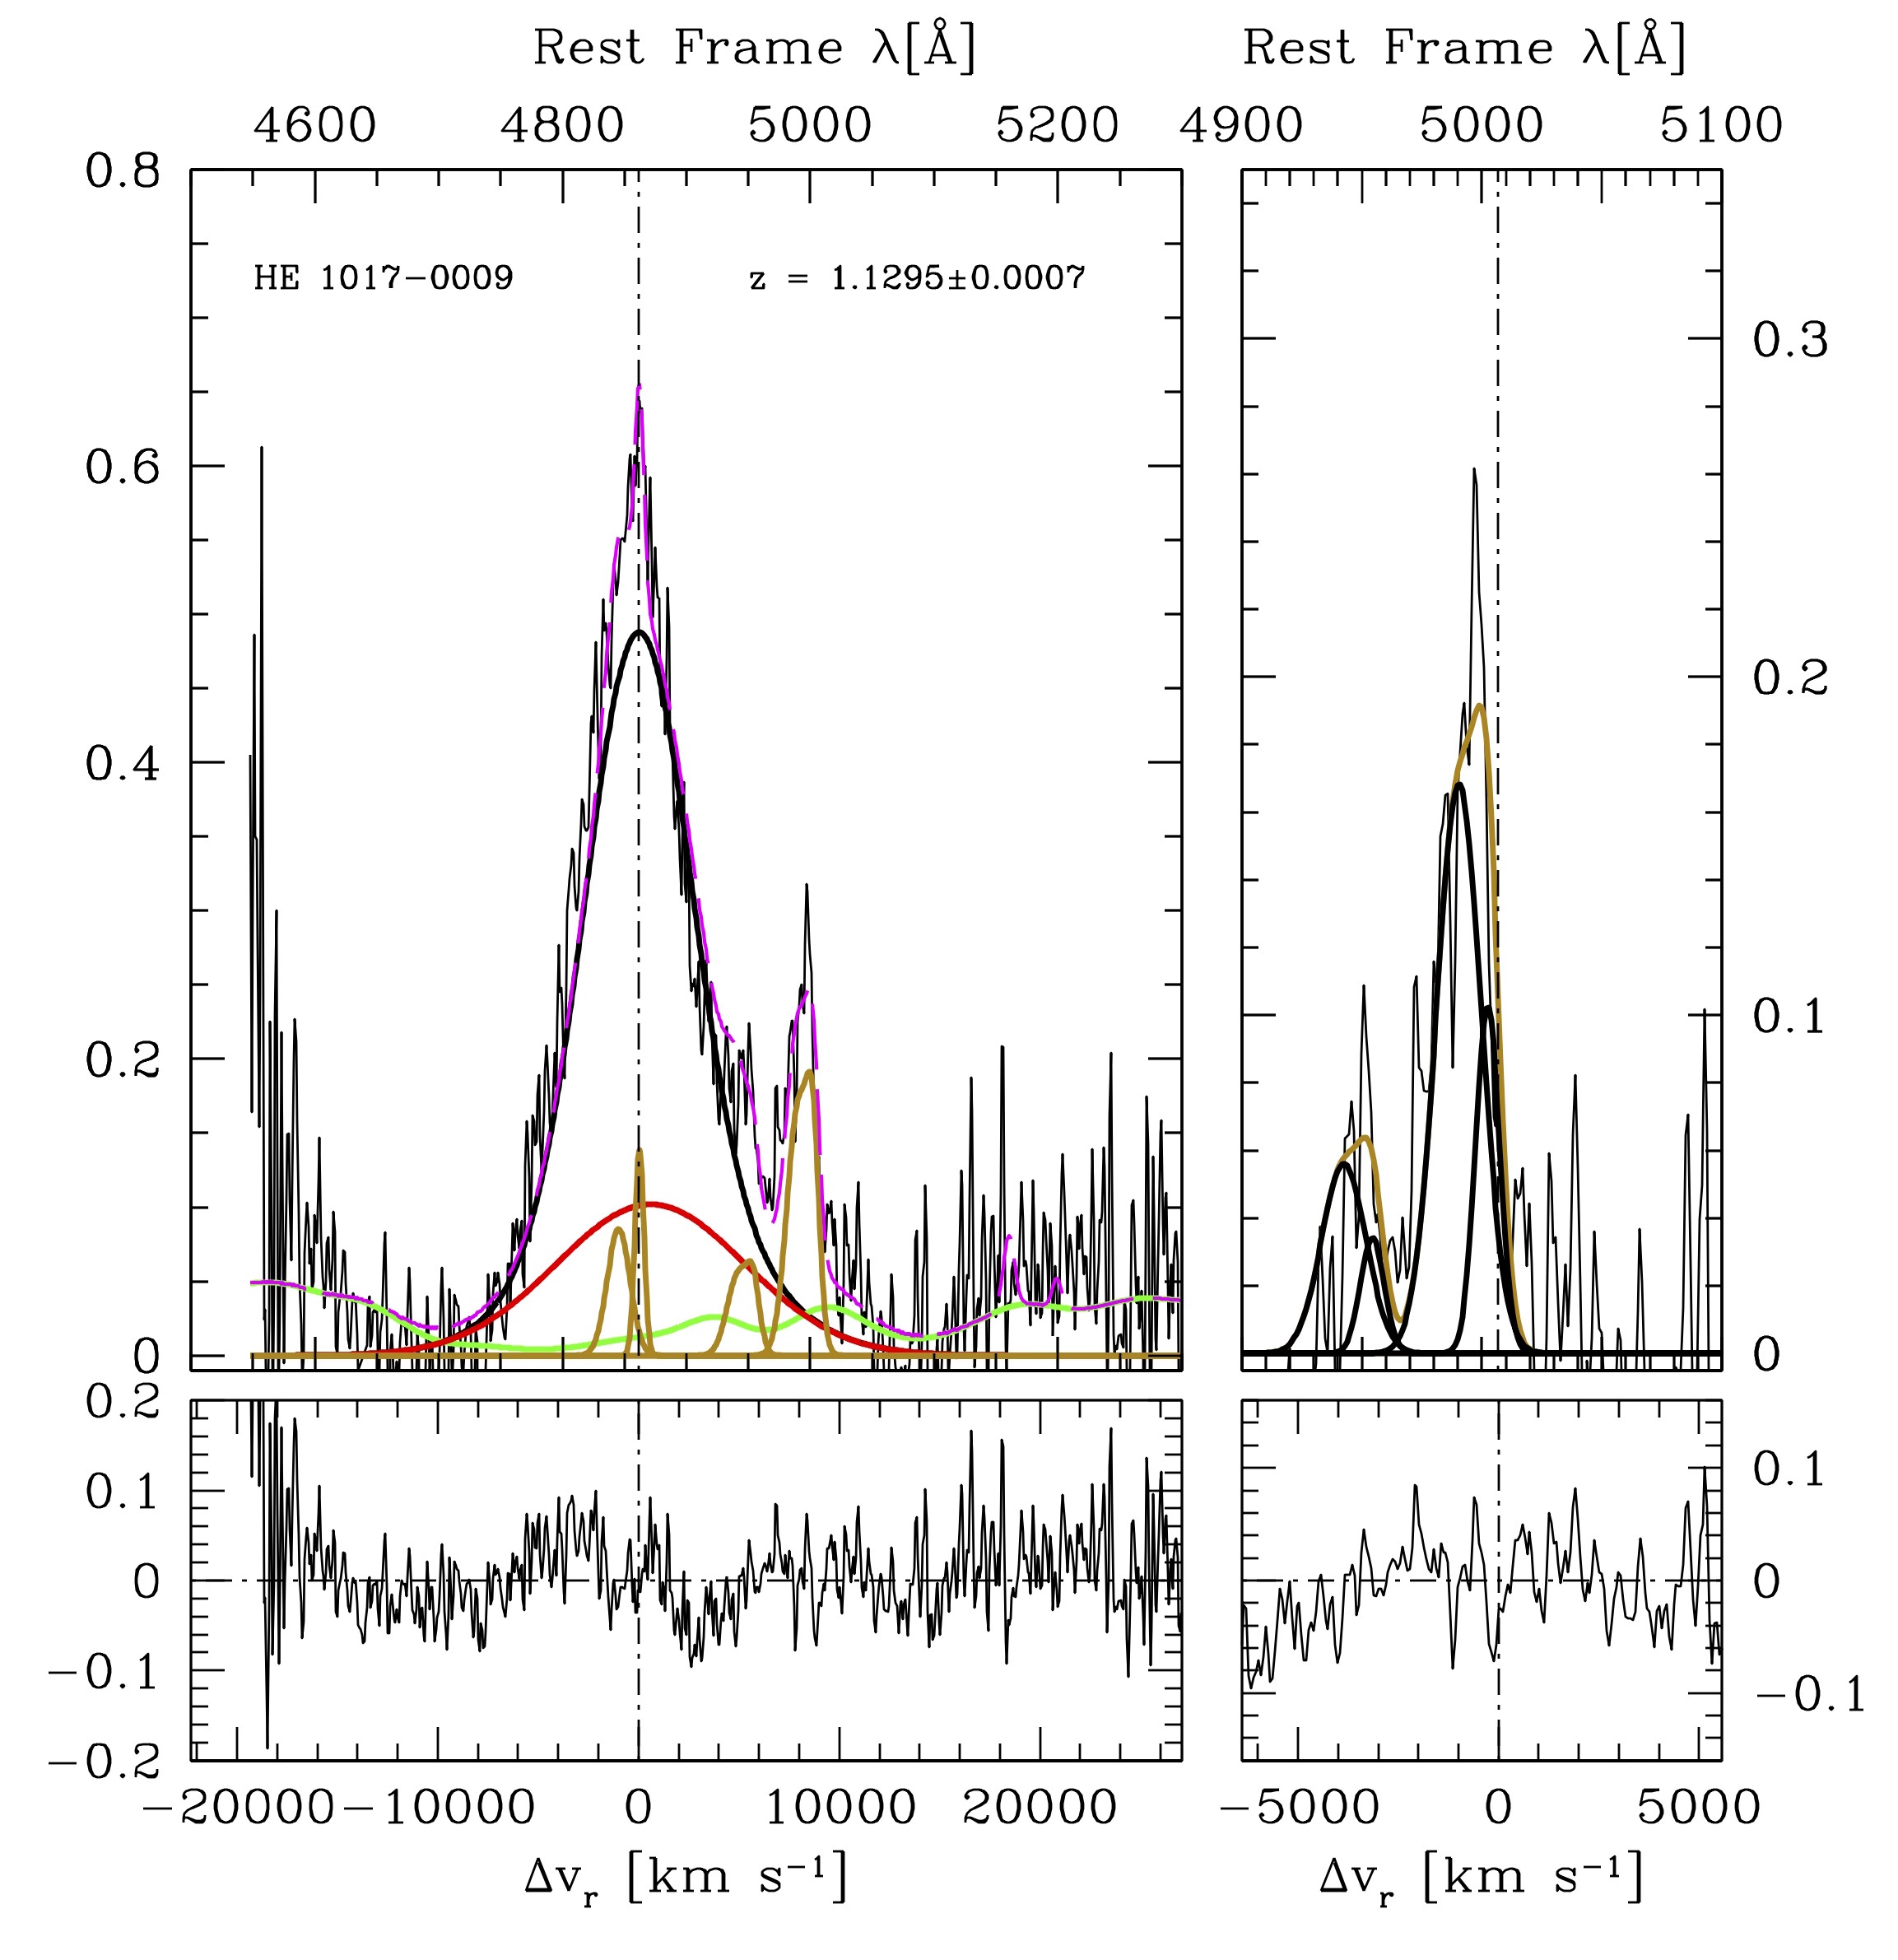
Fig. 2 provides an example of BO in the HE sample, Pop. B source HE 1017-0009. This source is interesting because and FWHM( H) indicate that it is definitely Pop. B, and BOs are not observed among Pop. B sources at low and low , while we found several cases in the HE sample. The left panel shows the continuum subtracted H spectral region, and the right one provides an expansion around the [OIII]4959,5007 lines. In this case, the intensity of Feii emission is low, allowing for a reliable decomposition between the red wing of H and [OIII]4959,5007. The FWHM of the whole [Oiii]5007 profile is 1350 km s-1, with a shift at peak intensity of –700 km s-1. Monte Carlo simulations of the HE10017–0009 spectrum with S/N20 indicate a 1 error of 70 km s-1 on line peak and % on FWHM due to noise. The dynamical relevance of the shift i.e., the shift amplitude normalized by the line half-width half maximum (Marziani et al., 2013), is /HWHM 1. As it is possible to appreciate from Fig. 2, the [Oiii]4959,5007 lines are fully blueshifted with respect to the rest frame of the quasar.
4.2 Distribution of [Oiii]4959,5007 line width and shifts

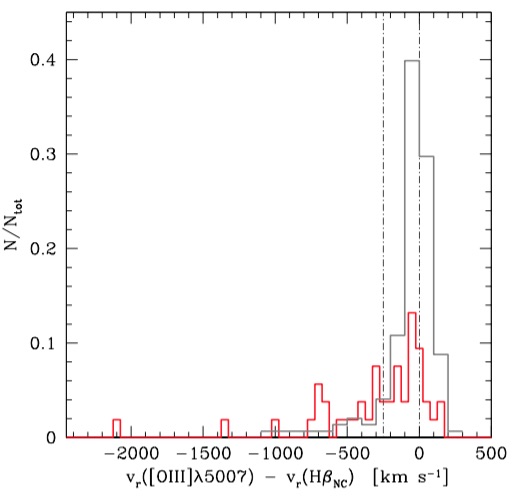
At low , BOs appear peculiar because of their large shifts and because of their large FWHM. Fig. 3 shows a comparison between low samples and the HE sample. The top panel of Fig. 3 shows the shift distribution for the HE sample and the one of Marziani et al. (2003a) identifying Pop. A sources (blue shaded histogram). The histogram is not normalised in order to show the numbers involved in the samples. The lower panel shows the normalised distribution of [Oiii]4959,5007 shifts for the Bian et al. (2005) and HE samples. BOs are a small fraction of the total sample at the extreme end of the shift distribution in both low- samples. The prevalence of BOs is about 5% in Bian et al. (2005), where they might not be considered anymore statistical outliers, and somewhat lower in Marziani et al. (2003a), 3%. This might not be surprising considering that Bian et al. (2005) considered exclusively NLSy1s that, as a class, include nuclei accreting at a high rate and radiating close to the Eddington limit (Sulentic et al., 2000a; Mathur, 2000; Grupe, 2004; Marziani and Sulentic, 2014). If we restrict the attention to NLSy1s the fraction of BOs in the Marziani et al. (2003a) sample increases and becomes even larger than the one of Bian et al. (2005, Table 1).
It is not surprising that there are no NLSy1s BO in the HE sample: NLSy1s, as stressed since Boroson and Green (1992) by several authors, are not peculiar sources, but rather low-luminosity, low Pop. A sources, and therefore no NLSy1 is even expected in the high-luminosity HE sample. Under the assumption that all sources radiate at or below the Eddington limit, that the virial relation holds for black hole mass estimates, and that the distance of the line emitting region can be expressed as , then there is a minimum for FWHM as a function of that satisfies the condition = 1 and that can be written as FWHM (Marziani et al., 2009). As a consequence, the Pop. A / B limit also becomes dependent on , and at very high luminosity FWHM 2000 km s-1. The dependence can be neglected for i.e., the condition of luminosity-independence is roughly satisfied in low- samples (Fig. 11 of Marziani et al. 2009) .
Even in the sample of Bian et al. (2005), or restricting to Pop. A and NLSy1s, the fraction of blue outliers remains much smaller than the one of the HE sample, %. At low- BOs are almost exclusively Pop. A. At high luminosity, BOs are predominantly of Pop. A but there are also several Pop. B sources (8 out of 25).
4.3 No “Baldwin effect” for the blue outliers
The analysis of the HE objects indicates that [Oiii]4959,5007 profiles like the ones shown in Fig. 2 with km s-1 are now present in 40% of the sample. Their equivalent width is low, typically below 20 Å in the rest frame. A fraction of sources show no detectable [Oiii]4959,5007, and these sources are typically of extreme Pop. A i.e., spectral types A3 and A4 (xA for brevity, Marziani and Sulentic 2014). Indicatively, they are about 10 % in the HE sample vs 1% in Marziani et al. (2003a).
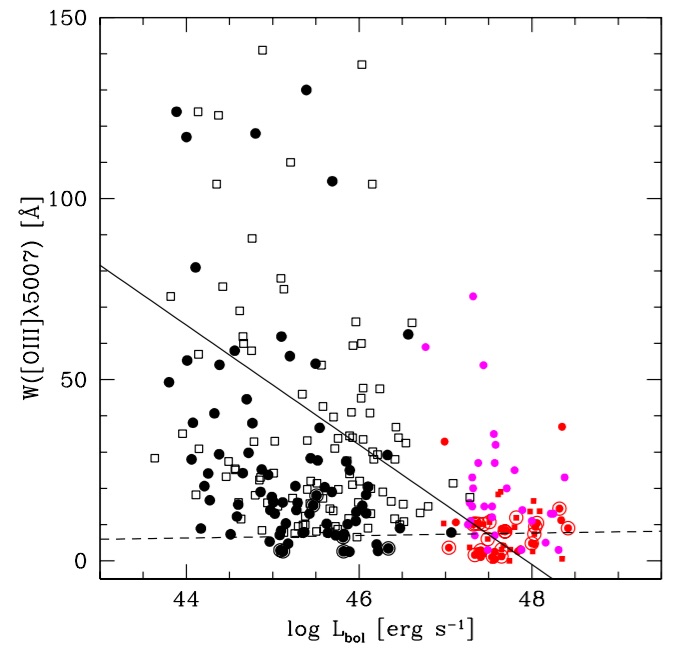
If the 7 blue outliers in the sample of Marziani et al. (2003a) are used as a comparison, there is no significant decrease in equivalent width with luminosity: the slope of the best fitting line is consistent with 0 within, however, a large uncertainty (: the positive slope may even indicate an anti-Baldwin effect as found by Zhang et al. 2013). Considering instead the full HE and the Netzer et al. (2004) sample at high , and Marziani et al. (2003a) sample at low , we see a rather strong anti correlation between [Oiii]5007 luminosity and equivalent width (Fig. 4), with correlation coefficient 0.45, significant at a confidence level of 5.5 : it is the so-called [Oiii] Baldwin effect (Brotherton, 1996; Baskin and Laor, 2005), also found in recent studies (Stern and Laor, 2013; Zhang et al., 2013). This [Oiii] Baldwin effect even shows a steeper anti-correlation than the one of the Civ1549 Baldwin effect. We suggested, in several of our past works, that the Civ1549 Baldwin effect, as observed in large quasar samples, could be explained as due mainly to selection effects (Marziani et al., 2008) following the discovery of a strong anti correlation between W(Civ1549) and the Eddington ratio, stronger than the one between W(Civ1549) and luminosity (Bachev et al., 2004; Baskin and Laor, 2004). The effect could be enhanced if the discovery of quasars is biased toward high-Eddington ratio sources at high , as expected from flux-limited surveys. It is impossible to define a complete sample (in terms of quasar and ) at intermediate and high from the presently-available flux-limited samples (as shown by Fig. 2 of Sulentic et al. 2014). Surveys significantly deeper than the SDSS may affect the appearance of Fig. 4, populating the large W([Oiii]5007) area with sources radiating predominantly at low that are lost in present-day surveys. The the Hamburg-ESO survey can be considered flux limited, but due to the high limits in flux, it includes only part of the quasar populations. Most Pop. B sources are expected to be preferentially lost (if Pop. B sources satisfy the condition ), and this can create a spurious L effect since Pop. B sources are the ones with the larger W([Oiii]4959,5007).
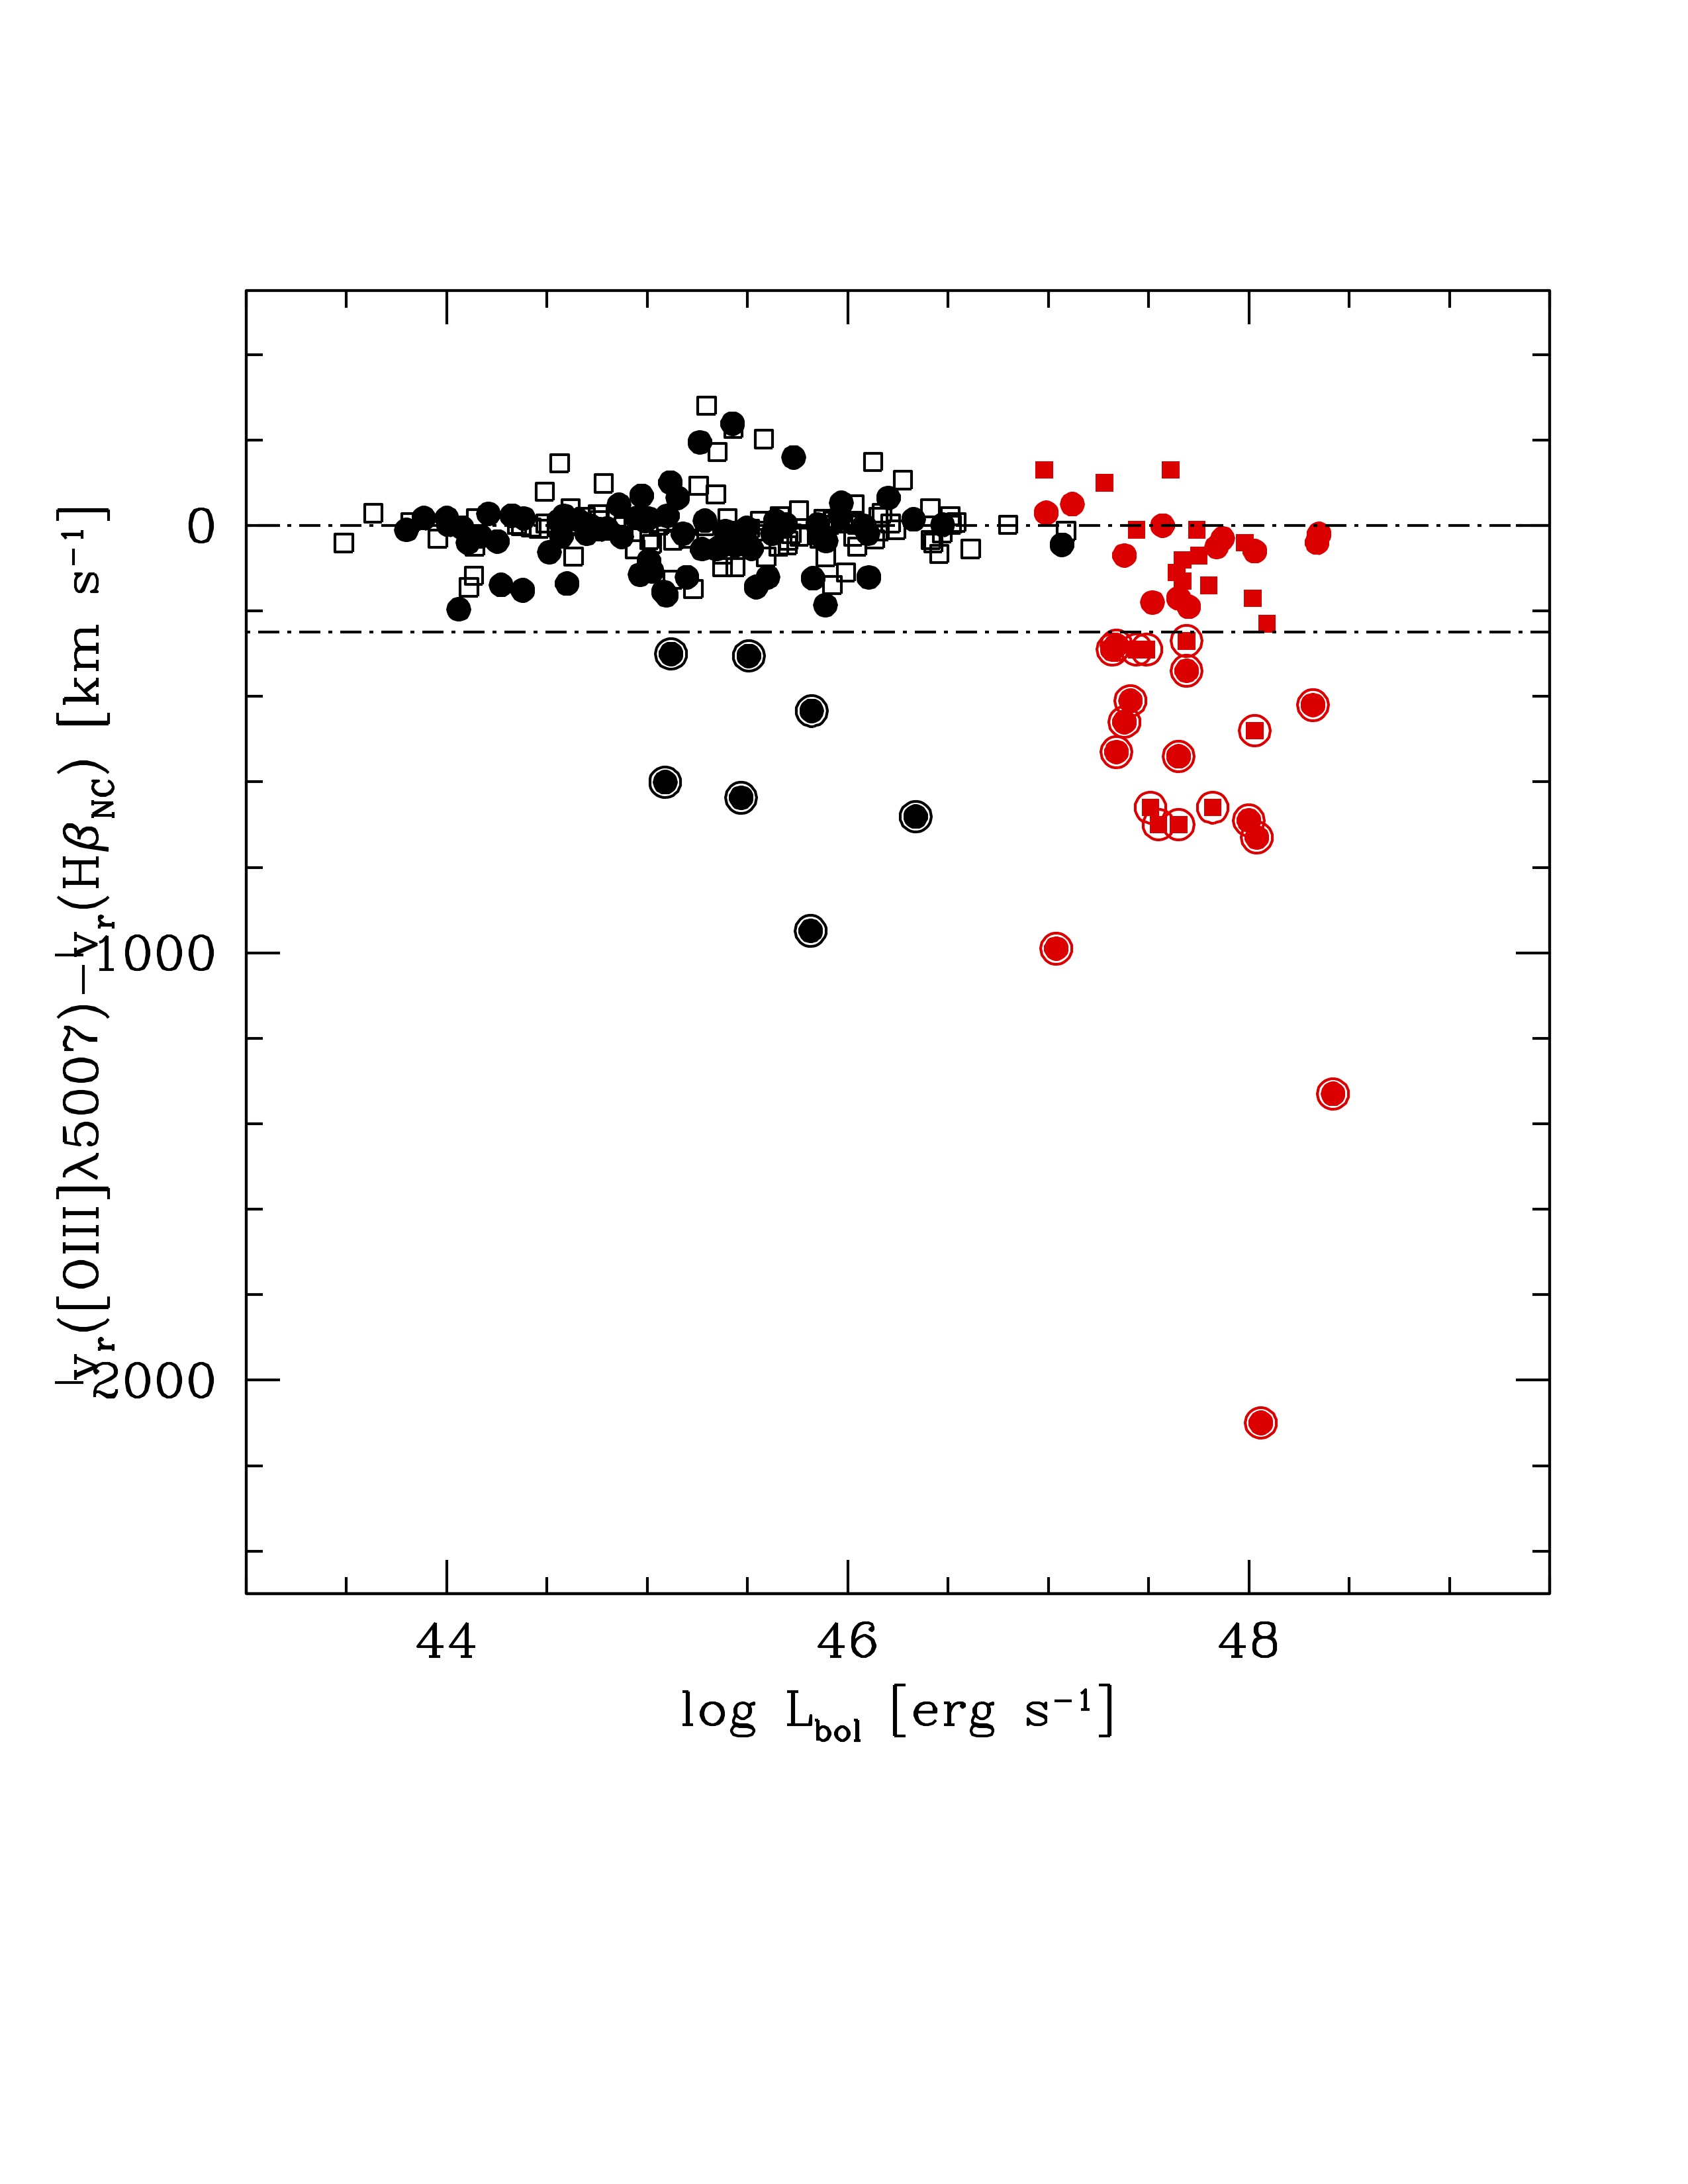
The BOs shift amplitudes are not strongly dependent on luminosity. If we consider the [Oiii]5007 shifts in the samples of Marziani et al. (2003a) and HE as a function of luminosity, we see that BOs become more frequent at high , but that the data point distribution can be hardly described in terms of a correlation (Fig. 5). The absence of a BO Baldwin effect is also indicating that these sources maintain similar properties at both low- and high-, and that the physical mechanism behind these properties is dependent neither on redshift nor on luminosity. We will discuss further implications in §5.1.

5 Discussion
5.1 Quasar evolution or luminosity effect?
At low- the shape of the [Oiii]4959,5007 line profile can be well described by the relative prominence of two components:
- •
-
•
a broader ( 1000 km s-1 FWHM) blueshifted component customarily referred to as the semibroad [Oiii]4959,5007 component, and that may appear as a blueward asymmetry at low resolution, if the core component is strong.
Fig. 6 sketches three cases with changing relative intensity of semibroad and core [Oiii]5007 component. The top configuration is found mainly in Pop. B sources, especially if radio loud. The total W([Oiii]5007) is large, and the core component dominates. The middle configuration accounts for modest shifts that are found to be frequent in large quasar sample. The core component is less prominent, and a blueshifted component affects the profile. The bottom sketch provides the interpretation for the blue outliers: the blueshifted semibroad component dominates the emission. The last two configurations are found in Pop. A, with blue-outliers being increasingly more frequent toward extreme Pop. A (Marziani et al., 2003b).
At low-, the shape and the trends of the [Oiii]4959,5007 profile along the 4DE1 sequences can be interpreted in a simple evolutionary scenario. At one extreme, we have low-mass back hole that are still accreting at a high pace. At the other end we have very massive black holes, which are, in the local Universe at low , accreting at a very low rate. Some of them are massive black holes, still active (the ones that we see as extreme Pop. B) but they are probably approaching the end of their duty cycle; they have already spent most of their lifetime as luminous active nuclei. In this sense the difference in [Oiii]4959,5007 profile may trace an evolutionary sequence, as one goes from a compact NLR (Zamanov et al. 2002 model suggested a size pc in a local NLSy1, Ton 28) to an extended NLR, 1-10 kpc in size. The origin of the NLR in Seyfert galaxies is associated with interaction between the radio ejecta and circumnuclear gas (Capetti et al., 1996), and some evidence exists in favor of the same process for quasars (Leipski and Bennert, 2006). Therefore the development of a full fledged NLR may follow the same timescale of radio jet propagation on kpc-sized scales.
There is a general consensus that the NLR gas is photoionized from the central continuum source. The strongest evidence in favor of photoionization is provided by the constant equivalent width of the [Oiii]4959,5007 semibroad component as a function of quasar luminosity (Fig. 4).
At 1.5, the half slit width 0.3 arcsec corresponds to a projected linear size of 2.6 kpc, assuming concordance cosmology. The inner NLR is fully included within our slit. Even if there is probably a large scatter in the gas content of bulges in high- and low- galaxies that may account for difference in prominence of the core comment (Zhang et al., 2013), there might be a physical limit to the NLR size and total luminosity (Netzer et al., 2004; Hainline et al., 2014). Netzer et al. (2004) suggest that the NLR linear size cannot greatly exceed 6 kpc. If this is the case, at high quasar luminosity the luminosity of the semibroad blueshifted component still correlates with the quasar luminosity that is only indirectly affected by the bulge interstellar medium (ISM) distribution and physical state. In other words, at very high luminosity the semibroad blueshifted component tends to overwhelm the narrower component associated with [Oiii]4959,5007 emission in the host spheroid. This explanation may account for the NLR “disappearance” revealed by Netzer et al. (2004). Interestingly, if one distinguishes between sources with high and low ratio [Oiii]5007/H, and specifically between sources above and below [Oiii]5007/H, Popović and Kovačević (2011) found that there is a different dependence on luminosity for FWHM([Oiii]5007) in the range [ergs s-1]. If [Oiii]5007/H 0.5 (i.e., mostly for Pop. A sources that are in general weak [Oiii]4959,5007 emitters), there is neat correlation between continuum luminosity at 5100 Å and [Oiii]5007 FWHM. On the converse, if [Oiii]5007/H 0.5, the FWHM is not correlated with luminosity, and a larger fraction of sources show relatively narrow [Oiii]5007 profiles (see Fig. 4 of Popović and Kovačević 2011). This finding also supports the idea that the core component – which should dominate for [Oiii]5007/H 0.5 and in Pop. B sources – is not strongly related to the active nucleus. It may instead be significantly affected by host properties. Further work should address the problem of the luminosity-size relations (Schmitt et al., 2003; Netzer et al., 2004; Bennert et al., 2006) in light of the two-component interpretation suggested in this and other papers.
So, is the increase in prevalence of blue outliers an effect associated with luminosity or with evolution? Clearly, the HE sources are extremely luminous quasars. Unless they radiate highly super-Eddington, their black hole masses have already reached the values found for the most massive fossil black holes in the local Universe (as the one of M87, M⊙, Walsh et al. 2013). They are therefore quasars whose black hole masses are not expected to grow much more even if they are still accreting matter at high rate. In a sense they are evolved systems, but of a kind that is not found in the local Universe. What at low- can be understood as an evolutionary effect (Fig. 6), appears as a luminosity effect at high . The higher frequency of BOs may be a consequence of high Eddington ratio at high black hole mass and of selection effects. Selection effects still make it impossible to include low Eddington radiators even with the most massive black holes at 2 in major flux-limited surveys (Sulentic et al., 2014): they are not yet discovered because they are too faint.
5.2 Implication of blueshifts
There is little doubt that the [Oiii]4959,5007 blueshift is produced by Doppler effect due to gas motion with respect to the observer, and to selective obscuration, as the [Oiii]4959,5007 emission is optically thin and scattering processes appear unlikely over the large spatial scales of [Oiii]4959,5007 emission. From the [Oiii]5007 luminosity we can retrieve information on the mass of ionised gas and on the kinetic luminosity of the outflow. This is a first step in the analysis of feedback processes: mechanical feedback is possible only if there is a large flow of matter that significantly affects the ISM and star formation processes (e.g., Fabian, 2012, and references therein). The following calculations are intended as order of magnitude estimates of the outflow kinetic power. The gas mass emitting [OIII]5007 can be written as, under the assumption of constant density:
where is the metallicity in solar units, the density in units of cm-2, and the [Oiii]5007 luminosity in units of 1044 ergs s-1 (two-thirds of the HE sample, and three quarters of the HE-BOs have ([Oiii]5007) in the range 0.1 – 1). The metallicity is in the NLR of luminous quasars, and is appropriate to assume for density cm-2, (Nagao et al., 2006). The mass outflow rate at a distance (1 kpc) can be written as, if the flow is confined to a solid angle of of volume :
where is the line radial velocity in units of 1000 km s-1. We followed the approach of Cano-Díaz et al. (2012), assuming a constant density. Unlike Cano-Díaz et al. (2012) however, the HE quasar outflow is not spatially resolved and a tentative value for has to be assumed. This value is provided by the projected linear half width of the slit 2.6 kpc. The outflow kinetic power can then be estimated from:
The total energy expelled over a duty cycle of 108 yr (appropriate for highly accreting, massive black holes, Marconi et al. 2004) is
This value can be compared to the binding energy of the gas in a massive bulge/spheroid of mass :
where is the effective radius in units of 2.5 kpc, and is the gas mass ratio in units of 0.1. For the very luminous HE objects, these order-of-magnitude estimates suggest that the outflow traced by the [Oiii]5007 lines has a significant feedback effect on host galaxy. Unfortunately parameters like are very poorly determined; should be seen as an upper limit since the line emitting region is not resolved. This however implies that and are lower limits. In addition, the [Oiii]5007 kinetic power is only part of the kinetic power, as there is gas associated with nuclear outflow that is too hot to be detected in the optical (for example, the gas associated with the ultra fast outflows (UFO) of Tombesi et al. 2010). A more detailed assessment of mechanical feedback effects would require knowledge of how the kinetic power of the nuclear outflow is dispersed in the host galaxy and transferred to its ISM. This is obviously beyond the scope of the present paper.
6 Conclusion
The blue outliers have been considered in a small number of works as oddities and ignored in most of AGN research. However, at low as well as at intermediate - they trace powerful outflows associated with nuclear activity that may have a significant feedback effect especially at high . An important result of the present paper is that large [Oiii]4959,5007 blueshifts are frequent and that the [Oiii]4959,5007 emission is more associated with the so-called semibroad component whose equivalent width is fairly constant. A straightforward implication is that the semibroad component traces an outflow that is mainly of nuclear origin. However, IFU studies of intermediate redshift quasars (e.g., Cano-Díaz et al., 2012; Carniani et al., 2015, and references therein) are revealing a more complex scenario involving spatially resolved structures in which part of the [Oiii]4959,5007 emission is associated with host galaxy star formation. All BOs of the HE sample should be prime candidates for more detailed studies at high spatial resolution.
References
- Aoki et al. (2005) Aoki, K., Kawaguchi, T., Ohta, K.: Astrophys. J. 618, 601 (2005). arXiv:astro-ph/0409546. doi:10.1086/426075
- Bachev et al. (2004) Bachev, R., Marziani, P., Sulentic, J.W., Zamanov, R., Calvani, M., Dultzin-Hacyan, D.: ApJ 617, 171 (2004). arXiv:astro-ph/0408334. doi:10.1086/425210
- Bae and Woo (2014) Bae, H.-J., Woo, J.-H.: Astrophys. J. 795, 30 (2014). 1409.1580. doi:10.1088/0004-637X/795/1/30
- Baskin and Laor (2004) Baskin, A., Laor, A.: Mon. Not. R. Astron. Soc. 350, 31 (2004). arXiv:astro-ph/0403365. doi:10.1111/j.1365-2966.2004.07833.x
- Baskin and Laor (2005) Baskin, A., Laor, A.: Mon. Not. R. Astron. Soc. 358, 1043 (2005). arXiv:astro-ph/0501436. doi:10.1111/j.1365-2966.2005.08841.x
- Bennert et al. (2006) Bennert, N., Jungwiert, B., Komossa, S., Haas, M., Chini, R.: Astron. Astrophys. 459, 55 (2006). astro-ph/0606367. doi:10.1051/0004-6361:20065477
- Bian et al. (2005) Bian, W., Yuan, Q., Zhao, Y.: MNRAS 364, 187 (2005). doi:10.1111/j.1365-2966.2005.09552.x
- Bonning et al. (2005) Bonning, E.W., Shields, G.A., Salviander, S., McLure, R.J.: Astrophys. J. 626, 89 (2005). astro-ph/0503045. doi:10.1086/429882
- Boroson and Green (1992) Boroson, T.A., Green, R.F.: ApJS 80, 109 (1992). doi:10.1086/191661
- Botte et al. (2005) Botte, V., Ciroi, S., di Mille, F., Rafanelli, P., Romano, A.: Mon. Not. R. Astron. Soc. 356, 789 (2005). doi:10.1111/j.1365-2966.2004.08499.x
- Boyle et al. (2000) Boyle, B.J., Shanks, T., Croom, S.M., Smith, R.J., Miller, L., Loaring, N., Heymans, C.: Mon. Not. R. Astron. Soc. 317, 1014 (2000). arXiv:astro-ph/0005368. doi:10.1046/j.1365-8711.2000.03730.x
- Brotherton (1996) Brotherton, M.S.: Astrophys. J. Suppl. Ser. 102, 1 (1996). arXiv:astro-ph/9507067. doi:10.1086/192249
- Cano-Díaz et al. (2012) Cano-Díaz, M., Maiolino, R., Marconi, A., Netzer, H., Shemmer, O., Cresci, G.: Astron. Astrophys. 537, 8 (2012). 1112.3071. doi:10.1051/0004-6361/201118358
- Capetti et al. (1996) Capetti, A., Axon, D.J., Macchetto, F., Sparks, W.B., Boksenberg, A.: Astrophys. J. 469, 554 (1996). doi:10.1086/177804
- Carniani et al. (2015) Carniani, S., Marconi, A., Maiolino, R., Balmaverde, B., Brusa, M., Cano-Díaz, M., Cicone, C., Comastri, A., Cresci, G., Fiore, F., Feruglio, C., La Franca, F., Mainieri, V., Mannucci, F., Nagao, T., Netzer, H., Piconcelli, E., Risaliti, G., Schneider, R., Shemmer, O.: Astron. Astrophys. 580, 102 (2015). 1506.03096. doi:10.1051/0004-6361/201526557
- Dimitrijević et al. (2007) Dimitrijević, M.S., Popović, L.Č., Kovačević, J., Dačić, M., Ilić, D.: Mon. Not. R. Astron. Soc. 374, 1181 (2007). astro-ph/0610848. doi:10.1111/j.1365-2966.2006.11238.x
- Eracleous and Halpern (2004) Eracleous, M., Halpern, J.P.: Astrophys. J. Suppl. Ser. 150, 181 (2004). astro-ph/0309498. doi:10.1086/379823
- Fabian (2012) Fabian, A.C.: Annu. Rev. Astron. Astrophys. 50, 455 (2012). 1204.4114. doi:10.1146/annurev-astro-081811-1-125521
- Gebhardt et al. (2000) Gebhardt, K., Bender, R., Bower, G., Dressler, A., Faber, S.M., Filippenko, A.V., Green, R., Grillmair, C., Ho, L.C., Kormendy, J., Lauer, T.R., Magorrian, J., Pinkney, J., Richstone, D., Tremaine, S.: Astrophys. J. Lett. 539, 13 (2000). arXiv:astro-ph/0006289. doi:10.1086/312840
- Grupe (2004) Grupe, D.: Astron. J. 127, 1799 (2004). arXiv:astro-ph/0401167. doi:10.1086/382516
- Hainline et al. (2014) Hainline, K.N., Hickox, R.C., Greene, J.E., Myers, A.D., Zakamska, N.L., Liu, G., Liu, X.: Astrophys. J. 787, 65 (2014). 1404.1921. doi:10.1088/0004-637X/787/1/65
- Hu et al. (2008) Hu, C., Wang, J.-M., Ho, L.C., Chen, Y.-M., Bian, W.-H., Xue, S.-J.: ApJL 683, 115 (2008). 0807.2060. doi:10.1086/591848
- Iglewicz and Hoaglin (1993) Iglewicz, B., Hoaglin, D.: Volume 16: How to Detect and Handle Outliers. The ASQC Basic References in Quality Control: Statistical Techniques. ASQC Quality Press, (1993)
- Komossa et al. (2008) Komossa, S., Xu, D., Zhou, H., Storchi-Bergmann, T., Binette, L.: Astrophys. J. 680, 926 (2008). 0803.0240. doi:10.1086/587932
- Kriss (1994) Kriss, G.: Astronomical Data Analysis Software and Systems III, A.S.P. Conference Series 61, 437 (1994)
- Leipski and Bennert (2006) Leipski, C., Bennert, N.: Astron. Astrophys. 448, 165 (2006). astro-ph/0511280. doi:10.1051/0004-6361:20054459
- Marconi et al. (2004) Marconi, A., Risaliti, G., Gilli, R., Hunt, L.K., Maiolino, R., Salvati, M.: Mon. Not. R. Astron. Soc. 351, 169 (2004). astro-ph/0311619. doi:10.1111/j.1365-2966.2004.07765.x
- Marziani and Sulentic (2012) Marziani, P., Sulentic, J.W.: NARev 56, 49 (2012). 1108.5102. doi:10.1016/j.newar.2011.09.001
- Marziani and Sulentic (2014) Marziani, P., Sulentic, J.W.: Mon. Not. R. Astron. Soc. 442, 1211 (2014). 1405.2727. doi:10.1093/mnras/stu951
- Marziani et al. (2006) Marziani, P., Dultzin-Hacyan, D., Sulentic, J.W.: In: Kreitler, P.V. (ed.) Accretion onto Supermassive Black Holes in Quasars: Learning from Optical/UV Observations vol. New Developments in Black Hole Research, p. 123. Nova Press, New York (2006)
- Marziani et al. (2008) Marziani, P., Sulentic, J.W., Dultzin, D.: In: Revista Mexicana de Astronomia y Astrofisica Conference Series. Revista Mexicana de Astronomia y Astrofisica Conference Series, vol. 32, p. 69 (2008)
- Marziani et al. (2003a) Marziani, P., Sulentic, J.W., Zamanov, R., Calvani, M., Dultzin-Hacyan, D., Bachev, R., Zwitter, T.: ApJS 145, 199 (2003a). doi:10.1086/346025
- Marziani et al. (2003b) Marziani, P., Dultzin-Hacyan, D., D’Onofrio, M., Sulentic, J.W.: AJ 125, 1897 (2003b). arXiv:astro-ph/0212547. doi:10.1086/368142
- Marziani et al. (2003c) Marziani, P., Zamanov, R.K., Sulentic, J.W., Calvani, M.: MNRAS 345, 1133 (2003c). arXiv:astro-ph/0307367. doi:10.1046/j.1365-2966.2003.07033.x
- Marziani et al. (2009) Marziani, P., Sulentic, J.W., Stirpe, G.M., Zamfir, S., Calvani, M.: A&Ap 495, 83 (2009). 0812.0251. doi:10.1051/0004-6361:200810764
- Marziani et al. (2013) Marziani, P., Sulentic, J.W., Plauchu-Frayn, I., del Olmo, A.: AAp (2013). 1305.1096
- Mathur (2000) Mathur, S.: Mon. Not. R. Astron. Soc. 314, 17 (2000). arXiv:astro-ph/0003111. doi:10.1046/ j.1365-8711.2000.03530.x
- Merritt and Ferrarese (2001) Merritt, D., Ferrarese, L.: Astrophys. J. 547, 140 (2001). arXiv:astro-ph/0008310. doi:10.1086/318372
- Nagao et al. (2006) Nagao, T., Maiolino, R., Marconi, A.: Astron. Astrophys. 447, 863 (2006). arXiv:astro-ph/0508652. doi:10.1051/0004-6361:20054127
- Negrete et al. (2014) Negrete, C.A., Dultzin, D., Marziani, P., Sulentic, J.W.: in preparation (2014)
- Nelson and Whittle (1996) Nelson, C.H., Whittle, M.: Astrophys. J. 465, 96 (1996). doi:10.1086/177405
- Netzer et al. (2004) Netzer, H., Shemmer, O., Maiolino, R., Oliva, E., Croom, S., Corbett, E., di Fabrizio, L.: Astrophys. J. 614, 558 (2004). arXiv:astro-ph/0406560. doi:10.1086/423608
- Popović and Kovačević (2011) Popović, L.Č., Kovačević, J.: Astrophys. J. 738, 68 (2011). 1106.3021. doi:10.1088/0004-637X/738/1/68
- Richards et al. (2006) Richards, G.T., Lacy, M., Storrie-Lombardi, L.J., Hall, P.B., Gallagher, S.C., Hines, D.C., Fan, X., Papovich, C., Vanden Berk, D.E., Trammell, G.B., Schneider, D.P., Vestergaard, M., York, D.G., Jester, S., Anderson, S.F., Budavári, T., Szalay, A.S.: Astrophys. J. Suppl. Ser. 166, 470 (2006). arXiv:astro-ph/0601558. doi:10.1086/506525
- Schmitt et al. (2003) Schmitt, H.R., Donley, J.L., Antonucci, R.R.J., Hutchings, J.B., Kinney, A.L., Pringle, J.E.: Astrophys. J. 597, 768 (2003). astro-ph/0307255. doi:10.1086/381224
- Shemmer et al. (2004) Shemmer, O., Netzer, H., Maiolino, R., Oliva, E., Croom, S., Corbett, E., di Fabrizio, L.: Astrophys. J. 614, 547 (2004). arXiv:astro-ph/0406559. doi:10.1086/423607
- Stern and Laor (2013) Stern, J., Laor, A.: Mon. Not. R. Astron. Soc. 431, 836 (2013). 1210.6394. doi:10.1093/mnras/stt211
- Sulentic and Marziani (2015) Sulentic, J.W., Marziani, P.: ArXiv e-prints (2015). 1506.01276
- Sulentic et al. (2000a) Sulentic, J.W., Marziani, P., Dultzin-Hacyan, D.: ARA&A 38, 521 (2000a). doi:10.1146/annurev.astro.38.1.521
- Sulentic et al. (2000b) Sulentic, J.W., Marziani, P., Zwitter, T., Dultzin-Hacyan, D., Calvani, M.: ApJL 545, 15 (2000b). arXiv:astro-ph/0009326. doi:10.1086/317330
- Sulentic et al. (2002) Sulentic, J.W., Marziani, P., Zamanov, R., Bachev, R., Calvani, M., Dultzin-Hacyan, D.: ApJL 566, 71 (2002). arXiv:astro-ph/0201362. doi:10.1086/339594
- Sulentic et al. (2004) Sulentic, J.W., Stirpe, G.M., Marziani, P., Zamanov, R., Calvani, M., Braito, V.: A&Ap 423, 121 (2004). arXiv:astro-ph/0405279. doi:10.1051/0004-6361:20035912
- Sulentic et al. (2006) Sulentic, J.W., Repetto, P., Stirpe, G.M., Marziani, P., Dultzin-Hacyan, D., Calvani, M.: A&Ap 456, 929 (2006). arXiv:astro-ph/0606309. doi:10.1051/0004-6361:20054153
- Sulentic et al. (2012) Sulentic, J.W., Marziani, P., Zamfir, S., Meadows, Z.A.: Astrophys. J. Lett. 752, 7 (2012). 1203.5992. doi:10.1088/2041-8205/752/1/L7
- Sulentic et al. (2014) Sulentic, J.W., Marziani, P., del Olmo, A., Dultzin, D., Perea, J., Alenka Negrete, C.: Astron. Astrophys. 570, 96 (2014). 1406.5920. doi:10.1051/0004-6361/201423975
- Tombesi et al. (2010) Tombesi, F., Sambruna, R.M., Reeves, J.N., Braito, V., Ballo, L., Gofford, J., Cappi, M., Mushotzky, R.F.: Astrophys. J. 719, 700 (2010). 1006.3536. doi:10.1088/0004-637X/719/1/700
- Vrtilek and Carleton (1985) Vrtilek, J.M., Carleton, N.P.: Astrophys. J. 294, 106 (1985). doi:10.1086/163279
- Wall et al. (2005) Wall, J.V., Jackson, C.A., Shaver, P.A., Hook, I.M., Kellermann, K.I.: Astron. Astrophys. 434, 133 (2005). astro-ph/0408122. doi:10.1051/0004-6361:20041786
- Walsh et al. (2013) Walsh, J.L., Barth, A.J., Ho, L.C., Sarzi, M.: Astrophys. J. 770, 86 (2013). 1304.7273. doi:10.1088/0004-637X/770/2/86
- Whittle (1985) Whittle, M.: Mon. Not. R. Astron. Soc. 213, 33 (1985)
- Wisotzki et al. (2000) Wisotzki, L., Christlieb, N., Bade, N., Beckmann, V., Köhler, T., Vanelle, C., Reimers, D.: Astron. Astrophys. 358, 77 (2000). astro-ph/0004162
- Zamanov et al. (2002) Zamanov, R., Marziani, P., Sulentic, J.W., Calvani, M., Dultzin-Hacyan, D., Bachev, R.: ApJL 576, 9 (2002). arXiv:astro-ph/0207387. doi:10.1086/342783
- Zamfir et al. (2010) Zamfir, S., Sulentic, J.W., Marziani, P., Dultzin, D.: Mon. Not. R. Astron. Soc. 403, 1759 (2010). 0912.4306. doi:10.1111/j.1365-2966.2009.16236.x
- Zhang et al. (2011) Zhang, K., Dong, X.-B., Wang, T.-G., Gaskell, C.M.: Astrophys. J. 737, 71 (2011). 1105.1094. doi:10.1088/0004-637X/737/2/71
- Zhang et al. (2013) Zhang, K., Wang, T.-G., Gaskell, C.M., Dong, X.-B.: Astrophys. J. 762, 51 (2013). 1211.1113. doi:10.1088/0004-637X/762/1/51