Phase stability and lattice dynamics of ammonium azide under hydrostatic compression
Abstract
We have investigated the effect of hydrostatic pressure and temperature on phase stability of hydro-nitrogen solids using dispersion corrected Density Functional Theory calculations. From our total energy calculations, Ammonium Azide (AA) is found to be the thermodynamic ground state of N4H4 compounds in preference to Trans-Tetrazene (TTZ), Hydro-Nitrogen Solid-1 (HNS-1) and HNS-2 phases. We have carried out a detailed study on structure and lattice dynamics of the equilibrium phase (AA). AA undergoes a phase transition to TTZ at around 39-43 GPa followed by TTZ to HNS-1 at around 80-90 GPa under the studied temperature range of 0-650 K. The accelerated and decelerated compression of and lattice constants suggest that the ambient phase of AA transforms to a tetragonal phase and then to a low symmetry structure with less anisotropy up on further compression. We have noticed that the angle made by Type-II azides with -axis shows a rapid decrease and reaches a minimum value at 12 GPa, and thereafter increases up to 50 GPa. Softening of the shear elastic moduli is suggestive of a mechanical instability of AA under high pressure. In addition, we have also performed density functional perturbation theory calculations to obtain the vibrational spectrum of AA at ambient as well as at high pressures. Further, we have made a complete assignment of all the vibrational modes which is in good agreement with the experimental observations at ambient pressure. Also the calculated pressure dependent IR spectra show that the N-H stretching frequencies undergo a red and blue-shift corresponding to strengthening and weakening of hydrogen bonding, respectively below and above 4 GPa. Intensity of the N-H asymmetric stretching mode B2u is found to diminish gradually and the weak coupling between NH4 and N3 ions makes B1u and B3u modes to be degenerate with progression of pressure up to 4 GPa which causes weakening of hydrogen bonding and these effects may lead to a structural phase transition in AA around 4 GPa. Furthermore, we have also calculated the phonon dispersion curves at 0 and 6 GPa and no soft phonon mode is observed under high pressure.
I Introduction
Ammonium Azide (AA) has been attracting considerable interest as a precursor for synthesis of polymeric nitrogen due to its high nitrogen content of 93.3 by weight and also the fact that it gives out environment friendly decomposition products.wu It also exhibits extensive hydrogen bonding between ammonium cation and terminal nitrogen atoms of azide anions.prince ; amorim Unlike the alkali, alkaline-earth and transition metal azides which are either ionic or covalent,colton AA is found to have mixed bonding with unique properties. It has got much attention recently as a gas generator due to its weak explosive characteristics.yakovleva Using Kamlet-Jacobs equations, the calculated detonation properties, namely, detonation velocity and pressure are found be 6.45 km/s and 15.16 GPa, respectively.kondal AA is used to inflate safety cushions in auto-mobiles with a suitable oxidizer and also used as a solid rocket propellant in photochemical micro-rockets for altitude control.maycock In order to address its potential applications, one has to understand the crystal structure and physical properties at the microscopic level. Several experimental studies have been reported in the literature exploring fundamental properties at ambient conditions. Frevelfrevel first reported the crystal structure of AA which was re-determined later using single crystalprince and powderamorim X-ray diffraction. The infra-red (IR) vibrational spectra were reporteddows , which was followed by a combined IR and Raman study.gray It was further refined and extended by Iqbal et aliqbal who analyzed the vibrational modes of azide ion and the low frequency lattice modes using far-IR and Raman spectroscopic techniques at ambient pressure and low temperatures. From theoretical perspective, the structural, mechanical, electronic and optical properties of AA were reported at ambient pressure from first principles calculations at 0 K.kondal ; Liu1
Since inorganic azides undergo a series of phase transitions involving lattice distortions coupled with changes in the orientation of the linear azide anions thereby forming polymeric nitrogen networks under pressure, high pressure study of these materials has become an active field of research during the last decade.cheng2 Synthesis of polymeric nitrogen from molecular nitrogen (NN is the strongest bond, 954 kJ/mol) has been achievedpopov ; eremets1 ; hemley and it consists of individual nitrogen atoms connected by single bonded (N-N) networks. It is the best green high energetic density material (HEDM) known till date.eremets1 ; hemley The azides consist of linear-rod-shaped N ions with quasi double bonds (N=N bond is weaker than NN, 418 kJ/mol). Hence, it can be expected that the (N=N=N)- ions of metal azides may form polymeric nitrogen networks more readily than molecular nitrogen (NN).popov Among the inorganic azides, AA is quite interesting due to modification in the strength of hydrogen bonding under compression. Raman spectroscopic studieswu ; klapotke1 ; klapotke2 revealed that it undergoes a polymorphic phase transition around 3 GPa due to weakening of the hydrogen bonding under pressure. This is reinforced by recent high pressure X-ray and Neutron powder diffraction studies on AA and the transition pressure is found to be 2.6 GPa,millar and 2.9 GPa,wu ; Wu2 ; Landerville1 respectively but still the crystal structure of high pressure phase has remained elusive until now. Hu and Zhanghu proposed that AA and Trans-Tetrazene (TTZ) could be precursors for the high-pressure synthesis of hydro-nitrogen solid (HNS-1) with crystal symmetry and it can be obtained at 36 and 75 GPa from AA and TTZ, respectively using standard Generalized Gradient Approximation parameterized by Perdew-Burke-Ernzerhof (PBE-GGA) functional. In our previous studykondal we systematically studied the effect of semi-empirical dispersion correction methods on structural properties of AA along with standard DFT functionals. The dispersion corrected PBE functional (vdW-TS) developed by Tkatchenko and SchefflerTkatchenko1 works better for the molecular crystalline solid AA in contrast to conventional DFT functionals. Following this study, Liu and co-workers predicted the phase stability of N4H4 compounds at ambientLiu2 as well as under compression up to 80 GPaLiu3 using the vdW-TS method. They proposed a new tetragonal phase (HNS-2) with crystal symmetry . The order of stability of the four phases at ambient pressure is as follows: AA TTZ HNS-2 HNS-1 and they also encounter a series of phase transitions from AA HNS-2 at 5.6 GPa, HNS-2 AA at 15 GPa, AA TTZ at 30 GPa and TTZ HNS-1 at 69.2 GPa. Recently these transitions are revisited for AA, TTZ, HNS-1 phases and reportedLanderville1 that the transitions found to occur between AA TTZ at 41.4 GPa and TTZ HNS-1 at 89.4 GPa, respectively using DFT-D2 method. There is an inconsistency between theoretical calculations in predicting the phase transition pressures using various dispersion corrected approaches and also dependence of temperature on phase stability of N4H4 compounds is unknown. With this motivation, we have investigated relative phase stability of N4H4 compounds, structure and lattice dynamics of AA at ambient as well as at high pressure using dispersion corrected density functional calculations. The rest of the paper is organized as follows: in section II, we briefly describe the methodology of computation. Results and discussion concerning phase stability of hydro-nitrogen solids as well as structural and lattice dynamics of AA under high pressure are presented in section III. Finally section IV summarizes the conclusions of the paper.
II Method of computation
Thermodynamic stability was investigated by comparing free energy of the investigated hydro-nitrogen solids. In order to predict the thermodynamic ground state of N4H4 compounds, we have calculated Gibbs free energy of the four investigated compounds. The Gibbs free energy for any material at a given temperature is
| (1) |
where F, P, T and V are the Helmholtz free energy, pressure, absolute temperature and volume, respectively. F(V,T) is the sum of vibrational free energy and perfect lattice energy i.e. F(V, T) = Fvib + Fperfect. The vibrational free energy Fvib calculated within the harmonic approximation is given by
| (2) |
where is the phonon frequency, is the reduced Planck constant and is the Boltzmann constant, and Fperfect = E0 + Eel - TSel. E0 and Eel- TSel are the contributions from the lattice and electronic excitations, respectively. If the electronic excitations are neglected then the Gibbs free energy can be calculated by G = E0 + PV + Fvib = H0 + Fvib, where H0 = E0 + PV is the enthalpy at T = 0 K and E0 denotes the change in energy of atoms in the unit cell of a perfect crystal with respect to the energy of the isolated atoms.
The van der Waals (vdW) interactions missing in the standard DFT can be efficiently modeled by adding a pair wise interatomic interaction (C) to the DFT energy
| (3) |
where RAB is the distance between atoms A and B, C6AB is the corresponding C6 coefficient, and are the vdW radii of atoms A and B.
One of the novel methods for computing non-empirical dispersion coefficients is vdW-TS scheme of Tkatchenko and Scheffler,Tkatchenko1 which is sensitive to chemical environment of the atoms. In this method, C6AB is obtained from the Casimir-Polder integral which is given by
| (4) |
and a Fermi type damping function fdamp = is used to eliminate spurious interactions at too short distances. The free-atom reference values of and are taken from the self-interaction corrected Time Dependent(TD)-DFT calculations of Chu and Dalgarno.Chu They take advantage of the relationship between the effective volume and polarizability to calculate dispersion coefficients that depend on the chemical environment of the atom. Hirshfeld partitioningHirshfeld of the electron density of the system is used to obtain contribution from each atom to the density. This effective density, and hence the volume, is compared to the density of the free-reference atom to obtain a scaling factor which is used to define the response of the dispersion coefficients to chemical environment. However, the vdW-TS scheme does not include long range electrostatic screening beyond the range of the exponentially decaying atomic densities.Tkatchenko2 Recently Tkatchenko et alTkatchenko2 proposed a computationally efficient method (TS-SCS) extension to the vdW-TS method, in which they considered electrodynamic response effects, in particular, the interactions of the atoms with the dynamic electric field due to the surrounding polarizable atoms and also account for many-body effects based on the coupled fluctuating dipole model. In this method, the frequency dependent screened polarizability is obtained by solving self-consistent screening equation.
| (5) |
Cambridge Series of Total Energy Package (CASTEP)Payne is used to calculate the structural and vibrational spectrum of the N4H4 compounds. We have used Norm-conserving (NC) pseudo potentials (PP) for electron-ion interactions, as they are well suited for phonon calculationsTroullier while PBE-GGABurke was used to treat electron-electron interactions. The Broyden-Fletcher-Goldfarb-Shanno (BFGS) minimization schemeAlmlof has been used for the structural relaxation. The convergence criteria for structural optimization was set to ultrafine quality with a kinetic energy cutoff of 850 eV and 20.025 separation of k-mesh according to the Monkhorst-Pack grid scheme.Monkhorst The self-consistent energy convergence less than 5.010-6 eV/atom and maximal force between atoms was set to 0.01 eV/Å. The maximum displacement and stress were set to be 5.010 and 0.02 GPa, respectively.
The elastic constants and phonon dispersion curves of AA are computed using density functional perturbation (DFPT)Baroni theory implemented in the Vienna ab-initio Simulation Package (VASP)Kresse . The initial geometry is further relaxed, and ensured a force convergence of the order 10-5 eV/atom with zero external pressure. The phonon dispersion that is calculated using the unit cell shows the frequencies of some of the modes to be imaginary. Since VASP code computes the dynamical matrix in real space, we have to use a sufficiently large super cell to incorporate the long range nature of the dynamical matrix. To compute the phonon dispersion curves a super cell of size 1 2 1 (64 atoms) has been used. The force constant matrix is computed and the dynamical matrix is obtained from its Fourier transform. The eigenvalues and eigenvectors of the dynamical matrix will yield square of the phonon frequencies and polarization of each mode. The DFPT calculations will give the phonon frequencies and polarization at zone center (q=0). In order to obtain the phonon dispersion in the entire Brillouin zone, we used an auxiliary post process package PHONOPY.Togo All the CASTEP and VASP calculations were performed using vdW-TS and TS-SCS schemes, respectively.
III Results and discussion
III.1 Phase stability of N4H4 compounds
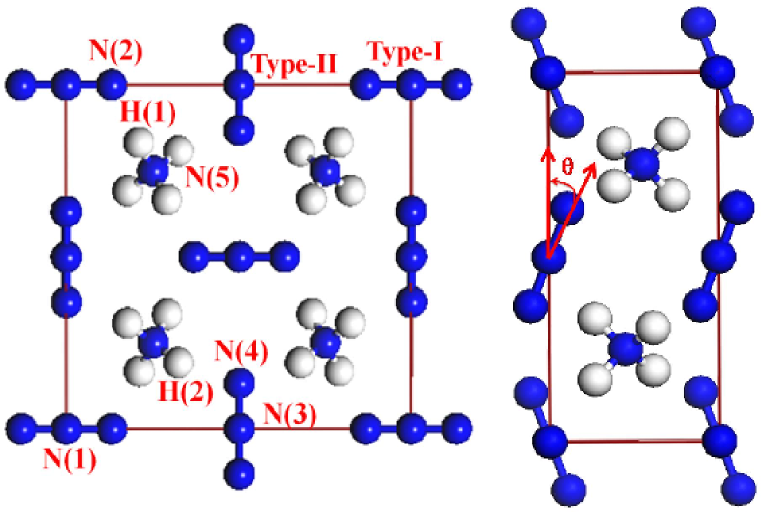
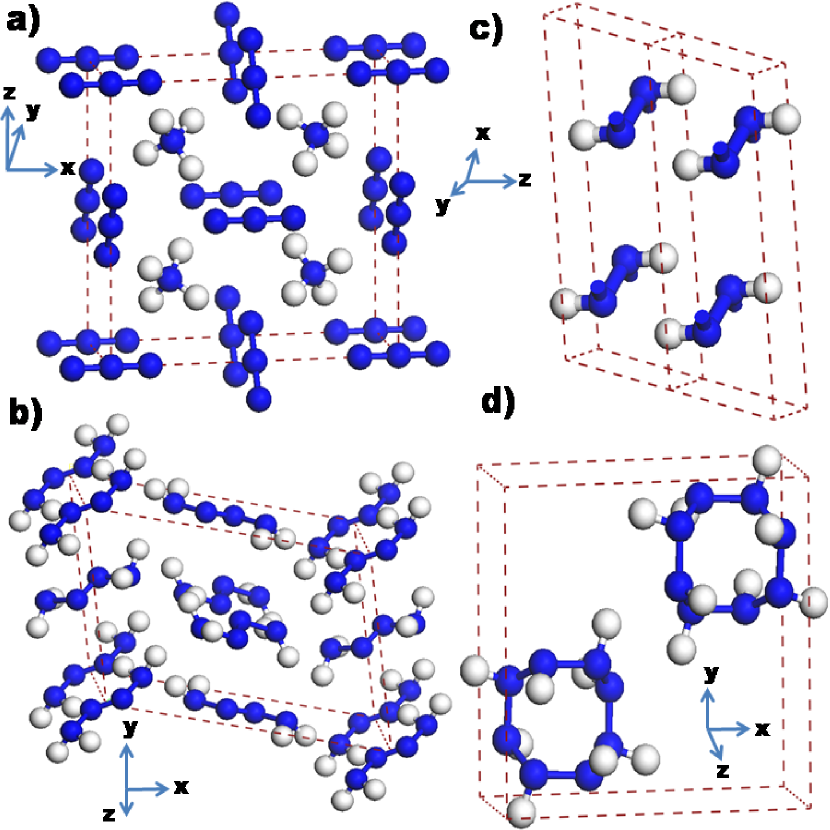
At ambient conditions, AA crystallizes in the orthorhombic structure with space group .wu ; prince ; amorim ; millar It possesses distorted CsCl-type structure because of strong hydrogen bonding between NH and N ions and the arrangement of azide ion is similar to that in the ambient structures of heavy metal (Ag, Tl) azides. Due to presence of the hydrogen bonding one half of the azide anions lie parallel to a-axis (Type-I) and the other half lie perpendicular to a-axis (Type-II) as depicted in figure 1 by allowing a tetrahedral arrangement around a single ammonium cation.millar TTZ is a molecular crystal, which consists of non-linear arrangement of four N-atoms in a chain with two hydrogen atoms each attached to both ends of the N4 molecule and four such molecules are arranged with symmetry in the unit cell.Veith HNS-1 contains similar molecular structure as TTZ with a hydrogen atom attached to each nitrogen atom in each (NH)2 unit and the two units are separated by a distance within the unit cell of symmetry.hu Recently a new tetragonal phase has been predicted with symmetry,Liu3 where two (NH)4 units form a distorted cyclic octagon within the unit cell, in which each nitrogen atom is attached to one hydrogen atom. The crystal structures of the four N4H4 compounds are shown in figure 2 and all these phases are molecular crystalline solids. However, most of the energetic systems such as primary (Fulminates, Azides, Styphanates, etc.) and secondary (RDX, HMX, TNT, PETN, etc.) explosive molecular crystals are bonded through weak dispersive interactions. The non-covalent weak interactions such as hydrogen bonding and dispersive interactions play a significant role in determining the stability of these molecular solids. It is well known that the standard DFT functionals are inadequate to predict the long range interactions in molecular crystalline solids. Consequently, semi-empirical dispersion correction methods have been developed and implemented through the standard DFT functionals to provide an accurate description of long range weak interactions. In our previous studykondal , we have investigated the structural and elastic properties of AA at ambient pressure using the dispersion corrected DFT-D2 and vdW-TS methods along with standard DFT functionals. As discussed in the previous section, we also show that the vdW-TS method is successful in predicting the ground state properties of AA over DFT-D2 method.kondal ; Landerville2 Hence we have used the dispersion corrected vdW-TS and TS-SCS methods for all the calculations in the present study. As a first step, we have performed full structural optimization including lattice geometry and fractional coordinates of the four N4H4 compounds. The calculated unit cell parameters for these compounds are consistent with the available experimental datawu ; prince ; amorim ; millar and other theoretical calculationshu ; Liu2 ; Liu3 which are presented in Table 1.
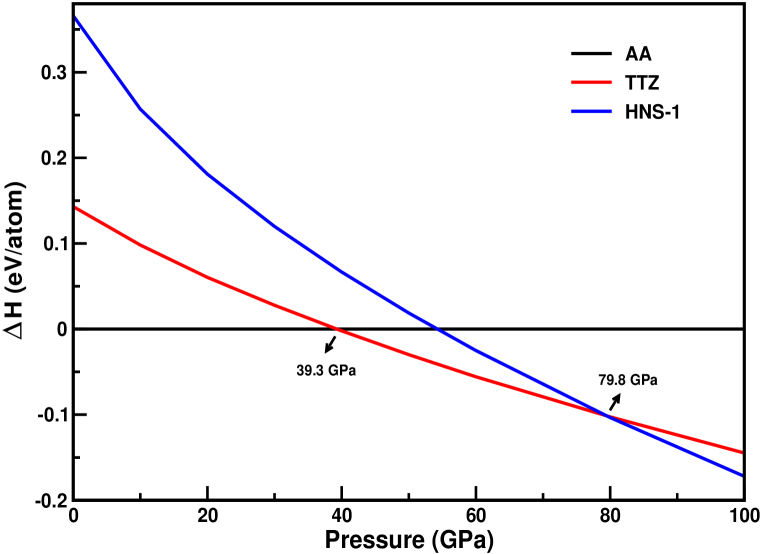
From our first principles calculations, we found that total energies of the N4H4 compounds increase in the following order; E E E E at ambient pressure. The total energy of the AA is lowered by 0.15, 0.36, 0.38 eV/atom when compared to TTZ, HNS-2, and HNS-1, respectively and the order of stability is consistent with the previous calculations.hu ; Liu2 ; Liu3 This clearly shows that AA is the relatively stable phase among the studied N4H4 compounds at ambient pressure. What happens to the order of stability at higher pressures for these four phases We made an attempt to investigate the phase transitions and the possibility for the formation of hydro-nitro solid under high pressure. As illustrated in figure 3, we predict a series of phase transitions AA TTZ at 39.3 GPa, TTZ HNS-1 at 79.8 GPa using NCPP approach, which are in good agreement with recent theoretical calculationsLanderville1 using dispersion corrected DFT-D2 method. Also the transition pressures obtained using ultra-soft pseudo-potential (USPP) approach are found to be AA TTZ at 27.5 GPa, TTZ HNS-1 at 74.2 GPa (see figure 1 of the supplementary material) and are comparable with the ones obtained in the study by Liu et al.Liu3 The inconsistency between transition pressures of the examined compounds are due to difference in the pseudo-potentials used in the calculations. Recent Raman spectroscopic measurements reveal that the HNS-1 will be formed at even much higher pressures ( 71 GPa) and hence the transition pressures obtained using NCPP including dispersive interactions are in good agreement with the experimental observations.Landerville1 Medvedev et alklapotke1 determined the pressure at which polymorphic structural phase transition from phase I to II occurs at around 3 GPa and phase II consists of NH4 and N3 ions similar to phase I with a difference that both of the azide groups must occupy equivalent crystallographic positions to be consistent with observations from Raman spectroscopy. This is further confirmed by the single crystal X-ray diffraction study and the phase II is temporarily assigned as tetragonal phase.wu Recently Liu et alLiu3 predicted the crystal structure of the tetragonal phase with symmetry and it possesses a distorted cyclic structure which is in contrast to the structure proposed by the Raman spectroscopic measurements.klapotke1 In addition, they also find structural transitions from AA HNS-2 at 5.6 GPa and HNS-2 AA at 15 GPa. In order to resolve the above issues we systematically investigated the high pressure behavior of AA and HNS-2 phases and we found that AA does not undergo a transition to HNS-2 phase below 20 GPa (see figure 2 of the supplementary material). Therefore the prediction/determination of crystal structure of phase II is still an open challenge for both theoreticians and experimentalists.
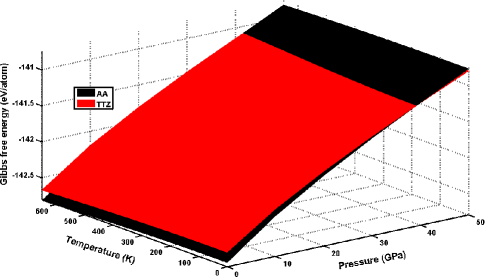
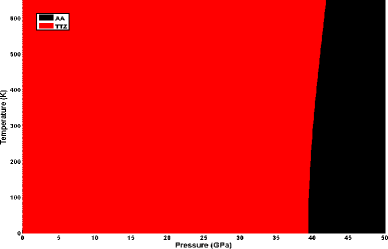
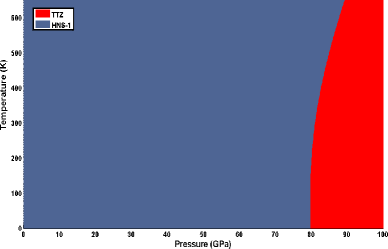
In addition, we also considered the contribution of lattice vibration at elevated pressure and temperatures. Since AA decomposes at 673 K (400 0C)yakovleva , we have plotted Gibbs free energy as a function of pressure (0-100 GPa) and temperature (0-650 K) within vdW-TS method. As illustrated in figure 4, AA undergoes a structural transition to TTZ around 39.3 GPa at 0 K (see figure 3) and the transition pressure increases to 42.6 GPa with increasing temperature up to 650 K. Further, TTZ transforms to HNS-1 around 79.8 GPa at 0 K (see figure 3) and the transition pressure increases from 79.8 to 89.7 GPa when the temperature raises from 0 to 650 K. Overall, we observe that AA is the thermodynamic ground state of N4H4 compounds which is consistent with the previous theoretical calculationsLiu2 ; Liu3 ; Wu2 and also AA transforms to TTZ around 39-43 GPa followed by transformation of TTZ to HNS-1 around 80-90 GPa under the studied temperature range 0-650 K.
III.2 Structural and mechanical properties of AA under high pressure
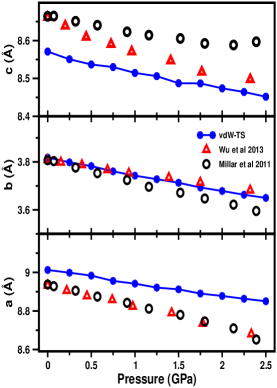
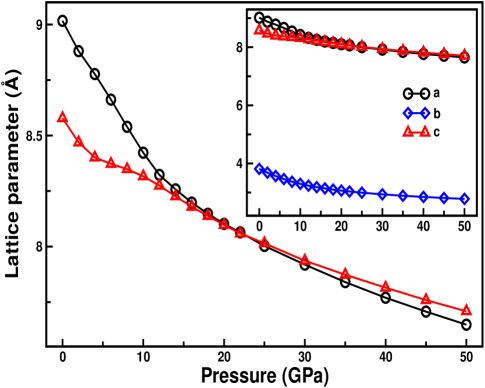
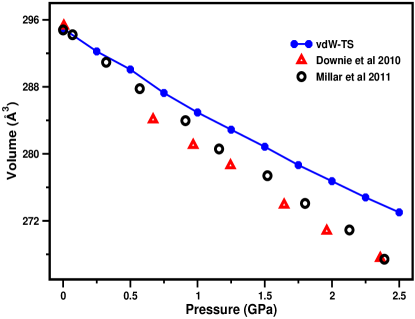
We have also studied the structural properties of the thermodynamic ground state (AA) of N4H4 compounds under pressure up to 0-2.5 GPa, 0-20 GPa and 20-50 GPa in steps of 0.25, 2 and 5 GPa, respectively. The pressure dependent unit cell parameters obtained using vdW-TS method are in good accordance with the experimental datawu ; millar within 0-2.5 GPa with an exception for lattice parameter c, which shows a larger contraction due to over binding within the studied pressure range (see figure 5a). As shown in figure 5b, we observe that there is a strong anisotropy between the lattice constants , and in the low pressure region (0-3 GPa). The lattice constants and approach towards each other because of accelerated and decelerated compression of and lattice constants respectively and they merge between 18-22 GPa. This is due to rotation of Type-II azide ions and reduction in the hydrogen bond energy,Wu2 consequently the anisotropic phase I undergoes transition to phase II under compression. This will be further confirmed by lattice dynamical calculations under pressure in the up coming section. Raman spectroscopic studies suggest that phase II is stable up to 55 GPaklapotke1 . However, based on our present calculations we predict that phase II further transforms to a less anisotropic low symmetry structure around 22 GPa. In addition, we have also compared the calculated normalized lattice parameters (, , , and ) at ambient pressure (0 GPa) with the experimental data (0.07 GPa is experimental ambient pressure).millar The calculated relative compressibilities of unit cell axes are presented in figure 5c along with the experimental results.millar The reduction of lattice parameter is larger under compression which is clearly seen from the study of the first order pressure coefficients X = ( = , , ). The calculated first order pressure coefficients (in GPa-1) using vdW-TS scheme are found to be 8.9 10-3, 20.4 10-3, and 6.6 10-3 for lattice parameters , , and , respectively. This clearly shows that -axis is the most compressible due to flattening of the wave-like planes of N anions under compression which further reveals that AA is sensitive to impact along the -axis. Crystallographic -axis is the least compressible because of Type-II azide anions align parallel to -axis with increasing pressure as shown in figure 5c, resulting in an excellent agreement with the experimental observationwu ; millar as well as with our recent theoretical prediction from the longitudinal elastic constants.kondal The calculated ordering of the elastic constants (C33 C11 C22) further confirm that -axis is the most and -axis is the least compressible axes for AA.kondal ; Liu2 As illustrated in figure 5d, the calculated pressure-volume (P-V) data is consistent with the experimentsmillar ; laura especially in the low pressure region. This might be due to fact that the dispersion coefficients C6 used for the chemical species N and H are kept constant over the studied pressure range. Overall, the experimental trends are well reproduced by the vdW-TS method up to 2.5 GPa. We also calculated equilibrium bulk modulus () and it is found to be 27.6 GPa by fitting pressure-volume data to 2nd order Birch-Murnaghan equation of state.murnaghan The obtained value of 27.6 GPa is slightly higher when compared to the experimental values of 24.5wu , 20.2millar , and 19.8laura GPa and it is consistent with our previously calculated value of 26.34 GPa using USPP.kondal The of AA lies between the values of Alkali Metal Azides (AMA) and Heavy Metal Azides (HMA) indicating that AA is relatively harder than AMA and softer than HMA.
The elastic behavior of a crystalline solid is described by its matrix of second-order elastic constants, which is given in the Voight notation by the expression
| (6) |
where V is the equilibrium volume, denotes the strain and E is total energy of the crystal which is given by
| (7) |
where E0 is the energy of the unstrained perfect crystal. The elastic constants matrix is a real symmetric matrix of size 66,Mouhat and hence it can have at most 21 independent matrix elements. These 21 matrix elements are indeed independent of each other in a crystal with least symmetry. Thus there are 21 independent elastic constants for crystals with triclinic Bravais lattice. The number of independent elastic constants become smaller as the symmetry of the crystal increases. There are only three independent elastic constants for crystals with cubic symmetry. It turns out that there are 9 independent elastic constants for crystals with orthorhombic structure, which are C11, C22, C33, C44, C55, C66, C12, C13, and C23. Further, the nine elastic constants are classified into three categories such as (i) longitudinal ( C11, C22, C33), (ii) shear (C44, C55, C66) and (iii) transverse coupling (C12, C13, C23) elastic constants. C11, C22, and C33 couple an applied normal stress component in the crystallographic , and -directions with a uniaxial strain along the crystallographic , and -axes, respectively. On the other hand, C44, C55, and C66 couple an applied shear stress in the crystallographic , and -planes with a shear strain along the crystallographic , and -planes, respectively. Finally, C12 and C13 couple an applied normal stress component in the crystallographic -direction with a uniaxial strain along the crystallographic and -axes, respectively whereas C23 couples a uniaxial strain along -direction to an applied normal stress component along crystallographic -direction.
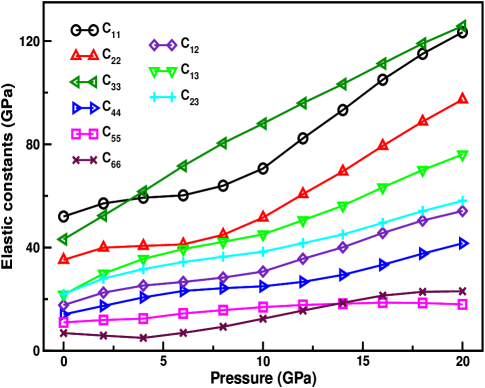
In order to get more insight on structural phase transition in AA, we have also calculated the elastic constants at ambient as well as at high pressure up to 20 GPa. The calculated elastic constants at ambient pressure are consistent with our previouskondal and otherLiu2 theoretical calculations. A crystalline lattice is mechanically stable at zero pressure only if the Born stability criteriaBorn are fulfilled. In case of orthorhombic systems the stability criteria areMouhat
| (8) |
The obtained elastic constants satisfy the Born stability criteria indicating that AA is mechanically stable at ambient pressure. When a non-zero uniform stress is applied to the crystal, the above criteria to describe the stability limits of the crystal at finite strain are not adequate and the Born stability criteria must be modified.Monteseguro Sin’ko and Smirnov reported the theoretical conditions of elasticity under pressureSinko1 ; Sinko2 and the modified elastic constants for a orthorhombic crystal under pressure are C̃${}_{ii}$ = Cii-P, (for = 1-6), C̃${}_{12}$ = C12+P, C̃${}_{13}$ = C13+P and C̃${}_{23}$ = C23+P. Hence new stability criteria are obtained by replacing the elastic constants in eqn (8) by the modified elastic constants. Therefore, AA is mechanically stable under hydrostatic pressure when the generalized Born stability criteria are:
| (9) |
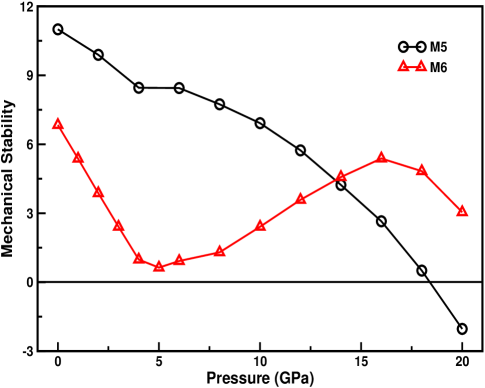
are simultaneously satisfied. As depicted in figure 6a, the calculated elastic constants show a non-monotonic variation with pressure. The pressure dependent elastic constants obey the generalized Born stability criteria as given in eqn (9) except M5 and it is plotted as a function of pressure along with M6. As illustrated in figure 6b, M6 decreases up to 5 GPa and later it increases up to 16 GPa and then starts decreasing with pressure, which indicates that the applied pressure drives shear instability in the system up to 5 GPa and then stabilizing above 5 GPa. Also M5 violates the stability criteria between 18-20 GPa, which clearly indicates the mechanical instability of AA under high pressure. Softening of the shear elastic moduli M5 and M6 suggests a shear instability of AA under pressure. Karki et alKarki reported that elastic instability bounds the transition pressure and determines the transition pressure precisely for first and second order phase transitions, respectively. Mechanical stability criteria, M6 and M5 bounds the transition pressure for AA and hence one can expect that the phase transition in AA is of first order type.
III.3 Hydrogen bonding in AA under pressure
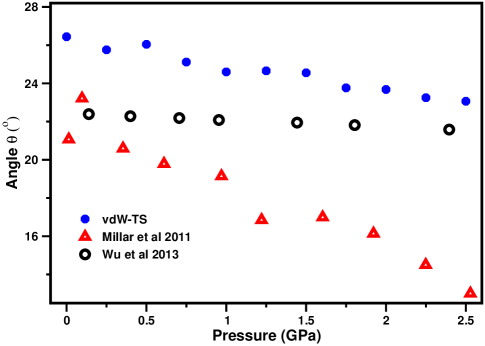
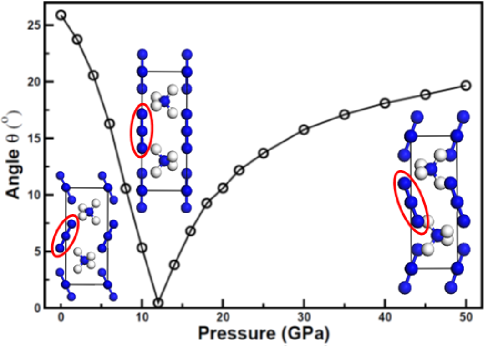
As discussed in section I, Raman spectroscopic measurements on AAklapotke1 ; klapotke2 revealed that it undergoes a polymorphic structural phase transition about 3.0 GPa due to weakening of the hydrogen bonding under pressure. They also proposed two possible reasons for weakening of hydrogen bondingklapotke1 which are 1) elongation of N…N distance due to the rotation of azide (N) ion, which leads to increment of the N-H bond length. 2) Reorientation of NH ions leading to bending of N-H…N bond.klapotke1 A recent experimental study wu on AA shows that N-H…N bond decreases with pressure and the weakening of hydrogen bonding is only because of the bending of N-H…N bond, which is possibly due to movement of ammonia cation and rotation of azide (Type-II) ions. In order to confirm this, we made an attempt to investigate the high pressure behavior of intermolecular hydrogen bonds. The angle made by Type-II azides with c-axis (see figure 1), angle , is plotted in the pressure range 0-2.5 GPa. As seen from figure 7a, the angle decreases with pressure, which is consistent with the experimental datawu whereas the Neutron powder diffraction data shows a much rapid decrease of the angle in the pressure range of 0-2.5 GPa.millar Further we investigated the angle beyond 2.5 GPa and observe a rapid decrease below 12 GPa, it reaches a minimum value at 12 GPa and then it starts increasing with pressure up to 50 GPa as shown in figure 7b which is due to re-orientation of Type-II azide ions with respect to c-axis under compression. The calculated hydrogen bond lengths (N(5)…N(2) and N(5)…N(4)) and the corresponding bond angles (N(5)-H(1)…N(2) and N(5)-H(2)…N(4)) under pressure are shown in figure 4 of the supplementary material. The calculated N(5)…N(2) and N(5)…N(4) bond lengths decrease with pressure and are in good agreement with the experimental data up to 2.5 GPa.wu The reorientation of NH ions leads to bending of N-H…N hydrogen bond and this can be analyzed by calculating the intermolecular hydrogen bond angles of N-H…N bonds under compression. The calculated hydrogen bond angles show a significant variation (176-178) between 4-10 GPa and the N(5)-H(2)…N(4) reaches a maximum value at 10 GPa due to orientation of Type-II azide ions as shown in figure 8.
III.4 Zone centre vibrational spectrum of AA at ambient pressure
IR and Raman spectroscopic techniques have been used for the identification and characterization of energetic materials.fell2 The vibrational properties of a molecular solid provide information about the intra- and inter-molecular bonding. Therefore, the changes in vibrational properties are important indicators for understanding physical and chemical changes in the molecular crystals. The quantum mechanical DFT methods have proven themselves as essential tools for interpretations and predicting vibrational spectra of materials.hess ; krishnakumar In the present study, the vibrational spectrum of AA is calculated using linear response method within density functional perturbation theory (DFPT) and a detailed analysis of the vibrational spectra and their complete assignment have been made at ambient as well as at high pressure. Single crystal X-ray and Neutron powder diffraction studieswu ; prince ; amorim ; millar revealed that AA crystallizes in the orthorhombic structure with Pmna space group; NH and N ions occupy the sites of symmetry C2 and C2h, respectively. It consists of four molecules per unit cell (or 32 atoms per cell) resulting in the 96 vibrational modes, which are further classified into 3 acoustic and 93 optical modes. According to the group theory analysis of Pmna space group, the symmetry decomposition of the modes as follows.
= B1u B2u B3u
= 15B1u 14B2u 11B3u 11B1g 10B2g 11B3g 10Ag 11Au
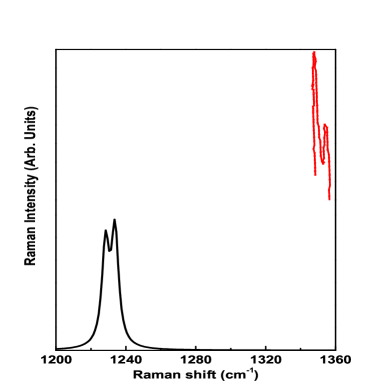
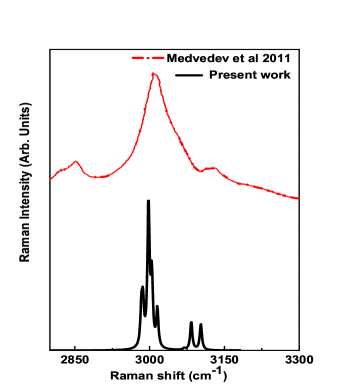
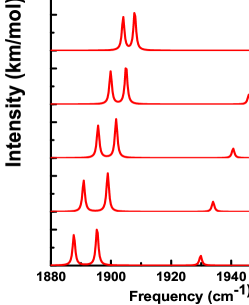
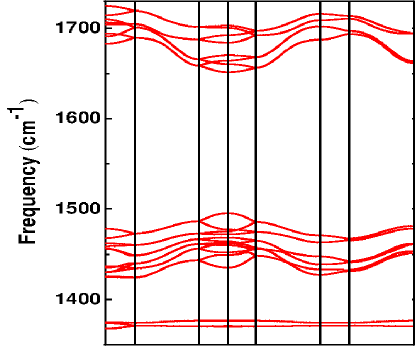
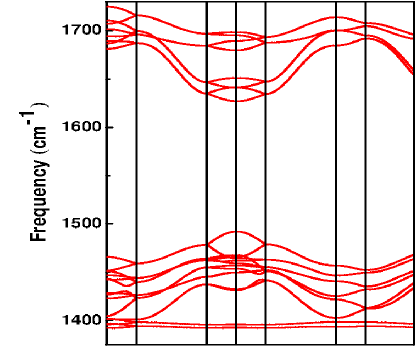
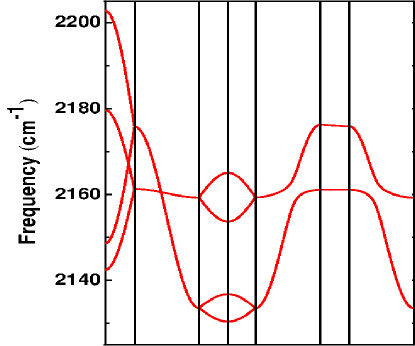
The optical modes B1u, B2u, and B3u are IR active, whereas B1g, B2g, B3g, and Ag are Raman active. Au mode vibrations are silent as they do not cause change in polarizability or dipole moment and therefore these modes are neither Raman nor IR active. The calculated optical modes and their vibrational assignment at ambient pressure are given in Table I of the supplementary material. The modes from M96 to M89 and M88 to M81 are due to asymmetric and symmetric stretching of N-H bands, respectively. This is consistent with Dows et aldows assignment of the absorption between 2800 and 3200 cm-1. The strongest Raman mode frequency 2998.2 cm-1 (see figure 9e) in N-H symmetrical stretching region is in excellent agreement with the experimental value of 3000 cm-1.klapotke1 Modes from M80 to M77 originate from N=N=N asymmetric stretching of azide (Type-I II) ions are in good accord with measured value of 2030 cm-1.dows Most of the vibrational modes for NH ion in AA are assigned based on the vibrational modes of well-known ammonium halides (NH4Cl and NH4Br). Bending motion of NH ion lies between M76 to M69, and the analogous frequencies in case of NH4Clwagner1 and NH4Brwagner2 are 1712 and 1686 cm-1, respectively. Apart from N-H…N short distance from the crystal structurewu ; prince ; amorim ; millar , the clear spectroscopic indications of hydrogen bonding in AAklapotke1 ; dunsmuir are due to shift of bending mode frequency above 1400 cm-1, torsional and bending motion of NH ion about 1830 and 2080 cm-1, respectively. This is also seen from our present calculations, N-H wagging, rocking and scissoring vibrations arise from M68 to M57 modes and are consistent with measured values of 1400dows and 1430klapotke1 cm-1 and also these vibrations are comparable with ammonium halides, 1402 for NH4Clwagner1 and 1401 cm-1 for NH4Br.wagner2 The calculated N=N=N symmetric stretching (M56 to M53) modes (doublet is due to presence of Type-I II azide ions) of azide ions are consistent with the calculated values for LiN3 (1269.5)ramesh1 and KN3 (1228.5).ramesh2 However, the calculated values smaller than the experimental values of 1345dows and 1350klapotke1 cm-1 but the splitting of the doublet is 5.5 cm-1 which is in good agreement with experimental valueklapotke1 of 5 cm-1.
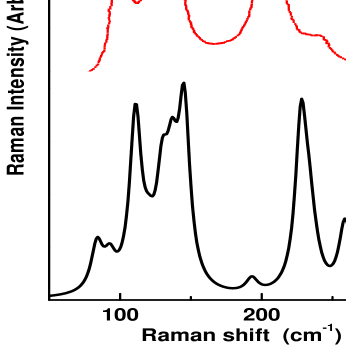
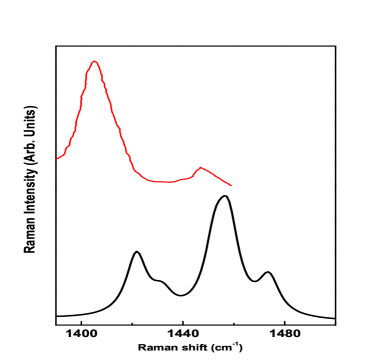
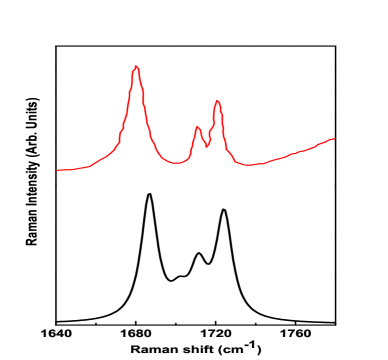
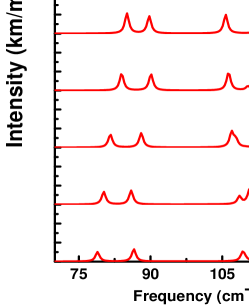
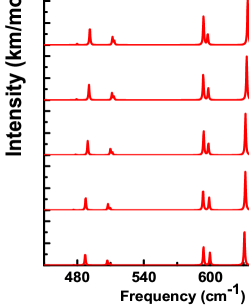
The calculated N=N=N bending and N-H rotational motion of (M52 to M45) modes are consistent with measured values of 664 and 652 cm-1.dows The modes from M44 to M33 (525.1 to 476.5 cm-1) arises from NH torsional motion and this can be clearly seen from figure 10c and the obtained torsional mode frequencies are in good agreement with recent theoretical calculations at ambient pressure.Wu2 Infrared Spectroscopydows and Inelastic Neutron Scattering boutin studies revealed that the torsional mode of NH ion is located at 42020 cm-1 and the free rotational motion of NH ion is prevented by the existence of this torsional motion due to the hydrogen bonding between the nitrogen of NH ion and the closest nitrogens of azide ions (N-H…N), whereas the torsional motion of Raman bands are very weak, therefore these modes were not observed in the Raman spectroscopic studies at ambient as well as at high pressure.iqbal ; klapotke1 The torsional frequency (in cm-1) of ammonium azide and halides decreases in the following order:dows ; satyanarayana NH4F (523) NH4N3 (420) NH4Cl (359) NH4Br (319) NH4I (297) and this shows that the rotational motion of NH ion is hindered in both NH4F and NH4N3 than other mentioned ammonium halides due to the strong hydrogen bonding. The mode M32 is purely from the rotation of both NH and N ions, whereas M31 and M30 arise from translation motion of NH ion, which agrees well with the observediqbal Raman mode value of 240 cm-1. The modes from M29 to M4 originate from rotational or translation, or a combined rotational and translation motion of NH and N ions and the vibrational assignment for each mode is given in Table I of supplementary material. The calculated Raman and IR vibrational modes at ambient pressure are shown in figures 9 and 10, respectively. As illustrated in figure 9, the calculated Raman spectra at ambient pressure is in close agreement with measured spectra from Raman spectroscopic studies at 0.25 GPa.klapotke1
III.5 IR spectra of AA under pressure
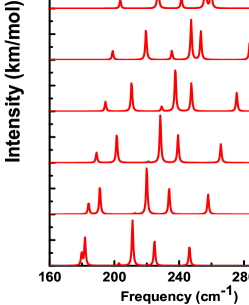
In general, a structural transformation in materials under compression is experimentally probed by IR and Raman spectroscopy by monitoring the changes in the vibrational spectra under compression.Landerville2 Therefore, we have calculated the IR spectra under pressure up to 12.0 GPa and it can be divided into five parts as shown in figure 10. As illustrated in figures 10a and b, as pressure increases the frequency of lattice modes (M4-M52) are found to increase, especially the modes in the Far-IR region (below 300 cm-1) which implies hardening of the lattice under pressure. The lattice modes include NH, N translation, rotational (see figure 10a b), NH torsion and N bending (see figure 10c) vibrational modes. The N=N=N asymmetric modes (M77-M80) show a blue shift under compression (see figure 10e) whereas the N-H scissoring, rocking (M57-M68) and N-H stretching (M81-M96) modes exhibit a red shift under compression (see figures 10d and f). Due to the presence of hydrogen bonding it can be expected that the N-H stretching frequency decreases with increase in pressurereynolds and this compression leads to strengthening of hydrogen bonding. Joseph et aljoseph made an unified explanation for strengthening of hydrogen bonding (X-H…Y) based on red/blue shift of IR frequency and its corresponding intensity. The contraction of hydrogen donor bond (X-H) due to electron affinity of X atom and the associated blue shift and decrease of intensity in IR spectrum or elongation of hydrogen donor bond (X-H) due to attraction between the positive H and electron rich Y atom. As shown in figures 10d f, the N-H scissoring, rocking and stretching mode frequencies show a red shift and an increase in the intensity of the corresponding vibrational modes up to 4 GPa, which clearly indicates strengthening of the hydrogen bonding under compression below 4.0 GPa. Also the N-H stretching frequencies show a blue-shift between 5-12 GPa which shows weakening of the hydrogen bonding as shown in figure 10g. As displayed in figure 10f g, two N-H asymmetric stretching B2u (2988.6 cm-1) and B3u (2989.2 cm-1) degenerate modes lift the degeneracy whereas the B1u (3012.4 cm-1) and B3u (3015.1 cm-1) non-degenerate modes become degenerate under pressure. This is due to strong and weak coupling between N-H band of NH4 and terminal nitrogens of type-I and II azide ions which strengthens and weakens the hydrogen bonding, respectively in the pressure range 0-4 GPa. In addition, we also observe the intensity of asymmetric N-H stretching mode B2u (3001.2 cm-1) decreases with pressure and it diminishes between 3-4 GPa. Weakening of hydrogen bonding and disappearance of B2u mode might be the driving force for the structural transition from phase I II as seen in the experiments.wu ; klapotke1
III.6 Phonon dispersion curves of AA under high pressure
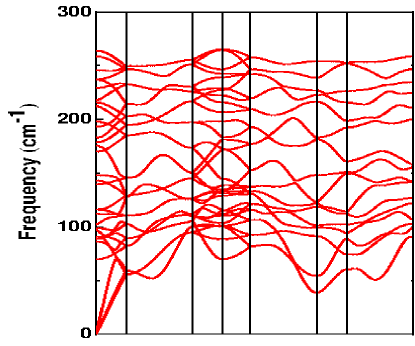
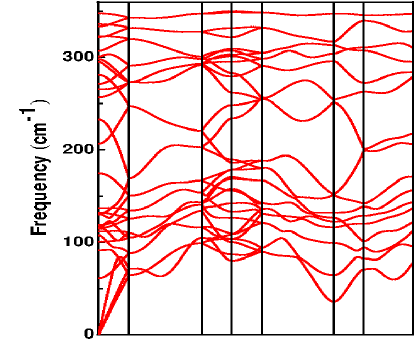
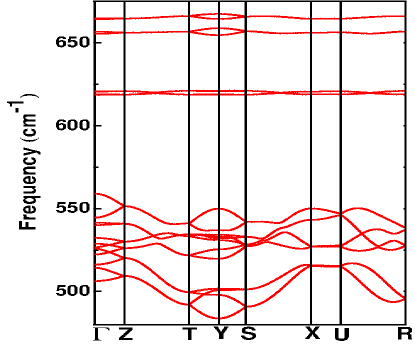
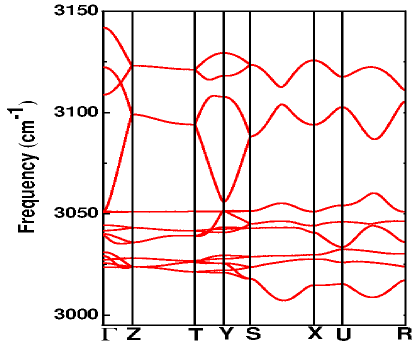
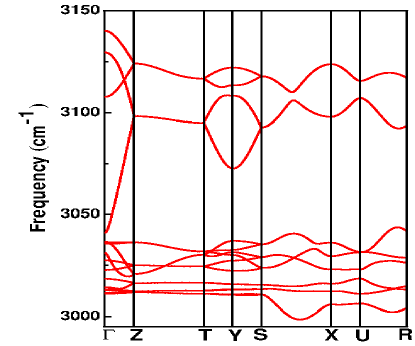
In order to get more insight on the dynamical stability of crystalline AA under high pressure, the phonon dispersion curves are calculated at 0 and 6 GPa with 1 2 1 super cell (64 atoms). The computed phonon dispersion curves are plotted along Z-T-Y-S-X and U-R high symmetry directions of the Brillouin zone. As depicted in figure 11, all the lattice modes ( 700 cm -1) shift towards high frequency region except a phonon branch that shows softening (from 38.8 to 35.5 cm-1) along the high symmetry S-X-direction when compared at 0 and 6 GPa pressures (see figures 11a b). It is also found that the lattice phonon branches become dispersive at 6 GPa. However, the phonon frequencies are still real along X-direction at 6 GPa which shows the dynamical stability of AA at this pressure. The degenerate N3 bands around 620 cm-1 at 0 GPa become non-degenerate modes at 6 GPa (see figures 11 c d). As illustrated in figure 12a, the lowest lying Raman bands correspond to symmetric stretching of Type-I II azide ions at 0 GPa which persist even at high pressure 6 GPa, but the Raman measurementswu ; klapotke1 have only one stretching band in this region above 3 GPa which is due to the fact that the two azides occupy equivalent Wyckoff positions in the high pressure phase (see 12a b). The present and recent theoretical calculationsabstract are unsuccessful in reproducing the Raman spectral evolution under high pressure as observed in the experiments.wu ; klapotke1 The middle and top phonon bands correspond to N-H bending modes which show a red shift when compared at 0 and 6 GPa pressures as displayed in figures 12a b. The N=N=N asymmetric phonon bands show a blue-shift with pressure as depicted in figures 12c d. The high frequency N-H symmetric and asymmetric stretching bands show a red shift as presented in figures 12e f. However, the high frequency modes show a red shift up to 4 GPa and later on they exhibit blue-shift as shown in figure 10g. We also observe that there is a deviation in the calculated phonon frequencies using NC (see figures 9 and 10) and PAW (see figures 11 and 12) pseudo potentials, especially for N=N=N symmetric and asymmetric stretching phonon modes. Overall, we observe that all the vibrational modes are real for the ambient phase (I) of AA at 0 and 6 GPa. This implies that AA is found to be dynamically stable at ambient as well as at high pressure (6 GPa) as depicted in figures 11 and 12 and also suggest that the structural transition might be due to the weakening of the hydrogen bonding under high pressure.
IV Conclusions
In summary, we made a detailed study of phase stability, structural and vibrational properties of AA under hydrostatic compression up to 50 GPa with dispersion correction methods. The calculated ground state parameters at ambient as well as at high pressure using vdW-TS and TS-SCS methods are in good agreement with experimental data and this study shows the importance of semi-empirical dispersion correction methods to capture dispersive interactions in molecular solids. The calculated compression curves are consistent with the trend followed by the elastic constants as well as with high pressure experimental data. Softening of the shear elastic moduli is suggestive of mechanical instability of AA under high pressure. AA is found to be the thermodynamic ground state of N4H4 compounds and it undergoes a series of phase transitions from AA TTZ at around 39-43 GPa and TTZ HNS-1 at 80-90 GPa under the studied temperature range of 0-650 K which are consistent with the recent theoretical calculations. The anisotropic compressibility of a and c lattice constants suggests that the ambient phase of AA undergoes a transition to tetragonal phase, and then to a less anisotropic low symmetry crystalline phase above 22 GPa. We predict a rapid decrease in the angle that Type-II azides make with c-axis () till 12 GPa and then an increase up on further compression. In addition to that we have also calculated the zone centre phonon frequencies, IR spectra using DFPT at ambient and under high pressure. The calculated vibrational frequencies at ambient pressure and their complete vibrational assignment are consistent with experimental observations. AA is found to be dynamically stable at ambient pressure and no soft phonon mode is observed beyond the experimental transition pressure from phonon dispersion curves. Also the calculated IR spectra show that the N-H stretching frequencies get a red and blue-shift below and above 4 GPa, respectively. The intensity of the B2u mode is found to diminish gradually and the weak coupling between NH4 and N3 ions makes B1u and B3u modes to be degenerate with progression of pressure up to 4 GPa which causes weakening of hydrogen bonding and these effects lead to a structural phase transition in AA around 4 GPa and this is in good agreement with the experimental observations.
V Acknowledgments
NYK and GV would like to thank Defense Research and Development Organization (DRDO) through ACRHEM for the financial support under grant No. DRDO/02/0201/2011/00060:ACREHM-PHASE-II, and the CMSD, University of Hyderabad, for providing computational facilities. NYK thanks Prof. C. S. Sunandana, School of Physics, University of Hyderabad, for critical reading of the manuscript. PA would like to acknowledge B. K. Panigrahi for his support.
∗Author for Correspondence, E-mail: gvaithee@gmail.com
References
- (1) X. Wu, H. Cui, J. Zhang, R. Cong, H. Zhu, Q. Cui, Appl. Phys. Lett., 2013, 102, 121902.
- (2) E. Prince, C.S. Choi, Acta Crystallogr. B, 1978, 34, 2606-2608.
- (3) H. S. D. Amorim, M. R. D. Amaral Jr, P. Pattison, I. P. Ludka, J. C. Mendes, J. Mex. Chem. Soc., 2002, 46, 313-319.
- (4) R. J. Colton, J.W. Rabalais, J. Chem. Phys., 1976, 64, 3481-3486.
- (5) G. S. Yakovleva, R. K. Kurgangalina, L. N. Stestik, Combustion, Explosion and Shock Waves, 1977, 13, 405-407.
- (6) N. Yedukondalu, V. D. Ghule, G. Vaitheeswaran, J. Phys. Chem. C, 2012, 116, 16910-16917.
- (7) J. N. Maycock, V. R. Pai Verneker, J. Spacecr. Rockets, 1969, 6, 336-337.
- (8) L. K. Frevel, Z. Krist., 1936, 94 197-211.
- (9) D. A. Dows, E. Whittle, G. C. Pimentel, J. Chem. Phys., 1955, 24, 1475-1479.
- (10) P. Gray, T. C. Waddington, Trans. Faraday Soc., 1957, 53, 901-908.
- (11) Z. Iqbal, M. L. Malhotra, Spectrochim. Acta. A, 1971, 27, 441-446.
- (12) Q. -J. Liu, W. Zneg, F. -S. Liu, Z. -T. Liu, Comput. Theor. Chem., 2013, 1014 37-42.
- (13) C. Ji, R. Zheng, D. Hou, H. Zhu, J. Wu, M.-C. Chyu, Y. Ma, J. Appl. Phys., 2012, 111, 112613.
- (14) M. I. Eremets, M.Y. Popov, I. A. Trojan, V. N. Denisov, R. Boehler, R. J. Hemley, J. Chem. Phys., 2004, 120, 10618-10623.
- (15) M. I. Eremets, A. G. Gavriliuk, I. A. Trojan, D. A. Dzivenko, R. Boehler, Nat. Matter., 2004, 3, 558-563.
- (16) M. I. Eremets, R. J. Hemley, H. K. Mao, E. Gregoryanz, Nature, 2001, 411 170-174.
- (17) S. A. Medvedev, M. I. Eremets, J. Evers, T. M. Klapötke, T. Palasyuk, I. A. Trojan, Chem. Phys., 2011, 386, 41-44.
- (18) S. A. Medvedev, T. Palasyuk, I. A. Trojan, P. G. Naumov, J. Evers, T. M. Klapötke, M. I. Eremets, Vibrational Spectroscopy, 2012, 58, 188-192.
- (19) D. A. Millar, Energetic materials at extreme conditions, Springer Theses, Springer-Verlag, Berlin Heideberg, (2011).
- (20) X. Wu, F. Ma, C. Ma, H. Cui, Z. Liu, H. Zhu, X. Wang, Q. Cui, J. Chem. Phys., 2014, 141, 024703.
- (21) J. C. Crowhurst, J. H. Zaug, H. B. Radousky, B. A. Steele, A. C. Landerville, I. I. Oleynik, J. Phys. Chem. A, 2014, 118, 8695-8700.
- (22) A. Hu, F. Zhang, J. Phys.: Condens. Matter, 2011, 23, 022203.
- (23) A. Tkatchenko, M. Scheffler, Phys. Rev. Lett., 2009, 102 073005.
- (24) Q. -J. Liu, N. -C. Zhang, J. Eu, Y. -Y. Sun, M. -J, Zhang, F. -S. Liu, H. -Y. Wang, Z. -T. Liu, Comput. Mat. Sci. 2014, 81, 582-586.
- (25) Q. -J. Liu, N. -C. Zhang, Y. -Y. Sun, M. -J, Zhang, F. -S. Liu, Z. -T. Liu, Phys. Lett. A, 2014, 378, 1333-1335.
- (26) X. Chu, A. Dalgarno, J. Chem. Phys., 2004, 121, 4083-4088.
- (27) F. L. Hirshfeld, Theo. Chim. Acta., 1977, 44, 129-138.
- (28) A. Tkatchenko, R. A. DiStasio Jr., R, Car, M. Scheffler, Phys. Rev. Lett., 2012, 108, 236402.
- (29) M. C. Payne, M. P. Teter, D. C. Allen, T. A. Arias, J. D. Joannopoulos, Rev. Mod. Phys., 1992, 64, 1045-1097.
- (30) N. Troullier, J. L. Martins, Phys. Rev. B, 1991, 43, 1993-2006.
- (31) J. P. Perdew, S. Burke, M. Ernzerhof, Phys. Rev. Lett., 1996, 77, 3865-3868.
- (32) T. H. Fischer, J. Almlof, J. Phys. Chem., 1992, 96, 9768-9774.
- (33) H. J. Monkhorst, J. D. Pack, Phys. Rev. B, 1976, 13, 5188-5192.
- (34) S. Baroni, S. de Gironcoli A. Del Corso and P. Giannozzi, Rev. Mod. Phys., 2001, 73, 515-562.
- (35) G. Kresse, and D. Joubert, Phys. Rev. B, 1996, 54, 11169-11186.
- (36) A. Togo, F. Oba and I. Tanaka, Phys. Rev. B, 2008, 78, 134106.
- (37) V. M. Veith, G. Schlemmer, Z. Anorg. Allg. Chem. 1992, 494, 7-19.
- (38) A. C. Landerville, B. A. Steele, I. I. Oleynik, J. Phys.: Conf. Ser., 2014, 500, 162006.
- (39) L.E. Downie, Pathways to Recovering Single-Bonded Nitrogen at Ambient Conditions: High Pressure Studies of Molecular and Ionic Azides. University of Ottawa, Canada, (2010).
- (40) F. D. Murnaghan, Proc. Natl. Acad. Sci. 1944, 30, 244-247.
- (41) F. Mouhat, F. -X. Coudert, Phys. Rev. B, 2014, 90, 224104.
- (42) M. Born, K. Huang, Dynamical Theory of Crystal Lattices; Oxford University Press: Oxford, U.K., (1998).
- (43) V. Monteseguro, P. Rodríguez-Hernández, H. M. Ortiz, V. Venkatramu, F. J. Manjón, C. K. Jayasankar, V. Lavín, A. Muñoz, Phys. Chem. Chem. Phys., 2015, 17, 9454-9464.
- (44) G.V. Sinḱo, N.A. Smirnov, J. Phys. Condens. Matter, 2002, 14, 6989-7005.
- (45) G.V. Sinḱo, N.A. Smirnov, J. Phys. Condens. Matter, 2004, 16, 8101-8104.
- (46) B. B. Karki, G. J. Ackland and J. Crain, J. Phys.: Condens. Matter, 1997, 9, 8579-8589.
- (47) N. F. Fell Jr, J.A. Vanderho, R.A. Pesce-Rodriguez, K.L.J. McNesby, J. Raman Spectrosc., 1998, 29, 165-172.
- (48) B. A. Hess Jr, J. Schaad, P. Carsky, R. Zaharaduick, Chem. Rev., 1986, 86, 709-730.
- (49) V. Krishnakumar, N. Jayamani, R. Mathammal, J. Raman Spectrosc., 2009, 40, 936-940.
- (50) E. L. Wagner, D. F. Hornig, J. Chem. Phys., 1950, 18, 296-305.
- (51) E. L. Wagner, D. F. Hornig, J. Chem. Phys. 1950, 18 305-312.
- (52) J. T. Dunsmuir, A. P. Lane, Spectrochim. Acta A, 1972, 28, 45-50.
- (53) K. Ramesh Babu, Ch. Bheema Lingam, S. P. Tewari, G. Vaitheeswaran, J. Phys. Chem. A, 2011, 115, 4521-4529.
- (54) K. Ramesh Babu, G. Vaitheeswaran, Chem. Phys. Lett., 2012, 533, 35-39.
- (55) H. Boutin, S. Trevino, H. Prask, J. Chem. Phys., 1966, 45, 401-402.
- (56) D. N. Satyanarayana, Vibrational Spectroscopy: Theory and Applications. New Delhi: New Age International (P) limited Publishers) 2nd ed. (2004), p474.
- (57) J. Reynolds, Ss. Sternste, J. Chem. Phys., 1964, 41, 47-50.
- (58) J. Joseph, E. D. Jemmis, J. Am. Chem. Soc., 2007, 129, 4620-4632.
- (59) http://meetings.aps.org/link/BAPS.2014.MAR.J26.7


| Phase | Parameter | This work | Other calculations | Experiment | ||
|---|---|---|---|---|---|---|
| USPP | NCPP | PAW | ||||
| AA | a | 9.015 | 9.012 | 9.021 | 9.0247a, 8.7539b | 8.93283f, 8.948g, 8.937h |
| (Pmna, Z=4) | b | 3.809 | 3.816 | 3.837 | 3.8089a, 3.6363b | 3.80848f, 3.808g, 3.807h |
| c | 8.551 | 8.574 | 8.482 | 8.5460a, 8.3560b | 8.66147f, 8.659g, 8.664h | |
| V | 293.66 | 294.89 | 293.57 | 275.9c, 285.4c | 294.45f, 295.05g, 294.79h | |
| E0 | -143.51 | -142.75 | -5.99 | -143.512a | ||
| TTZ | a | 10.469 | 10.498 | 10.391 | 10.5752a | 10.23i |
| (P, Z=4) | b | 6.888 | 6.904 | 7.030 | 6.8631a | 7.12i |
| c | 4.081 | 4.127 | 4.122 | 4.0264a | 4.19i | |
| 102.63 | 102.37 | 102.27 | 102.599a | 102.0i | ||
| 87.94 | 88.19 | 88.16 | 87.463a | 90.0i | ||
| 104.22 | 103.79 | 104.89 | 104.248a | 106.5i | ||
| V | 278.29 | 283.72 | 284.27 | 285.66i | ||
| E0 | -143.39 | -142.60 | -5.83 | -143.392a | ||
| HNS-1 | a | 8.395 | 8.472 | 8.307 | 8.1850a, 8.5935d | |
| (P21/m, Z=2) | b | 2.312 | 2.339 | 2.306 | 2.3114a, 2.3167d | |
| c | 3.051 | 3.076 | 3.054 | 3.0641a, 3.0021d | ||
| 107.34 | 107.46 | 107.24 | 107.38a, 105.74d | |||
| V | 56.53 | 58.15 | 55.88 | |||
| E0 | -143.19 | -142.37 | -5.58 | -143.158a | ||
| HNS-2 | a | 8.183 | 8.209 | 8.204 | 8.2348e | |
| (P42/n, Z=4) | c | 4.211 | 4.367 | 4.290 | 4.1338e | |
| V | 281.96 | 294.28 | 288.77 | |||
| E0 | -143.16 | -142.39 | -5.60 | -143.191e |