STUDY OF THE ELEMENT ABUNDANCES IN HD 140283: THE ABUNDANCE ROBUSTNESS OF THE WEAK r- AND MAIN r-PROCESS STARS
Abstract
Many works engaged to investigate the astrophysical origin of the neutron-capture elements in the metal-poor star HD 140283. However, no definite conclusions have been drawn. In this work, using the abundance-decomposed approach, we find that the metal-poor star HD 140283 is a weak r-process star. Although this star is a weak r-process star, its Ba abundance mainly originate from the main r-process. This is the reason that the ratio [Ba/Eu] for HD 140283 is close to the ratio of the main r-process. Based on the comparison of the abundances in the six weak r-process stars, we find that their element abundances possess robust nature. On the other hand, we find that abundance robust nature of the extreme main r-process stars ([r/Fe]1.5) can be extended to the lighter neutron-capture elements. Furthermore, the abundance characteristics of the weak r-process and main r-process are investigated. The abundance robustness of the two category r-process stars could be used as the constraint of the r-process theory and be used to investigate the astrophysical origins of the elements in the metal-poor stars and population I stars.
1 INTRODUCTION
HD 140283 is a metal-poor star with metallicity [Fe/H]=-2.63 and locate in the solar neighborhood. Historically, HD 140283 was paid attention because of its low Ca and Fe abundances relative to corresponding abundances in the Solar system (Chamberlain & Aller, 1951). The neutron-capture elements, which are heavier than Fe-peak elements, are produced by the r-process and the s-process (Burbidge et al., 1957). According to the s-process calculations, Arlandini et al. (1999) reported that the abundance fraction of the odd isotopes of Ba () produced by the s-process is obviously different from the fraction produced by r-process. The fractions of the s-process and r-process in the Solar system are and , respectively. In this case, the fraction should be a important indicator to reveal the contributions of the s- and r- process to the abundances of neutron-capture elements of the metal-poor star. On the other hand, the abundance ratios [Ba/Eu] of pure s-process and pure r-process in the Solar system are 1.13 and -0.69, respectively (Arlandini et al., 1999). The observed abundance ratio of the metal-poor star is also an important constraint to investigate the relative contributions of the s-process and r-process.
Based on the spectrum analysis of HD 140283, Magain (1995) derived the fraction and suggested that Ba abundance come from the s-process. However, Lamb et al. (2002) obtained spectrum of HD 140283 and derived , which is close to the fraction of the r-process. Furthermore, Gallagher et al. (2010) found that the fractions of more metal-poor stars, including HD 140283, are lower than 0.2 and suggested that their results are not agreement with current viewpoint that the neutron-capture elements of the metal-poor star dominantly come from the r-process. Recently, Siqueira et al. (2012) derived the Eu abundance of HD 140283 and obtained the abundance ratio [Ba/Eu]. Their results imply that Ba and Eu elements in HD 140283 mainly originate from the r-process. Obviously, the astrophysical origin of the elements in HD 140283 is a debate issue up to now. Because of low abundance ratios of the heavy elements relative to Fe-peak elements and very old age, it is very important to investigate the astrophysical origins of the elements in HD 140283 Bond et al. (2013).
For exploring the astrophysical origins of the elements in the metal-poor star HD 140283, in Section 2, we calculate the relative contributions from the weak r-process and main r-process to the abundances of HD 140283. Furthermore, the robust nature of abundances in the weak r-process stars and the main r-process stars are investigated in Section 3. The discussion about abundance characteristics of the main r-process and weak r-process are written in Section 4. The conclusions are presented in Section 5.
2 ASTROPHYSICAL ORIGIN OF MENTAL-POOR STAR HD 140283
For exploring the element origins in the metal-poor star HD 140283, we compare the observed abundances (Honda et al., 2004; Roederer, 2012; Siqueira et al., 2012; Bond et al., 2013) with the abundances of the weak r- and main r-process. The abundance of the ith element can be expressed as (Li et al., 2013):
| (1) |
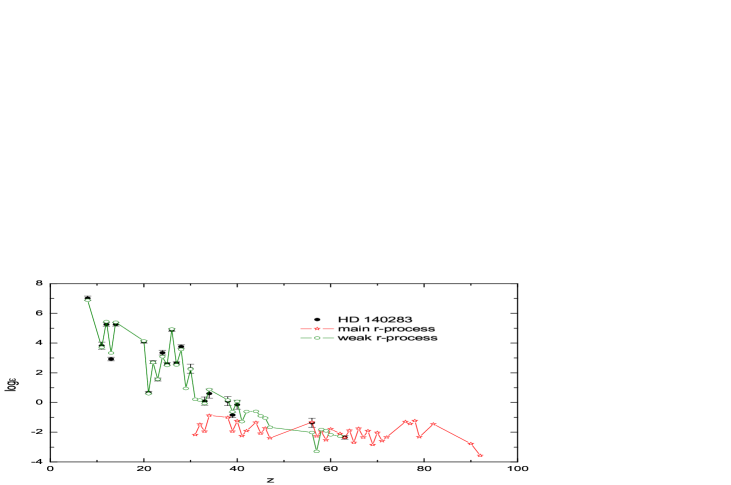
where and are the abundances of the main r-process and weak r-process respectively, which are adopted from Li et al. (2013). and are the component coefficients, which represent the relative contributions of the main r-process and weak r-process to the elemental abundances of the star. We adopt equation (1) to fit the observed abundances of HD 140283 by looking for the minimum reduced . The derived component coefficients are and . The calculated results are plotted in the Figure 1 by solid line and the observed abundances of HD 140283 are shown by filled circles. From the figure we can see that the calculations are consistent with the observations.
As suggested by Li et al. (2013), one can find the star with particular abundance pattern of the neutron-capture elements based on the component coefficients. If the component coefficient of the weak r-process is much larger than that of the main r-process, this star should be formed in a gas cloud in which the neutron-capture elements are dominantly originate from the weak r-process. Taking the weak r-process stars the HD 122563 and HD 88609 as examples, their component coefficients of the weak r-process are larger than 3.8 and the component coefficients of the main r-process are smaller than 0.6 (Li et al., 2013). On the other hand, If the component coefficient of the main r-process is much larger than that of the weak r-process, this star should be formed in a gas cloud in which the neutron-capture elements are dominantly originate from the main r-process. The component coefficients of the main r-process for the main r-process stars CS 22892-052 and CS 31082-001 are larger than 50.0 and the component coefficients of the weak r-process for the two stars are about 4.0 (Li et al., 2013). The component coefficients of HD 140283 are and , which means that this star is a weak r-process star. In order to investigate the astrophysical origins of the abundances in HD 140283, Figure 2 shows the comparisons of the calculated abundances of the main r-component and weak r-component with the observed abundances. Although this star is a weak r-process star, from the figure we can see that element Ba mainly originate from the main r-process. This is the reason that the ratio [Ba/Eu] for HD 140283 is close to the ratio of the main r-process.
The adopted approach is based on the observed abundances of HD 140283, so the related uncertainties should be contained in the model parameters. In order to investigate the uncertainties of the component coefficients, taking , the top panel of Figure 3 shows the calculated abundances as a function of the component coefficient . In this figure, solid curves represent the calculated results. Dashed line represents the observed abundance with error expressed by dotted lines. The shaded region shows the allowed range of the component coefficient. From the figure we can see that, there is a range of the component coefficients, , in which the calculated abundances fall into observed limits of . The bottom panel expresses the reduced as the function of and shows a minimum = 1.45 at = 0.6. The calculated results illustrate that the component coefficient is constrained well. Adopting similar approach, we derive the range of another component coefficient: .
3 ABUNDANCE ROBUSTNESS OF THE WEAK R-STARS AND MAIN R-STARS
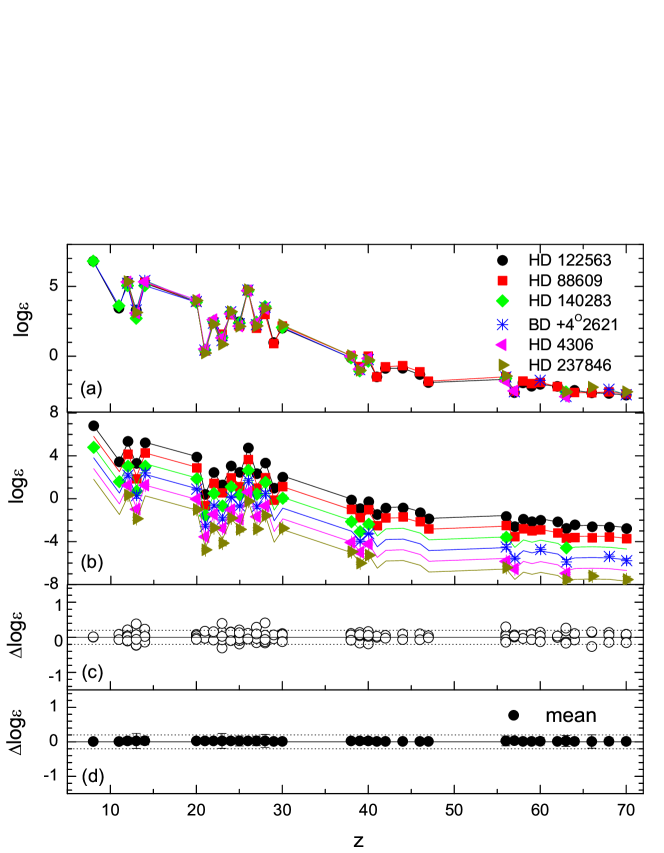
Because HD 122563 and HD 88609 are the weak r-process stars, their abundances are taken as the representative for exploring the characters of the weak r-process (Montes et al., 2007; Hansen et al., 2014). However, it is unclear whether the abundance patterns of the weak r-process stars are uniform. After adding HD 140283, six weak r-process stars have been reported up to now. For exploring the abundance robustness of the six weak r-process stars, firstly we scaled the observed abundances of HD 88609 (Honda et al., 2004, 2007), BD +402621 (Johnson, 2002), HD 4306 (Honda et al., 2004), HD 237846 (Roederer et al., 2010) and HD 140283 (Honda et al., 2004; Roederer, 2012; Siqueira et al., 2012; Bond et al., 2013) to those of HD 122563 (Honda et al., 2004, 2007) and show their abundances in Figure 4 (a). The figure shows that the abundance patterns of the five stars match the abundance pattern of HD 122563 quite well within the observed uncertainties. Furthermore, we derive the average abundance of the six stars and scale the element abundances of the six stars to the average abundances. In the Figure 4 (b), the observed abundances of six weak r-process stars and the average abundances, which have been vertically moved for the sake of display, are presented by filled circles and solid lines. In the Figure 4 (c), the abundance offsets () of the six sample stars are shown. The Figure 4 (d) shows the rms abundance offsets. From the figure we find that the observed abundances of light elements, Fe-peak elements and neutron-capture elements of the six stars match the averaged abundances within 0.2 dex for the most elements. The results also mean that the abundances of light elements, Fe-peak elements and neutron-capture elements of the six stars are in agreement with each other and indicate that the abundance patterns of the weak r-process stars are uniform, which should be important for investigating the site (or sites) and associated physical conditions of the weak r-process nucleosynthesis.
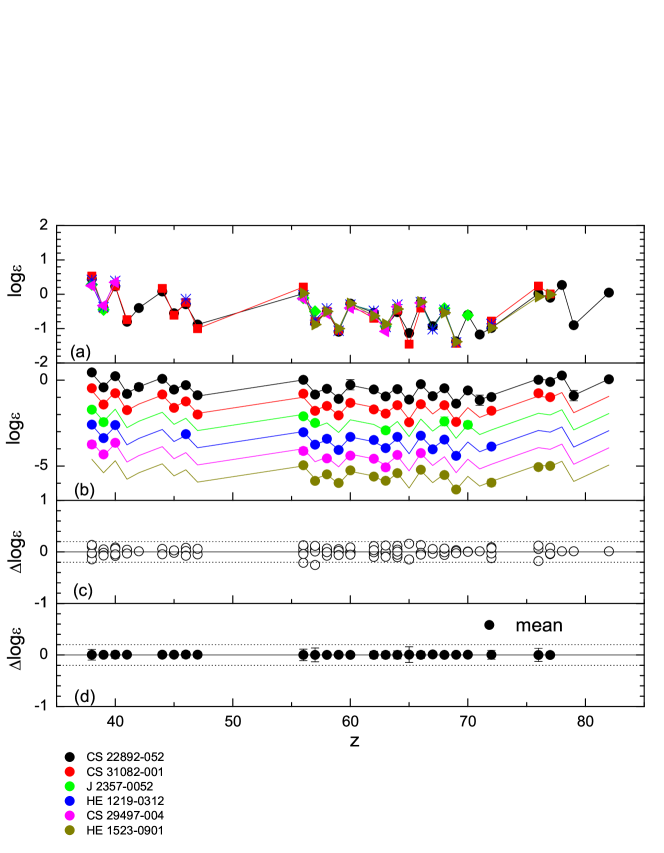
Because of the extreme overabundance of heavier neutron-capture elements () ([Eu/Fe]), two main r-process stars CS 22892-052 and CS 31082-001 were paid attention frequently. It is interesting that the abundances of the heavier neutron-capture elements of the two stars are agreement with the r-process abundances of the Solar system. However, the abundances of the lighter neutron-capture elements (3747) are lower than the r-process abundances (Cowan et al., 1999; Hill et al., 2002; Sneden et al., 2008). Zhang et al. (2010) have found that the abundances of the r-process elements, including lighter neutron-capture elements, of the Solar system could be explained by the contributions of main r-process and weak r-process. For understanding of the r-process nucleosynthesis, the abundance uniform of the lighter neutron-capture elements in the main r-process stars should be important. This reason inspire us to explore the robustness of the abundances of the main r-process stars. In this case, we specially pay attention to the abundances of the neutron-capture elements in the extreme main r-process stars ([r/Fe]). Their heavy-element abundances are expected to be dominantly originate from the main r-process. Six stars, CS 22892-052 (Sneden et al., 2003), CS 31082-001 (Hill et al., 2002), CS 29497-004 (Barklem et al., 2005), HE 1219-0312 (Hayek et al., 2009), HE 1523-091 (Frebel et al., 2007) and SDSS J2357-0052 (Aoki et al., 2010), meet the requirement of the extreme main r-process stars. For exploring the robustness of the abundances in the six sample stars, we first scale the abundances of the neutron-capture elements of CS 31082-001, CS 29497-004, HE 1219-0312, HE 1523-091 and SDSS J2357-0052 to those of CS 22892-052 and show their abundances in Figure 5 (a). The figure shows that the abundance patterns of the five stars match the abundance pattern of CS 22892-052 quite well within the observed uncertainties. Furthermore, we derive the average abundance of the six stars and scale the element abundances of the six stars to the average abundances. In Figure 5 (b), the observed abundances of the six main r-process stars and the average abundances, which also have been vertically moved, are presented by filled circles and solid lines. In Figure 5 (c), the abundance offsets of the six stars are shown. Figure 5 (d) shows the rms abundance offsets. From the figure we find that the abundances of the neutron-capture elements of the six stars match the averaged abundances within 0.2 dex for the most elements. Our finding is that not only the abundances of heavier neutron-capture elements but also the abundances of the lighter neutron-capture elements in the extreme main r-process stars possess robust nature.
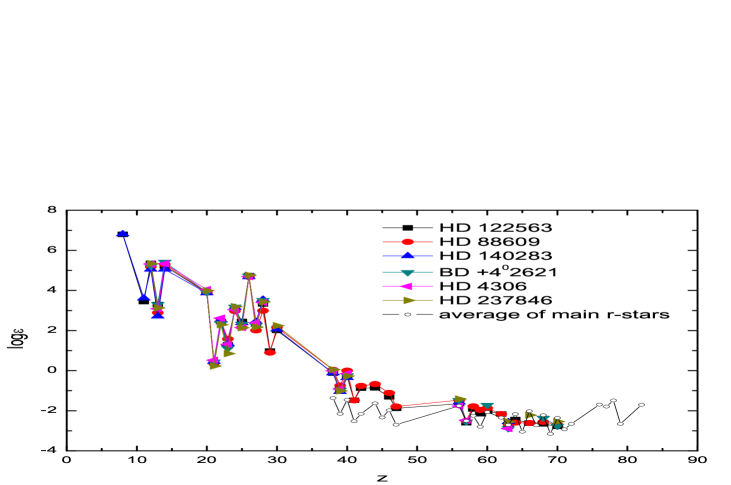
In Figure 6 we compare the abundances of the six weak r-process stars with the average values of the main r-process stars. The average values of the main r-process stars have been scaled to the average Eu abundance of the weak r-process stars. From the figure we can see that the abundance pattern of the neutron-capture elements of the weak r-process stars is clearly distinct from that of the main r-process stars, which should means that the weak r-process and the main r-process are different astrophysical processes.
4 ABUNDANCE CHARACTERISTICS OF THE WEAK R-PROCESS AND MAIN R-PROCESS
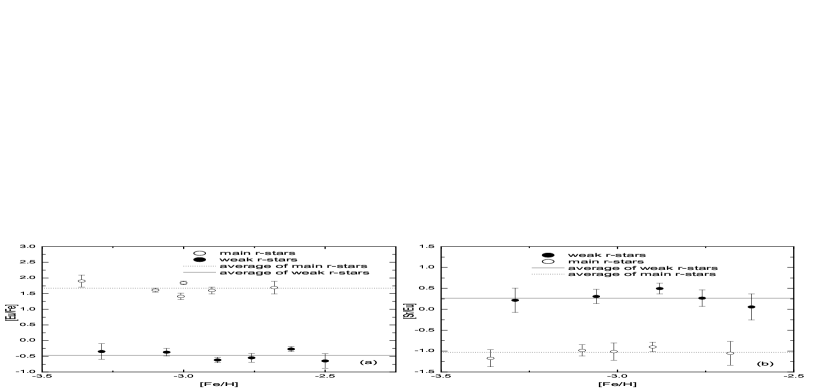
The abundance patterns of the metal-poor stars present significant information to set important constrains on the r-process models and Galactic chemical evolution. In the section, we will analyze abundance characteristics of the weak r-process and main r-process. Figure 7 (a) shows the ratios [Eu/Fe] of the extreme main r-process stars and the weak r-process stars as a function of [Fe/H]. The main r-process stars lie in the top of the figure, while the weak r-process stars lie in the bottom of the figure. The two distinct stellar categories are clear presented: the averaged ratios [Eu/Fe] of the extreme main r-process stars is about 1.7 and the averaged ratios [Eu/Fe] of the weak r-process stars is about -0.5. The difference of the ratios [Eu/Fe] between the two category stars is larger than 2.2 dex. Because of the strong enhancement of the heavier neutron-capture elements, the extreme main r-process stars deserve essential attention. On the other hand, the weak r-process stars are important for exploring the weak r-process, since the main r-process contributions to the abundances of these stars are very small. Figure 7 (b) shows the ratios [Sr/Eu] of the extreme main r-process stars and the weak r-process stars as a function of [Fe/H]. The averaged ratios [Sr/Eu] of the extreme main r-process stars and the weak r-process stars are about -1.2 and 0.4 respectively. The two distinct stellar categories are also clear shown. The figures reconfirm the conclusion reported by Honda et al. (2007) that the abundance pattern of the main r-process stars is obviously different from that of the weak r-process stars.
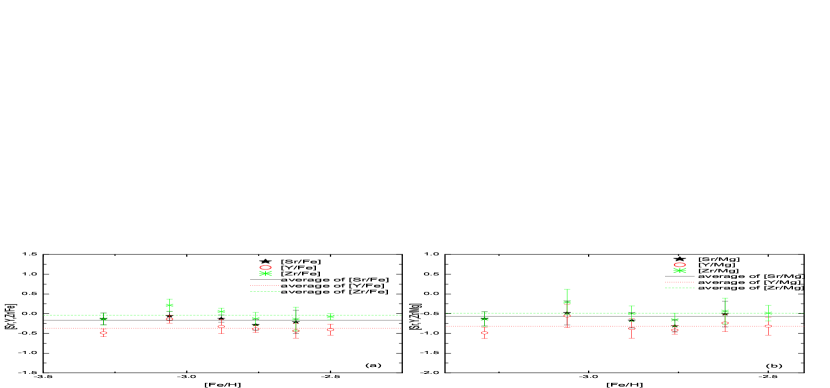
The observed flattened ratios [/Fe] for the low metallicity mean that the elements and Fe element in the metal-poor stars dominantly originate from the primary-like yields (i.e. the yields are independent of initial metallicity approximately) of the massive stars. Figure 8 (a) shows the ratios [Sr,Y,Zr/Fe] of the weak r-process stars as a function of [Fe/H]. The relative abundance ratios [Sr,Y,Zr/Fe] appear to be independent of metallicity. These correlations imply that the weak r-process elements and primary Fe element are ejected from similar astrophysical objects, i.e.the iron-group elements at the low metallicity are synthesized in the massive stars (progenitors of SNe II), the weak r-process elements should be produced in the SNe II. To investigate the abundance characteristics of the weak r-process, the relations between the abundances of the weak r-process elements and elements are important, since elements are dominantly synthesized in the massive stars and should be primary elements (Woosley et al., 1995; Kobayashi et al., 2006). Figure 8 (b) shows the ratios [Sr,Y,Zr/Mg] of the weak r-process stars as a function of [Fe/H]. The relative abundance ratios [Sr,Y,Zr/Mg] also show the flattened trends: these strongly support the viewpoint that the weak r-process elements are produced in the SNe II and the yields of the weak r-process elements have the primary-like nature. Based on the chemical evolution calculations, Travaglio et al. (2004) found that, for explaining the abundances of the lighter neutron-capture elements, an additional nucleosynthesis process : lighter element primary process (LEPP) is needed. The observed trends of [Sr,Y,Zr/Fe] and [Sr,Y,Zr/Mg] for the weak r-process stars should be the direct evidences that the weak r-process elements are produced by the lighter element primary process (LEPP) in the massive stars.
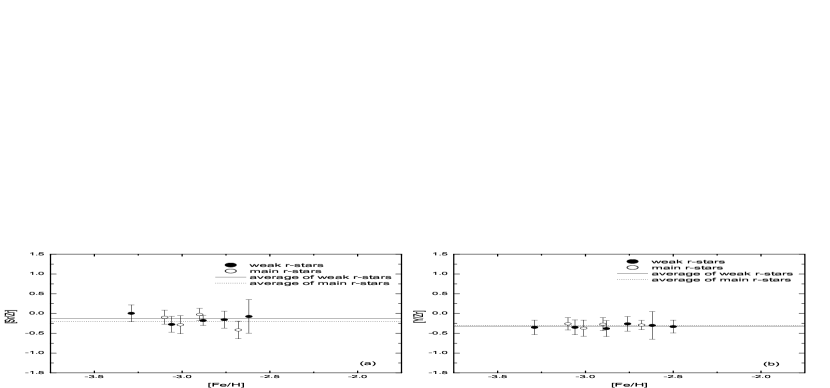
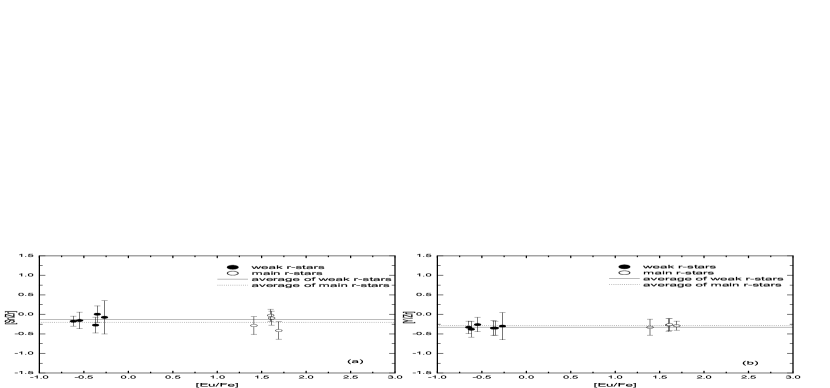
For further exploring the abundance characteristics of the lighter neutron-capture elements in the two category stars, Figure 9 (a) and (b) show the ratios [Sr/Zr] and [Y/Zr] of the extreme main r-process stars and the weak r-process stars as a function of [Fe/H] respectively. It is interesting to note that the averaged ratios [Sr/Zr] and [Y/Zr] of the weak r-process stars are closed to the corresponding ratios of the main r-process stars. The finding means that the averaged yield fraction of Sr and Zr (or Y and Zr) of the weak r-process events is close to that of the main r-process events. Travaglio et al. (2004) have found that, although the scatter of the abundance ratios [Sr/Fe] of the metal-poor stars reaches about 2.0 dex, the scatter of the abundance ratios [Sr/Zr] is smaller than 1.0 dex. Note that, if the neutron-capture processes only contain the main r-process and the weak r-process for the low metallicity, the scatter of the observed abundance ratios [Sr/Zr] for the metal-poor stars should be small. This prediction is qualitatively consistent with the observed results for the metal-poor stars. Figure 10 (a) and (b) show the ratios [Sr/Zr] and [Y/Zr] of the extreme main r-process stars and the weak r-process stars as a function of [Eu/Fe] respectively. From the figures we can see that, although the two distinct stellar categories are clear shown, the averaged ratios [Sr/Zr] and [Y/Zr] of the weak r-process stars are close to the corresponding ratios of the main r-process stars.
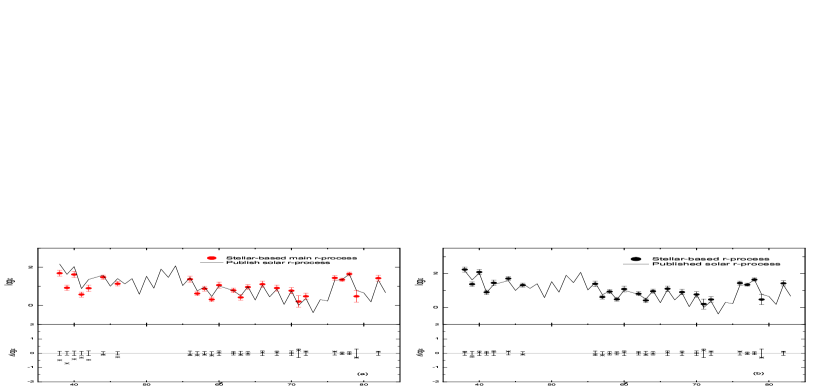
In general, the abundances of the Solar system have significant meanings, since they are seemed as the standard pattern. The abundances of the r-process are obtained by subtracting the abundances of the s-process from the abundances of the Solar system (Arlandini et al., 1999). Adopting the observed abundances of the two main r-process stars and two weak r-process stars, the mixed abundances have been used to compare with the abundances of the r-process in the Solar system (Zhang et al., 2010). Furthermore, Li et al. (2013); Hansen et al. (2014) have derived the pure abundances of the weak r-process and the main r-process adopting iterative method. Note that, although a weak r-process star is formed in a gas clouds which is polluted mainly by the weak r-process material, the gas clouds should initially have contained some main r-process elements, such as Eu. On the other hand, although a main r-process star is formed in a gas clouds which is polluted mainly by the main r-process material, the gas clouds should initially have contained some weak r-process elements, such as some lighter neutron-capture elements. Based on the averaged abundances of the six weak r-process stars and the six main r-process stars, adopting similar method presented by Li et al. (2013), we derive the abundances of the weak r-process and the main r-process, which are called as the stellar-based weak r- and main r-process abundances respectively. It is interesting to investigate the relation between the stellar-based r-process abundances and the Solar r-process abundances. In this case, we use the stellar-based main r-process abundances to fit the Solar r-process abundances from Eu to Pb. The Solar r-process abundances are taken from Arlandini et al. (1999) and Travaglio et al. (2004) (for Sr-Nb). From the Figure 11 (a) we can see that, for the most elements heavier than Ba, the stellar-based main r-process abundances are good agreement with the Solar r-process abundances. However, the stellar-based main r-process abundances are lower than the Solar r-process abundances for the most lighter neutron-capture elements. This fact, which have been found by many works (e.g., Sneden et al. (2000); Hill et al. (2002)), implies that the abundances of the r-process in the Solar system cannot be interpreted by one main r-process. Although the agreement does not extend to the lighter neutron-capture elements, it is believed that the abundances have been extended to the lighter neutron-capture elements (e.g., Sr, Y and Zr) for the main r-process. Obviously, in order to explain the abundances of the r-process in the Solar system, another unknown primary process producing lighter neutron-capture elements is needed. This process is called as lighter element primary process (LEPP) (Travaglio et al., 2004) or weak r-process (Wanajo & Ishimaru, 2006).
Travaglio et al. (2004) have reported that it is not clear how the LEPP abundances for the lighter neutron-capture elements in low metallicity evolve to corresponding abundances in the Solar system and metal-rich stars. The missing component mentioned above should meet two requirements at least. Firstly, it have primary nature and should appear in the abundances of the metal-poor stars. Secondly, it could compensate the abundance deficiency of the lighter neutron-capture elements of the main r-process shown in Figure 11 (a). Obviously, new derived weak r-process component have meet the first requirement. For exploring the role of the weak r-process component, after adding the contribution of the weak r-process component, we use the combined abundances of the main r-process and the weak r-process to fit the abundances of the Solar r-process. In Figure 11 (b), the fitted results are shown and compared with the abundances of the Solar r-process. The comparison reveals a nearly perfect agreement between the calculated abundances and the abundances of the Solar r-process in the wide range of elements from Sr to Pb. The derived results have significant meanings. Firstly, the weak r-process component can compensate the abundance deficiency of the lighter neutron-capture elements of the main r-process, which implies the abundances of the Solar r-process are the combined results of the weak r-process component and the main r-process component. Secondly, although the names “LEPP” and “the weak r-process” are different, they are one identical process, whose abundances are the part of the abundances of the r-process. Thirdly, the production of the weak r-process appear in the metal-poor stars and have primary nature, which is consistent with the LEPP predicted by Travaglio et al. (2004). Fourthly, although the weak r-process component and the main r-process component are derived from the abundances of the metal-poor stars, the abundances of the Solar r-process can be explained by the mixing of the two components, which should be another evidence that the abundance pattern of the weak r-process is uniform and independent of metallicity. Fifthly, because elements, iron-group elements and the weak r-process elements in the metal-poor stars originate from the similar astrophysical objects, while the main r-process elements do not couple with the light elements, the two r-processes should not occurred in the similar astrophysical objects. In this case, we suggested that the weak r-process and the main r-process are two distinct astrophysical processes. Finally, because the weak r-process elements are coupled with the primary Fe and elements, the weak r-process is a general phenomenon in our Galaxy, which means that almost all the metal-poor stars and population I stars have been polluted by the weak r-process.
5 CONCLUSIONS
The elemental abundances of the metal-poor stars contain wealth nucleosynthetic information. In this aspect, the abundances of the weak r-process stars and extreme main r-process stars are very important for investigating the sites and physical conditions of the r-process. In this work, started from the abundances of the metal-poor star HD 140283, we investigate the abundance characteristics of the weak r-process and main r-process. Our results and concluding remarks can be listed as follows:
1. Based on the obtained component coefficients, we find that HD 140283 is a weak r-process star. The astrophysical reason that the observed ratio [Ba/Eu] is close to the ratio of the main r-process is that Ba and Eu in this weak r-process star mainly come from the main r-process.
2. Through comparing of the abundances in the six weak r-process stars, we find that the abundances of the weak r-process stars possess uniform nature. Because the uniform nature of the weak r-process stars has extended to the abundances of the light and iron-group elements, the abundance pattern contains more information and could be used to constraint astrophysical sites and conditions of the weak r-process nucleosynthesis.
3. For the extreme main r-process stars, we find that not only the abundances of the heavier neutron-capture elements but also the abundances of the lighter neutron-capture elements possess robust nature, which should provide more astrophysical information to constraint the main r-process nucleosynthesis.
4. For the weak r-process stars, The variations of the ratios [Sr,Y,Zr/Fe] and [Sr,Y,Zr/Mg] with metallicity [Fe/H] show the flattened trends. Because the elements and Fe element in the metal-poor stars dominantly originate from the primary-like yields of the massive stars, the correlations imply that the weak r-process elements and primary Fe element (and primary elements) are ejected from similar astrophysical objects. The observed trends of [Sr,Y,Zr/Fe] and [Sr,Y,Zr/Mg] for the weak r-process stars should be the direct evidences that the weak r-process elements are produced by the lighter element primary process (LEPP) in the massive stars.
5. The averaged ratio [Sr/Zr] (or [Y/Zr]) of the weak r-process stars are closed to the corresponding ratio of the main r-process stars, which means that the averaged yield fraction of Sr and Zr (or Y and Zr) of the weak r-process events is close to that of the main r-process events.
6. Based on the averaged abundances of the weak r-process stars and the main r-process stars, we derive the abundance patterns of the weak r-process and the main r-process. Because the abundances of the main r-process have been extended to the lighter neutron-capture elements (e.g., Sr, Y and Zr) the abundances of the weak r-process have been extended to the light elements and iron-group elements, the new derived abundances of the main r-process and the weak r-process should be used to investigate the astrophysical sites and physical conditions of the corresponding r-processes.
7. The abundances of the main r-process are good agreement with the abundances of the r-process of the Solar system for the elements heavier than Ba, while the abundances of the main r-process are lower than corresponding abundances of the r-process of the Solar system for the most lighter neutron-capture elements.
8. For exploring the role of the weak r-process component, we use the combined abundances of the main r-process and the weak r-process to fit the abundances of the Solar r-process. The results show a nearly perfect agreement between the calculated abundances and the Solar r-process abundances in the wide range of elements from Sr to Pb, which implies that the weak r-process component can compensate the abundance deficiency of the lighter neutron-capture elements of the main r-process. The metallicity of the solar system is much higher than that of the weak r-process stars. The results mean that the pattern of the weak r-process, which contributes the weak r-process elements to the Galaxy from early time to the epoch of solar system formation, is “robust” within the observed uncertainties, i.e. the weak r-process invariably produce the uniform abundance pattern.
In the past few decades, a large number of works have been done to investigate the astrophysical origin of the neutron-capture elements. In this field, the observations of the neutron-capture elements for metal-poor stars present a important chance to determine the abundance patterns synthesize by individual neutron-capture processes in the early Galaxy. Up to now, the astrophysical sites of the r-process have not been fully confirmed. The results derived in this work could provide the more constrains on the study of the weak r-process and main r-process. We wish the derived results can be used to investigate the astrophysical sites and physical conditions of the weak r-process and main r-process. Clearly, more observational abundances, particularly for the weak r-process stars and main r-process stars, are significant to identify the real sites of the r-process.
References
- Aoki et al. (2010) Aoki, W., Beers, T. C., Honda, S., Carollo, D. 2010, ApJ723, L201
- Arlandini et al. (1999) Arlandini, C., Käppeler, F., Wisshak, K., Gallino, R., Lugaro, M., Busso, M., & Straniero, O. 1999, ApJ, 525, 886
- Barklem et al. (2005) Barklem, P. S., et al. 2005, A&A, 439, 129
- Burbidge et al. (1957) Burbidge, E. M., Burbidge, G. R., Fowler, W. A., & Hoyle, F. 1957, Rev. Mod. Phys, 29, 547
- Bond et al. (2013) Bond, H. E., Nelan, E. P., VandenBerg, D. A., Schaefer, G. H., Harmer, D. 2013, ApJ, 765, L12
- Chamberlain & Aller (1951) Chamberlain, J. W., & Aller, L. H. 1951, ApJ, 114, 52
- Cowan et al. (1999) Cowan, J. J., Pfeiffer, B., Kratz, K.-L., Thielemann, F.-K., Sneden, C., Burles, S.,Tytler, D., & Beers, T. C. 1999, ApJ, 521, 194
- Frebel et al. (2007) Frebel, A., Christlieb, N., Norris, J. E., Thom, C., Beers, T. C., Rhee, J. 2007, ApJ, 660, L117
- Gallagher et al. (2010) Gallagher, A. J., Ryan, S. G., García Pérez, A. E. et al. 2010, A&A, 523, A24
- Hansen et al. (2014) Hansen, C. J., Montes, F., Arcones, A. 2014, arxiv:1408.4135v1
- Hayek et al. (2009) Hayek, W., et al. 2009, A&A, 504, 511
- Hill et al. (2002) Hill, V., et al. 2002, A&A, 387, 560
- Honda et al. (2004) Honda, S., Aoki, W., Kajino, T., Ando, H., Beers, T. C., Izumiura, H., Sadakane, K., Takada-Hidai, M. 2004, ApJ, 607, 474
- Honda et al. (2007) Honda, S., Aoki, W., Ishimaru, Y., Wanajo, S. 2007, ApJ, 666, 1189
- Johnson (2002) Johnson, J. 2002, ApJS, 139, 219
- Kobayashi et al. (2006) Kobayashi, C., Umeda, H., Nomoto, K., Tominaga, N., Ohkubo, T. 2006, ApJ, 653, 1145
- Lamb et al. (2002) Lambert, D. L., & Allende Prieto, C. 2002, MNRAS, 335, 325
- Li et al. (2013) Li, H. J., Shen X.J., Liang, S., Cui, W. Y., Zhang, B. 2013, PASP, 125, 143
- Magain (1995) Magain, P. 1995, A&A, 297,686
- Montes et al. (2007) Montes, F., et al. 2007, ApJ, 671, 1685
- Roederer et al. (2010) Roederer, I. U., Sneden, C., Thompson, I. B., Preston, G. W., & Shectman, S. A. 2010, ApJ, 711, 573
- Roederer (2012) Roederer, I. U. 2012, ApJ, 756, 36
- Siqueira et al. (2012) Siqueira Mello, C., Barbuy, B., Spite, M., Spite, F. 2012, A&A, 548, 42
- Sneden et al. (2000) Sneden, C., Cowan, J. J., Ivans, I. I., Fuller, G. M., Burles, S.,Beers, T. C., Lawer, J. E. 2000,ApJ, 533, L139
- Sneden et al. (2003) Sneden, C., Cowan, J. J., Lawler, J. E., Ivans, I. I., Burles, S., et al. 2003, ApJ, 591, 936
- Sneden et al. (2008) Sneden, C., Cowan, J. J., & Gallino, R. 2008, ARA&A, 46, 241
- Travaglio et al. (2004) Travaglio, C., Gallino, R., Arnone, E., Cowan, J., Jordan, F., Sneden, C. 2004, ApJ, 601, 864
- Wanajo & Ishimaru (2006) Wanajo S., Ishimaru, Y. 2006, Nucl. Phys. A, 777, 676
- Woosley et al. (1995) Woosley, S. E., Weaver, T. A. 1995, APSS, 101, 181
- Zhang et al. (2010) Zhang, Jiang., Cui, Wenyuan., Zhang, Bo. 2010, MNRAS, 409, 1068